Your browser does not fully support modern features. Please upgrade for a smoother experience.
Please note this is a comparison between Version 2 by Yaman Sufian Albadawi and Version 1 by Yaman Sufian Albadawi.
Drowsiness-related car accidents continue to have a significant effect on road safety. Many of these accidents can be eliminated by alerting the drivers once they start feeling drowsy. Image-based systems are the most commonly used techniques for detecting driver drowsiness. Facial parameters such as the eyes, mouth, and head can be used to identify many visual behaviors that fatigued people exhibit.
- driver drowsiness detection
- visual features
1. Introduction
Drowsiness is a major concern with respect to road safety. Drivers’ unconsciousness due to microsleep can frequently lead to destructive accidents. Falling asleep at the wheel is usually related to lack of sleep, exhaustion, or mental health problems. In the UAE, the ministry of interior recorded 2931 car crashes in 2020. The number increased in 2021 to 3488 records. The majority of these traffic accidents were caused by distracted driving due to drowsiness, sudden swerving, or failure to maintain a safe distance between vehicles [1]. In this situation, it is crucial to exploit new technologies to plan and design systems that can track drivers and estimate their level of attention while driving. As multiple countries are concerned regarding this issue, researchers worldwide worked on building Driver Drowsiness Detection (DDD) systems that are capable of detecting drivers’ drowsiness signs in the early stages.
According to the literature, drowsiness detection systems can be grouped into three categories based on the measures that are used to detect the drowsiness signs [2][3][4][5]: biological-based, vehicle-based, and image-based systems. In the first category, biological-based measures rely on monitoring the body’s physiological signals including, ElectroEncephaloGraphy (EEG), ElectroCardioGraphy (ECG), ElectroMyoGraphy (EMG), Electro-OculoGraphy (EOG) signals, and blood pressure [6][7][8][9]. In this type of system, drowsiness is determined by detecting the signal’s deviation from the standard state’s characteristics and analyzing if the new signal indicates drowsiness. In the second category, vehicle-based measures depend on monitoring variations in the car’s movement patterns through different sensors’ installed to measure various vehicle and street parameters. To infer the drowsiness level, vehicle-based systems analyze the changes or abnormal behavior of the car, including, for example, the steering wheel angle, speed, or deviation from the lane [10][11]. The third category is the image-based measures which depend mainly on the drowsiness signs that appear on the driver’s face and head. These systems detect drowsiness by monitoring the drivers’ head movements and facial parameters such as the eyes, mouth facial expressions, eyebrows, or respiration [12][13][14].
All three categories have some limitations [2][15]. Biological-based systems can detect drowsiness in the initial stages due to their ability to compare the continuous changes in the physiological signals, but, in most biological-based systems, it is demanded that electrodes be connected to the driver’s body. This setup is usually inconvenient and uncomfortable for the driver. It also involves noise that affects the signal quality, leading to decreased accuracy. Vehicle-based systems depend generally on vehicle types, and can greatly be affected by multiple factors, including road characteristics, climate conditions, and the driver’s experience, habits, and ability to drive. Limitations of the image-based systems are strictly related to the quality of the camera used and its adaptability to different lighting conditions. The existence of objects covering parts of the face, such as glasses, sunglasses, masks, etc., can also affect the accuracy of image-based DDD systems. However, among these three systems, image-based systems are considered to be fully non-invasive, low cost, and minimally affected by road conditions. Therefore, image-based measures are widely deployed to develop versatile, affordable, real-time and, fully portable DDD devices [2][12][13][14][16][17].
In this work, we present a new image-based DDD system. It uses a unique combination of features derived from the driver’s facial parameters to train and test three classifiers, namely Random Forest (RF), sequential Neural Networks (NN), and linear Support Vector Machine (SVM). The features used in this system are Eye Aspect Ratio (EAR), Mouth Aspect Ratio (MAR), and head pose estimation. The proposed system is convenient for the driver in the sense that it does not require any sensors or equipment to be attached to the driver’s body. It is adaptable to be used in different vehicles, including buses, cars, motorcycles, and others. Evaluations of the proposed system on the National Tsing Hua University DDD (NTHUDDD) video dataset show that it can achieve accuracy up to 99%, indicating that it is an effective solution.
2. Related Work
The problem of driver drowsiness detection has been studied by many researchers worldwide. The proposed approaches to tackle the problem can be mainly differentiated based on the drowsiness indicative features used [2]. Driver drowsiness indicative features obtained from body signs measurements (such as EEG, ECG, PPG, and EMG) are referred to as biological features, which, although accurate in detecting drowsiness, are inconvenient for the driver as they involve the use of sensors attached to the driver’s body [2][6][7][8][9]. Other widely used driver drowsiness indicative features are based on vehicle driving patterns where measurements such as the steering wheel angle and lane departure frequency are related to the driver drowsiness levels [2]. Although convenient for the driver, the literature shows that the accuracy of this method is not high [10][11]. The third drowsiness indicative features are image based. They are usually obtained from videos monitoring the driver’s behavior to extract features relating to the driver’s eye, mouth, and head movements [2]. They are more convenient for the driver than the biological-based ones as they do not involve attaching equipment or sensors to the driver’s body. Image-based systems are the most commonly used techniques for detecting driver drowsiness. Facial parameters such as the eyes, mouth, and head can be used to identify many visual behaviors that fatigued people exhibit. Such drowsy behaviors can be recorded by cameras or visual sensors. Then, from these records, several features can be extracted, and by using computer vision techniques they are analyzed to visually observe the driver’s physical condition in order to detect drowsiness in a non-invasive manner. Broadly, image-based systems are categorized into three categories depending on the observation of the eyes, mouth, and head movements [2]. Various image-based features have been used in the literature. These include blink frequency, maximum duration of closure of the eyes [13], percentage of eyelid closure [18], eye aspect ratio [19], eyelids’ curvature [17], yawning frequency [20], MAR [21], mouth opening time [22], head pose [23], head-nodding frequency [4], and head movement analysis [24]. Combinations of these features have been considered as well [20][21][25]. In this section, we provide a detailed explanation of the features that are used in our proposed system. The most common features used to detect drowsiness in image-based systems are extracted from the eye region. Several researchers proposed the EAR [26][27][28] as a simple metric to detect eye blinking using facial landmarks. It is utilized to estimate the eye openness degree. A sharp drop in the EAR value leads to a blink being recorded. Maior et al. [27] developed a drowsiness detection system based on the EAR metric. They calculated the EAR values for consecutive frames and used them as inputs for machine learning algorithms including the multilayer perceptron, RF, and SVM classification models. Their evaluation results showed that the SVM performed the best with 94.9% accuracy. The EAR metric was also used in [29], who explored drowsiness as an input for a binary SVM classifier. The model detected the driver’s drowsiness state with 97.5% accuracy. Mouth behavior is a good indicator of drowsiness as it provides useful features for DDD. In [30], the authors proposed to track mouth movement to recognize yawning as a drowsiness indicator. In their experiment, they used a dataset of 20 yawning images and over 1000 normal images. The system used a cascade classifier to locate the driver’s mouth from the face images, followed by an SVM classifier to identify yawning and alert the driver. The final results gave a yawning detection rate of 81%. Another mouth-based feature is the mouth opening ratio [29]. It is also referred to as the MAR [21]. It describes the opening degree of the mouth as an indicator for yawning. This feature was fed to an SVM classifier in [29], achieving an accuracy of 97.5%. Another useful parameter for detecting drowsiness in image-based systems is head movements which can signal drowsy behavior. Accordingly, they can be used to derive features that are useful for detecting drowsiness using machine learning. Such head features include head-nodding direction, head-nodding frequency [4], and head pose [31]. In [31], the forehead was used as a reference to detect the driver’s head pose. Infrared sensors were used in [24] to follow the head movement and detect the driver’s fatigue. In [32][33], before head position analysis was performed, a special micro-nod detection sensor was used in real-time to track the head pose feature in 3D. Moujahid et al. [20] presented a face-monitoring drowsiness-detection system that captured the most prominent drowsiness features using a hand-crafted compact face texture descriptor. Initially, they recorded three drowsiness features, namely head nodding, yawning frequency, and blinking rate. After that, they applied pyramid multi-level face representation and feature selection to achieve compactness. Lastly, they employed a non-linear SVM classifier that resulted in an accuracy of 79.84%. Dua et al. [34], introduced a driver drowsiness-detection architecture that used four deep learning models: ResNet, AlexNet, FlowImageNet, and VGG-FaceNet. These models are extracted from the driver’s footage features that include head gestures, hand gestures, behavioral features (i.e., head, mouth, and eye movements), and facial expressions. Simulated driving videos were fed to the four deep learning models. The outputs of the four models were fed to a simple averaging ensemble algorithm followed by a SoftMax classifier, which resulted in 85% overall accuracy.3. Driver Drowsiness Detection with Visual Features
3.1. System Design
The flowchart in Figure 1 shows the design flow of the proposed drowsiness-detection system. The system design consists of five main steps. In the first step, the system starts by capturing a video that monitors the driver’s head and extracts frames from it. The second step is preprocessing, where first, the Blue, Green, and Red (BGR) colored frames are each converted to grayscale. Then, for the eyes and mouth region, face detection is applied by utilizing the Dlib Histogram of Oriented Gradients (HOG) face detector [3518]. The Dlib facial landmarks detector is then applied to extract the eyes and mouth regions. Lastly, in the preprocessing step, to capture the head region, MediaPipe face mesh [3619] is used to obtain a 3D map of the face and extract the 3D nose coordinates to use as a reference to estimate the driver’s head position.
Figure 1. System design.
3.2. Feature Extraction
Various human and vehicle features were used to model different drowsiness detection systems. However, in this work, the modeling is based on the EAR and MAR metrics along with drowsy head pose estimation.3.2.1. EAR Metric
According to Rosebrock [19], detecting blinking using the EAR feature has multiple advantages compared to detection with traditional image-processing methods. In traditional methods, first eye localization is applied. Then, thresholding is used to find the whites of the eyes in the image. Following that, eye blinking is indicated by detecting the disappearance of the eye’s white region. In contrast, no image processing is needed when using the EAR metric. Thus, using it will require less memory space and processing time. Instead, the EAR feature depends on calculating the ratio of the distance between eyes’ facial landmarks, which makes it a straightforward solution. In general, the EAR metric computes a ratio extracted from the horizontal and vertical distances of six eye landmark coordinates, as shown in Figure 4 [37]. These coordinates are numbered from the left eye corner starting from p1 and revolving clockwise to p6. Rosebrock [19] explains that all six coordinates from p1 to p6 are two-dimensional. According to [38], in the case of open eyes, the EAR value remains approximately constant. However, if the eyes were closed, the difference between coordinates p3 and p5 and p2 and p6 demolishes; thus, the EAR value drops down to zero, as illustrated in Figure 4. In order to extract the EAR feature, the EAR formula below was utilized. To compute the EAR ratio value, the numerator calculates the distance between the vertical landmarks. While the denominator calculates the distance between the horizontal landmarks and multiplies it by two to balance it with the nominator [38]. By utilizing the EAR formula below, the EAR values were calculated for each frame and stored in a list.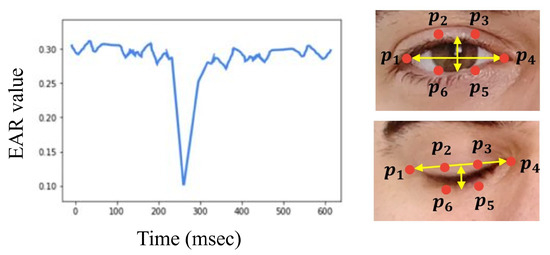

3.2.2. MAR Metric
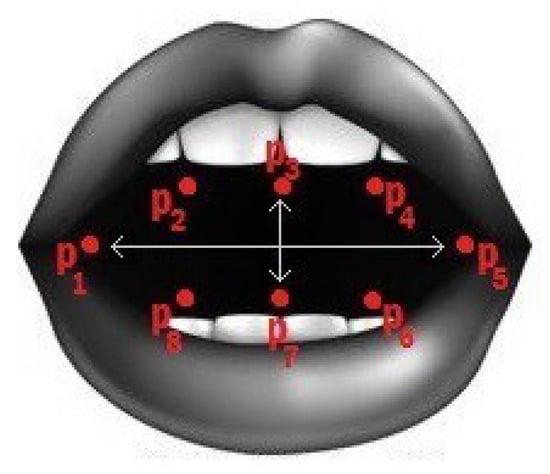
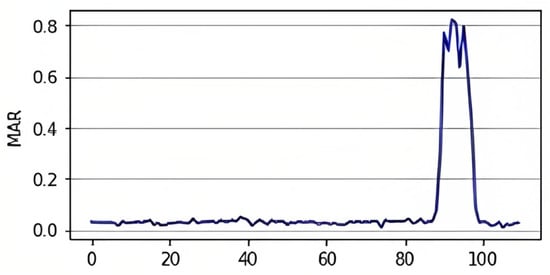
Similar to the EAR, the mouth aspect ratio, or MAR, is used to calculate the openness degree of the mouth. In this facial landmark, the mouth is characterized by 20 coordinates (from 49 to 68), as shown in Figure 3a. However, we used points from 61 to 68, as displayed in Figure 5, to obtain the mouth openness degree. Using these coordinates, the distance between the top lip and the bottom lip is calculated using the MAR formula below to determine whether the mouth is open or not [39]. In the MAR formula, the numerator calculates the distance between the vertical coordinates, and the denominator calculates the distance between the horizontal coordinates. Similarly to the EAR formula, the denominator is multiplied by two to balance it with the nominator. As shown in Figure 6, increasing the value of the MAR indicates the mouth is open.

3.2.3 Drowsy Head Pose
In this work, head pose estimation was achieved by finding the rotation angle of the head. The rotation angle can be defined as the amount of rotation of an object around a fixed point referred to as the point of rotation. To find the rotation angle of the head, first, the center nose landmark was acquired using MediaPipe face mesh for use as a reference and as the point of rotation for the head position in the frame, as mentioned earlier in preprocessing. Then, the nose’s X and Y landmarks were normalized by multiplying them by the frame width and height, respectively. Following that, by taking the initial nose 3D coordinates as the point of rotation, the rotation angles of the X and Y axis are calculated and used to estimate if the head position is up, down, left, or right based on a set of thresholds. We have estimated the angle thresholds as follows:-
Head pose up, if X of angle 7°
-
Head pose down, if X of angle −7°
-
Head pose right, if Y of angle 7°
-
Head pose left, if Y of angle −7°
43. Results
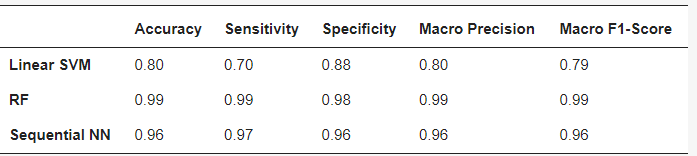
Table 6 illustrates the results of the trained models. The results show that the best performance is achieved by the RF model. When analyzing the results, it is evident that the RF model gave an almost perfect performance as it achieved 99% in accuracy, sensitivity, specificity, macro precision, and macro F1-score. In terms of the performance of the sequential NN model, it achieved second-best results with 96% accuracy, 97% sensitivity, and 96% specificity, macro precision & macro F1-score. As for the SVM model, it achieved the lowest results, where it showed 80% accuracy, 70% sensitivity, and 88% specificity.Table 6. Results of the proposed DDD system.
The above results clearly show that our proposed system can differentiate drowsy drivers from alert ones. It is easy to use and convenient for the drivers as it is non-invasive, non-intrusive, and does not require any sensors or equipment to be attached to the driver’s body. It is also adaptable to be used in different vehicles, including buses, trucks, cars, motorcycles, and construction vehicles.
5. Conclusion
In conclusion, in this paper, we proposed a real-time image-based drowsiness detection system. In order to implement drowsiness detection, a webcam was used to detect the driver in real-time and extract the drowsiness signs from the eyes, mouth, and head. Then three classifiers were applied at the final stage. When a drowsiness sign is detected, an alarm sounds, alerting the driver and ensuring road safety. Evaluation of system performance over the NTHUDDD dataset resulted in an accuracy of 99% for the RF classifier. In the future, we plan to develop a mobile application to allow users to easily use the system while driving. Furthermore, to overcome the limitation of the HOG face detector, we intend to use a more advanced camera that can adapt to the changes in lighting intensity and automatically detect and focus on the driver’s face.
References
- Al Amir, S. Road Accidents in UAE Caused 381 Deaths Last Year. Available online: https://www.thenationalnews.com (accessed on 10 December 2022).
- Albadawi, Y.; Takruri, M.; Awad, M. A review of recent developments in driver drowsiness detection systems. Sensors 2022, 22, 2069.
- Ramzan, M.; Khan, H.U.; Awan, S.M.; Ismail, A.; Ilyas, M.; Mahmood, A. A survey on state-of-the-art drowsiness detection techniques. IEEE Access 2019, 7, 61904–61919.
- Sikander, G.; Anwar, S. Driver fatigue detection systems: A review. IEEE Trans. Intell. Transp. Syst. 2018, 20, 2339–2352.
- Pratama, B.G.; Ardiyanto, I.; Adji, T.B. A review on driver drowsiness based on image, bio-signal, and driver behavior. In Proceedings of the IEEE 2017 3rd International Conference on Science and Technology-Computer (ICST), Yogyakarta, Indonesia, 11–12 July 2017; pp. 70–75.
- Kaur, R.; Singh, K. Drowsiness detection based on EEG signal analysis using EMD and trained neural network. Int. J. Sci. Res. 2013, 10, 157–161.
- Kundinger, T.; Sofra, N.; Riener, A. Assessment of the potential of wrist-worn wearable sensors for driver drowsiness detection. Sensors 2020, 20, 1029.
- Sahayadhas, A.; Sundaraj, K.; Murugappan, M.; Palaniappan, R. Physiological signal based detection of driver hypovigilance using higher order spectra. Expert Syst. Appl. 2015, 42, 8669–8677.
- Khushaba, R.N.; Kodagoda, S.; Lal, S.; Dissanayake, G. Driver drowsiness classification using fuzzy wavelet-packet-based feature-extraction algorithm. IEEE Trans. Biomed. Eng. 2010, 58, 121–131.
- McDonald, A.D.; Schwarz, C.; Lee, J.D.; Brown, T.L. Real-time detection of drowsiness related lane departures using steering wheel angle. In Proceedings of the Human Factors and Ergonomics Society Annual Meeting; Sage Publications: Los Angeles, CA, USA, 2012; Volume 56, pp. 2201–2205.
- Ma, J.; Murphey, Y.L.; Zhao, H. Real time drowsiness detection based on lateral distance using wavelet transform and neural network. In Proceedings of the 2015 IEEE Symposium Series on Computational Intelligence, Cape Town, South Africa, 7–10 December 2015; pp. 411–418.
- Kiashari, S.E.H.; Nahvi, A.; Bakhoda, H.; Homayounfard, A.; Tashakori, M. Evaluation of driver drowsiness using respiration analysis by thermal imaging on a driving simulator. Multimed. Tools Appl. 2020, 79, 17793–17815.
- Bamidele, A.A.; Kamardin, K.; Abd Aziz, N.S.N.; Sam, S.M.; Ahmed, I.S.; Azizan, A.; Bani, N.A.; Kaidi, H.M. Non-intrusive driver drowsiness detection based on face and eye tracking. Int. J. Adv. Comput. Sci. Appl. 2019, 10.
- Khunpisuth, O.; Chotchinasri, T.; Koschakosai, V.; Hnoohom, N. Driver drowsiness detection using eye-closeness detection. In Proceedings of the 2016 12th International Conference on Signal-Image Technology & Internet-Based Systems (SITIS), Naples, Italy, 28 November–1 December 2016; pp. 661–668.
- Triyanti, V.; Iridiastadi, H. Challenges in detecting drowsiness based on driver’s behavior. IOP Conf. Ser. Mater. Sci. Eng. 2017, 277, 012042.
- Knapik, M.; Cyganek, B. Driver’s fatigue recognition based on yawn detection in thermal images. Neurocomputing 2019, 338, 274–292.
- Tayab Khan, M.; Anwar, H.; Ullah, F.; Ur Rehman, A.; Ullah, R.; Iqbal, A.; Lee, B.H.; Kwak, K.S. Smart real-time video surveillance platform for drowsiness detection based on eyelid closure. Wirel. Commun. Mob. Comput. 2019, 2019, 2036818.
- Lin, S.T.; Tan, Y.Y.; Chua, P.Y.; Tey, L.K.; Ang, C.H. Perclos threshold for drowsiness detection during real driving. J. Vis. 2012, 12, 546. Rosebrock, A. Face Detection with Dlib (Hog and CNN). Available online: https://pyimagesearch.com/2021/04/19/face-detection-with-dlib-hog-and-cnn/ (accessed on 7 May 2022).
- Rosebrock, A. Eye Blink Detection with Opencv, Python, and Dlib. Available online: https://pyimagesearch.com/2017/04/24/eye-blink-detection-opencv-python-dlib/ (accessed on 7 May 2022).Kartynnik, Y.; Ablavatski, A.; Grishchenko, I.; Grundmann, M. Real-time facial surface geometry from monocular video on mobile GPUs. arXiv 2019, arXiv:1907.06724.
- Moujahid, A.; Dornaika, F.; Arganda-Carreras, I.; Reta, J. Efficient and compact face descriptor for driver drowsiness detection. Expert Syst. Appl. 2021, 168, 114334.
- Sri Mounika, T.; Phanindra, P.; Sai Charan, N.; Kranthi Kumar Reddy, Y.; Govindu, S. Driver Drowsiness Detection Using Eye Aspect Ratio (EAR), Mouth Aspect Ratio (MAR), and Driver Distraction Using Head Pose Estimation. In ICT Systems and Sustainability; Springer: Berlin/Heidelberg, Germany, 2022; pp. 619–627.
- Celecia, A.; Figueiredo, K.; Vellasco, M.; González, R. A portable fuzzy driver drowsiness estimation system. Sensors 2020, 20, 4093.
- Popieul, J.C.; Simon, P.; Loslever, P. Using driver’s head movements evolution as a drowsiness indicator. In Proceedings of the IEEE IV2003 Intelligent Vehicles Symposium. Proceedings (Cat. No. 03TH8683), Columbus, OH, USA, 9–11 June 2003; pp. 616–621.
- Coetzer, R.; Hancke, G. Driver fatigue detection: A survey. In Proceedings of the AFRICON 2009, Nairobi, Kenya, 23–25 September 2009; pp. 1–6.
- Liu, W.; Qian, J.; Yao, Z.; Jiao, X.; Pan, J. Convolutional two-stream network using multi-facial feature fusion for driver fatigue detection. Future Internet 2019, 11, 115.
- Soukupova, T.; Cech, J. Eye blink detection using facial landmarks. In Proceedings of the 21st Computer Vision Winter Workshop, Rimske Toplice, Slovenia, 3–5 February 2016.
- Maior, C.B.S.; das Chagas Moura, M.J.; Santana, J.M.M.; Lins, I.D. Real-time classification for autonomous drowsiness detection using eye aspect ratio. Expert Syst. Appl. 2020, 158, 113505.
- Al Redhaei, A.; Albadawi, Y.; Mohamed, S.; Alnoman, A. Realtime Driver Drowsiness Detection Using Machine Learning. In Proceedings of the 2022 Advances in Science and Engineering Technology International Conferences (ASET), Dubai, United Arab Emirates, 21–24 February 2022; pp. 1–6.
- Rasna, P.; Smithamol, M. SVM-Based Drivers Drowsiness Detection Using Machine Learning and Image Processing Techniques. In Progress in Advanced Computing and Intelligent Engineering; Springer: Berlin/Heidelberg, Germany, 2021; pp. 100–112.
- Saradadevi, M.; Bajaj, P. Driver fatigue detection using mouth and yawning analysis. Int. J. Comput. Sci. Netw. Secur. 2008, 8, 183–188.
- Sahayadhas, A.; Sundaraj, K.; Murugappan, M. Detecting driver drowsiness based on sensors: A review. Sensors 2012, 12, 16937–16953.
- Ngxande, M.; Tapamo, J.R.; Burke, M. Driver drowsiness detection using behavioral measures and machine learning techniques: A review of state-of-art techniques. In Proceedings of the 2017 Pattern Recognition Association of South Africa and Robotics and Mechatronics (PRASA-RobMech), Loemfontein, South Africa, 30 November–1 December 2017; pp. 156–161.
- Dwivedi, K.; Biswaranjan, K.; Sethi, A. Drowsy driver detection using representation learning. In Proceedings of the 2014 IEEE International Advance Computing Conference (IACC), Gurgaon, India, 21–22 February 2014; pp. 995–999.
- Dua, M.; Singla, R.; Raj, S.; Jangra, A.; Shakshi. Deep CNN models-based ensemble approach to driver drowsiness detection. Neural Comput. Appl. 2021, 33, 3155–3168.
- Rosebrock, A. Face Detection with Dlib (Hog and CNN). Available online: https://pyimagesearch.com/2021/04/19/face-detection-with-dlib-hog-and-cnn/ (accessed on 7 May 2022).
- Kartynnik, Y.; Ablavatski, A.; Grishchenko, I.; Grundmann, M. Real-time facial surface geometry from monocular video on mobile GPUs. arXiv 2019, arXiv:1907.06724.
- Datahacker. How to Detect Eye Blinking in Videos Using Dlib and Opencv in Python. Available online: https://datahacker.rs/011-how-to-detect-eye-blinking-in-videos-using-dlib-and-opencv-in-python/ (accessed on 20 May 2022).
- Cech, J.; Soukupova, T. Real-Time Eye Blink Detection Using Facial Landmarks; Center for Machine Perception, Department of Cybernetics. Faculty of Electrical Engineering, Czech Technical University in Prague: Prague, Czech Republic, 2016; pp. 1–8.
- Bhesal, A.D.; Khan, F.A.; Kadam, V.S. Motion based cursor for Phocomelia Users. Int. J. Emerg. Technol. Innov. Res. 2022, 9, 293–297.
More