Your browser does not fully support modern features. Please upgrade for a smoother experience.
Please note this is a comparison between Version 1 by Maurice Ngabire and Version 3 by Wendy Huang.
Meeting current needs without compromising future generations’ ability to meet theirs is the only path toward achieving environmental sustainability. As the most valuable natural resource, soil faces global, regional, and local challenges, from quality degradation to mass losses brought on by salinization. These issues affect agricultural productivity and ecological balance, undermining sustainability and food security. Therefore, timely monitoring and accurate mapping of salinization processes are crucial, especially in semi-arid and arid regions where climate variability impacts have already reached alarming levels. Salt-affected soil mapping has enormous potential thanks to recent progress in remote sensing.
- monitoring
- salinization mapping
- soil
- remote sensing
1. Introduction
Soil salinization is a major environmental hazard affecting agricultural productivity and food security worldwide [1]. It adversely influences soil structure, nutrient availability, and plant growth, leading to reduced crop yields and, in extreme scenarios, desertification [2][3][2,3]. The increasing levels are caused by diverse natural and anthropogenic factors, such as inadequate irrigation practices, fertilizer overuse, and land use changes [4]. In addition, climate change impacts on soil salinization are a significant concern, with weather patterns playing a fundamental role in increasing salt content around the rhizosphere [5][6][5,6]. This is particularly noticeable in areas with shallow water tables and degraded groundwater quality [7]. Therefore, real-time monitoring of soil salinity levels is essential for effective soil management and sustainable agriculture [8][9][8,9].
Subsequently, remote sensing has proven to be an attractive alternative for mapping and monitoring salinization in large-scale and heterogeneous landscapes, especially under different land use, land cover types, and areas where socio-culturally different farming cultivation techniques are maintained [10][11][10,11]. Remote sensing data from satellite imagery and aerial photography offer valuable information on various environmental parameters, including vegetation cover, soil composition, and moisture content, which are interconnected to salt content [12]. By analyzing and interpreting such data, researchers, and practitioners can generate detailed maps and spatial models of salinity distribution, which inform land management decisions and support the development of effective strategies for risk mitigation [13][14][13,14]. Over the past few decades, remote sensing has undergone significant advancements, enabling the collection of high-resolution data on various scales [15][16][15,16]. As research progresses, various tools have emerged [17][18][19][17,18,19], including multispectral imaging sensors which capture information at different wavelengths, leading to more accurate results with higher spatial resolution [20]. This enables the extraction of auxiliary data on soil properties such as moisture content, organic matter, and salt content by analyzing the reflected radiation from the surface [21]. To map soil salinization, many researchers have used the concept of spectral index, a combination of pixel values from two or more spectral bands [22][23][24][22,23,24]. As they rely on the variance in reflectance between the visible (VIS), near-infrared (NIR), and shortwave infrared (SWIR) bands, they can be useful in detecting changes in salt content [25].
In addition to multispectral imaging, synthetic aperture radar (SAR) has recently become one of the most efficient remote sensing tools for soil salinity detection due to its insensitivity to weather conditions, unlike optical remote sensing [26]. SAR uses microwave signals to penetrate the soil and retrieve information on soil moisture [27] and structure [28]. Therefore, it can generate relevant information on soil’s electrical conductivity (EC), which is closely related to its salt content [29][30][29,30]. The backscatter coefficient (sigma-0), as a measure of the microwave energy reflected back to the sensor, is a commonly used parameter for mapping soil salinity by integrating it into empirical models [31].
The accuracy of salinity mapping has been significantly improved by the fusion of multiple data sources, such as optical and SAR data [32]. As optical sensors can capture surface reflectance and vegetation cover, SAR sensors penetrate the vegetation and retrieve information on soil properties [33]. Moreover, integrating remote sensing data with other data types, such as those on land cover, land use, and topographic features, provides even more accurate estimations [4][34][4,34]. By combining data from different sensors and platforms, researchers can take advantage of the complementary strengths of each data source and overcome their limitations.
As the field of salinization mapping continues to progress, it has become increasingly evident that integrating remote sensing data with machine learning offers a more robust framework for effectively processing large datasets and generating more accurate products [35]. Machine learning algorithms, such as random forest [36] and support vector machines [37], have been remarkably efficient at data processing and analysis, enabling prediction models to learn from the spectral and spatial patterns and produce estimations based on input features [38][39][38,39].
2. Remote Sensing for Mapping Soil Salinization
Not only do environmental factors, such as soil type, land use, topography, and climate, play a leading role in salinization expansion, but anthropogenic actions, such as the inadequacy of drainage systems and ineffective irrigation activities over an extended period, also have a direct impact on this dynamic process [4][40][41][4,40,41]. In light of this, the availability of spaceborne and airborne platforms has significantly facilitated the monitoring of environmental hazards by providing vast amounts of data that can be applied to diverse fields, from sustainable agriculture, land surveys, and climate change to risk mitigation [42]. Enhanced data in terms of spatiotemporal and spectral resolutions offered by these systems have enabled researchers to monitor changes inland and identify salinity patterns at various spatial scales. In addition, when combined with geospatial data, ground-based systems such as the electromagnetic induction instrument (EMI) give valuable insights into the salinization status at both local and canopy scales, allowing policy-makers to gain a more comprehensive understanding of the complex dynamics of salinization at the field level [43]. Integrating remote sensing data with robust analytical techniques has shown great promise in salinization mapping, as suggested by many researchers. A study conducted in Qom Valley in Iraq demonstrated that combining Landsat 8 OLI’s spectral indices and topographic features can accurately predict and map soil salinity [44]. Further, jointly using Sentinel-2 Multispectral Imager (MSI) data with laboratory measurements to build a machine learning model for soil salinity estimation in the northern margin of the Tarim Basin (China) provided a timeless scientific reference for futuristic scenarios related to salinization expansion in arid areas [45]. Field observations, Landsat 5 TM, and radar data retrieved from ALOS (Advanced Land Observing Satellite) and PALSAR (Phased Array L-Band Synthetic Aperture Radar) have provided a promising solution for salinity monitoring in central Iraq with lower costs, as suggested by the authors of [46]. In the Great Hungarian Plain, the authors of [47] employed spectral indices and principal components derived from Landsat 8 OLI data coupled with multiple linear regression analysis to map salt content distribution in the area. The study proved the potential of multispectral data, with the outperformance of ridge regression yielding an overall accuracy of 75%. Thus, linear regression modeling using remote sensing-based variables can be significantly effective for locally assessing soil salinity. As pattern changes in land use and land cover supposedly vary with salinization magnitude, relevant data can be effectively employed to predict soil salinity levels [48][49][48,49]. In Europe, among several land cover inventories, the CORINE system has solely provided this information for over two decades, which fortunately could be used to map salinization by many researchers [4][50][51][4,50,51]. In addition, a study conducted in Dakhla Oasis, located in the western desert of Egypt, showed a discrepancy in soil salinity estimations based on the linear spectral unmixing (LSU) related to land surface temperature over different land cover types and altitudes [52]. These findings are consistent with another study conducted in Korat province (Thailand), emphasizing the importance of vegetation cover, soil characteristics, and seasonal fluctuations in mapping soil salinization via remote sensing [53]. Over the past decade, research focus has shifted from traditional, labor-intensive methods of measuring salt content through field surveys and laboratory analysis towards a greater reliance on remotely sensed data often used with limited reference datasets for calibration purposes [54]. Based on a qualitative analysis of the Scopus database, rwesearchers have run an advanced search query to find available peer-reviewed research papers with the following terms: soil salinization, monitoring, and remote sensing. Significant progress was made in spaceborne and airborne remote sensing systems between 2014 and 2023, which was fundamentally driven by the launch of Landsat 8 in 2013 and the subsequent launches of Sentinel 1 and Sentinel 2 in 2014 and 2015. Figure 1 demonstrates a positive trend in research studies that employed remote sensing for salinization assessment in the same timeframe. However, the sudden drop in 2021 is attributed to a shift in research focus toward other areas or technologies, funding limitations, and reference data unavailability due to the geographic inaccessibility caused by extreme global events such as COVID-19. Given the rise in technology availability and professional knowledge worldwide, this increasing trend is expected to continue in 2023.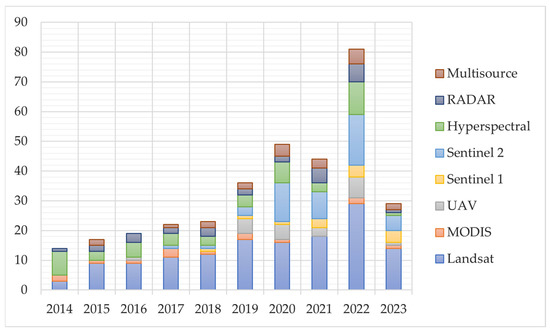
Figure 1. Progress of remote sensing application in salinization mapping based on available studies in Scopus between 2014 and 2023. The yearly number of studies using various sensors has significantly increased from 14 in 2014 to 81 in 2022. The availability of satellite data and the development of sophisticated instruments with higher spectral and spatial resolutions have contributed to this growth.