1. Satellite Systems
Spaceborne systems use satellites in space to provide telecommunication services. They cover a very large area and provide a secure connection that is not affected by physical and weather obstacles compared to terrestrial systems. They are employed for many applications such as tracking the position of ships, sending and receiving data, collecting data about the earth’s surface, monitoring, and analyzing a variety of environmental changes.
Recently, satellite systems were adopted as a solution for detecting, monitoring, and mapping wildland fires, as well as in firefighting on the earth’s surface in near-real-time. They use thermal, optical, vision, and radar sensors to produce accurate information such as temperature, humidity, vegetation, atmospheric conditions, meteorological data, topographic data, historical fires, and human activities by providing information on the location and intensity of fires. Optical sensors can detect changes in vegetation and land cover that may indicate the presence of smoke and fire. Thermal sensors can detect heat information associated with smoke and flames and provide information on the temperature and intensity of fires. Radar sensors transmit and receive signals to see through smoke, darkness, and clouds to generate high-resolution images of the land surface, even under nighttime conditions. These data are then processed using mathematical models or artificial intelligence techniques such as ML and DL models, to detect and monitor potential wildland fire activities. In addition, the information obtained from satellite remote sensing systems can be employed to: (1) Support evacuation efforts by providing real-time information about the extent and location of a wildfire, which can be used to ensure the safety of nearby human populations. (2) Predict wildfire behaviors by estimating and tracking fire spread rates. This information helps to allocate firefighting resources and to develop efficient firefighting strategies. (3) Identify fire perimeters by detecting the boundaries of a wildfire. This information can be used to generate wildfire maps and to provide firefighting operations with better situational awareness. (4) Assess the impact of wildfires by determining the damage caused by a wildfire and estimating the severity of burned areas. This information can be used to plan post-fire recovery efforts and to protect ecosystems. Based on their orbit, these systems can be divided into three categories: geostationary orbit (GEO), low-earth orbit (LEO), and polar sun-synchronous orbit (SSO).
-
Geostationary orbit (GEO) circles the earth above the equator of the earth following the rotation of the earth. It orbits the earth at an altitude of 35,786 km. The satellite in GEO appears to be stationary above a fixed point on the earth’s surface, thus providing continuous coverage to the same area. Many satellites are used, such as Geostationary Operational Environmental Satellites (GOES) [
24], Landsat [
25], and Sentinel [
26]. They have a high temporal resolution. GOES offers a high spatial, temporal, and spectral resolution. It provides accurate weather information and real-time weather monitoring. However, some of them have a low spatial resolution and long revisit times, for example, eight days for LandSat-8, and 2 to 3 days for Sentinel-2B. GEO systems allow for the detection of the size, intensity, and locations of wildfires. They provide information on the wind direction and speed, which can help in estimating the spread of wildfires and in firefighting operations.
-
Low-earth orbit (LEO) is an orbit centered on the earth having an altitude of less than or equal to 2000 km. Its orbital period is less than one day. It is more suitable for observation and communication as it is closer to the earth. It provides high-resolution imagery, low communication latency, and high bandwidth. However, LEO satellites have a limited lifetime due to their low altitude. LEO systems can be used to detect wildland fires, as well as their locations and behaviors, which helps firefighting operators provide accurate strategies for wildfire prevention.
-
Polar sun-synchronous orbit (SSO) is an orbit around the earth in which the ground track of the satellite follows the sun. It has the same position at all times, with an altitude of between 200 and 1000 km, which allows for a continuous coverage of a precise zone at the same time and place every day. Numerous satellites are used, such as MODIS (Moderate Resolution Imaging Spectroradiometer) [
27], AVHRR (Advanced Very-High-Resolution Radiometer) [
28], and VIIRS (Visible Infrared Imaging Radiometer Suite) [
29]. SSO satellites are used for monitoring the climate and for forecasting the weather. They are also capable of detecting and monitoring wildland fires, providing the size, location, and intensity of wildfires, as well as their spread based on weather information. However, their lifetime is very limited due to their low altitude .
2. Deep Learning-Based Approaches for Fire Detection Using Satellite Data
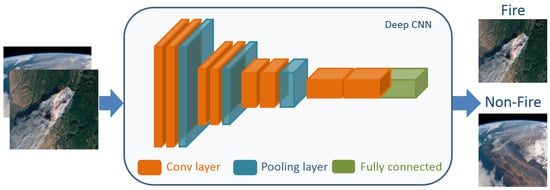
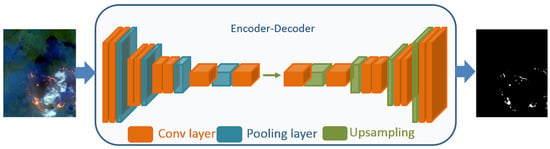
To detect and monitor fires on remote sensing satellite images, DL-based fire segmentation and detection methods have been developed in recent years. Both methods have shown an interesting result compared to traditional ML methods. In addition, they are very useful for efficient fire management. Fire detection focuses on identifying the presence of fire (smoke, flame, or both) and classifying it (see Figure 1), while fire segmentation is the process of grouping similar pixels of smoke or flame in an input satellite image based on their characteristics such as color, shape, and texture, and outputting the result as a mask (see Figure 2).
Figure 1. Fire detection based on DL model.
Figure 2. Fire segmentation based on DL model.
DL models were used to analyze smoke ignition and to automatically detect the presence of fires. They are capable of recognizing patterns in satellite imagery data corresponding to smoke plumes and fires, and of using this information to identify fire instances as they appear. Numerous DL models were proposed to detect and segment fires using satellite data. CNN (Convolutional Neural Network) is a popular approach used to detect smoke by analyzing satellite images. CNNs are designed to identify patterns in visual data, and to recognize smoke plumes and other fire-related features. Kang et al. [
30] developed a CNN, which consists of three 3 × 3 convolutional layers, each followed by a ReLU activation function and max pooling layer, and two fully connected layers to detect forest fires on geostationary satellite data. Using 2157 Himawari-8 images with 93,270 samples without fire and 7795 samples with fire, the proposed CNN showed superior performance, achieving an F1-score of 74% compared to the random forest method. Azami et al. [
31] evaluated the CNN models (MiniVGGNet, ShallowNet, and LeNet) in detecting and recognizing wildfires on images collected by the KITSUNE CubeSat. Using 715 forest fire images, MiniVGGNet, ShallowNet, and LeNet achieved an accuracy of 98%, 95%, and 97%, respectively. Kalaivani and Chanthiya [
32] proposed a custom optimized CNN which integrated an ALO (Antlion Optimization) method inside a PReLU activation function to detect forest fires. An accuracy of 60.87% was achieved using Landsat satellite images. Seydi et al. [
33] presented a deep learning-based active forest fire detection method called Fire-Net, which consists of residual, point/depth-wise convolutional, and multiscale convolutional blocks. Fire-Net was trained using 578 Landsat-8 images, and tested on 144 images of the Australian forest, Central African forest, Brazilian forest, and Chernobyl areas, achieving F1-scores of 97.57%, 80.52%, 97.00%, and 97.24%, respectively. Palacio and Ian [
34] used two pretrained deep learning models, MobileNet v2 [
35] and ResNet v2 [
36], on the ImageNet dataset [
37] to predict wildfire smoke through satellite imagery of the California regions. Using fire perimeters, fire information (date, area, longitude, and altitude), and a historical fire map collected from Landsat 7 and 8, and MobileNet v2 obtained the best accuracy of 73.3%. Zhao et al. [
38] investigated the impact of using the IR (infrared) band in detecting smoke. They proposed a lightweight CNN, called VIB_SD (Variant Input Bands for Smoke Detection), which integrates the inception structure, attention method, and residual learning. VIB_SD was trained using 1836 multispectral based on Landsat 8 OLI and Landsat 5 TM imagery data, and divided into three classes, (“Clear”, “Smoke”, and “Other_aerosol”), with horizontal/vertical flip as the data augmentation methods. The experimental results showed that adding an NIR band improved the performance by 5.96% compared to only using an RGB band (an accuracy of 86.45%). Wang et al. [
39] proposed a novel smoke detection method named DC-CMEDA (Deep Convolution and Correlated Manifold Embedded Distribution Alignment), consisting of deep CNN (ResNet-50) and CMEDA as an improved MEDA (Manifold Embedded Distribution Alignment). First, ResNet-50 extracted the smoke features of the target and source domains (satellite and video images) data. Then, CMEDA was employed to reduce the bias in the source domain and make it more similar to the target domain, Finally, the presence or absence of smoke was generated as the output. A total of 200 satellite images and 200 RGB images were utilized in DC-CMEDA training, each including 100 smoke and 100 non-smoke images. In transferring from satellite images to video images, DC-CMEDA achieved an accuracy of 93.0%, overcoming the state-of-the-art methods, Filonenko’s method [
40], and DC-ILSTM [
41], by 2.5% and 1.5%, respectively. In transferring from video images to satellite images, DC-CMEDA also reached a high accuracy of 89.5%, surpassing Filonenko’s method and DC-ILSTM by 6.5% and 4.0%, respectively. Higa et al. [
42] explored object detection methods such as PAA [
43], VFNET [
44], ATSS [
45], SABL [
46], RetinaNet [
47], and Faster R-CNN [
48] to detect and locate active fires and smoke in the Brazilian Pantanal regions. Using 775 images downloaded from the CBERS (China-Brazil Earth Resources Satellite) 04A WFI dataset [
49], VFNET achieved the highest F1-score of 81%. Ba et al. [
50] proposed a smoke detection method based on CNN and SmokeNet, using MODIS data. They presented a new dataset, called USTC_SmokeRS [
51], comprising 6255 satellite images of smoke and various classes very close to smoke, such as haze, clouds, fog, etc. SmokeNet is a modified AttentionNet method that merges spatial and channel-based attention with residual blocks. It achieved an accuracy of 92.75%, outperforming VGG [
52], ResNet [
36], DenseNet [
53], AttentionNet [
54], and SE-ResNet [
55]. Phan et al. [
56] proposed a 3D CNN model to locate wildfires using satellite images collected from the GOE satellite, GOES-16. They integrated spatial and spectral information at the same time. The 3D CNN contains three 3D convolutional layers, followed by the ReLU activation function and batch normalization, fully connected layer, and softmax function. Imagery data and weather information were used as inputs to detect the presence of forest fires. Using 384 satellite images, an F1-score of 94% was achieved, outperforming baseline models such as MODIS-Terra [
5], AVHRR-FIMMA [
57], VIIRS-AFP [
58], and GOES-AFP [
59]. Hong et al. [
60] designed a new CNN, FireCNN, to detect fires in Himawari-8 satellite images. FireCNN consists of three convolutional blocks and a fully connected layer. Each convolutional block consists of two convolutional layers, each followed by a ReLU activation and a max pooling layer. FireCNN was tested on a dataset containing 3646 non-fire spots and 1823 fire spots [
61], obtaining an accuracy of 99.9% higher than the traditional ML methods (thresholding, SVM (Support Vector Machine), and random forest). Wang et al. [
62] employed Swin transformer [
63], which adopts attention mechanism to model local and global dependencies in detecting smoke and flame. A set of 5773 images obtained from FASDD (Flame and Smoke Detection Dataset) [
64] were used in training this model, obtaining a mAP (mean Average Precision) of 53.01%.
FCN (Fully Convolutional Network) and the encoder–decoder model are the widely used types of CNNs in image segmentation tasks. FCN is the first CNN developed for pixel-level classification. It employs a series of convolutional and pooling layers to extract features from the input image, and then generates a binary mask as the output. Larsen et al. [
65] proposed an FCN to predict smoke in satellite images acquired by Himawari-8 and the NOAA (National Oceanic and Atmospheric Administration) Visible Infrared Imaging Radiometer Suite in near-real-time [
66]. FCN consists of four convolution layers, three max pooling layers, three transposed convolution layers, batch normalization, and ReLU activation functions. It was trained on 975 satellite images, attaining an accuracy of 99.5%. The encoder–decoder architecture contains two parts (encoder and decoder). The encoder performs convolutional and pooling layers to extract high- and low-level features, while the decoder employs transposed convolutions, which are designed to upsample the compressed feature map to produce a segmentation mask as output. U-Net [
67] is the popular encoder–decoder architecture used for image segmentation. It also employs skip connections to combine the features from the encoder and the decoder to better capture finer details and to produce a more accurate result.
3. Deep Learning-Based Approaches for Fire Mapping Using Satellite Data
Similarly to fire detection, fire mapping can provide maps to visualize the intensity and location of detected wildland fires. It is the process of generating maps, and showing the locations and extents of wildland fires. These maps were utilized for a wide variety of purposes, such as fire damage reporting, firefighting and evacuation efforts planning, and wildland fire management. Many DL approaches were adopted for the fire mapping task.
Belenguer-Plomer et al. [
88] investigated CNN performance using Sentinel-1 and/or Sentinel-2 data, which were downloaded from the Copernicus Open Access Hub in detecting and mapping burned areas. The proposed CNN comprises two convolutional layers, each one followed by the ReLU activation function, max pooling layer, two fully connected layers, and the sigmoid function to predict the probabilities of burned or unburned areas. It reached a Dice coefficient of 57% and 70% using Sentinel-1 and Sentinel-2 data, respectively. Abid et al. [
89] developed an unsupervised deep learning model to map the burnt forest zones on Sentinel-2 imagery data of Australia. First, a pretrained VGG16 was used to extract features of input data Then, K-means clustering and thresholding methods were used to perform the clustering of input data, which has similar features. This method achieved an F1-score of 87% using the real-time data of Sentinel-2 as the learning data. Hu et al. [
90] explored numerous semantic segmentation networks such as U-Net, Fast-SCNN [
91], DeepLab v3+ [
86], and HRNet [
92] in mapping burned areas using multispectral images of the boreal forests in Sweden and Canada, and the Mediterranean regions (Portugal, Spain, and Greece). Sentinel-2 and Landsat-8 images and data augmentation methods (resizing, mirroring, rotation, aspect, cropping, and color jitter) were used in training these DL models. The testing results demonstrated that DL-based semantic segmentation models showed higher performances compared to ML methods (LightGBM, KNN, and random forest) and thresholding methods, NBR (Normalized Burnt Ratio). and dNBR (delta NBR). As an example, with Sentinel-2 images, U-Net achieved the best Kappa coefficient of 90% in a Mediterranean fire site in Greece, and Fast-SCNN performed better, with a kappa coefficient of 82% in a boreal forest fire in Sweden. With Landsat-8 images, HRNet reached the best Kappa coefficient of 78% in a Sweden forest fire. Cho et al. [
93] also employed U-Net as a semantic segmentation method to map burned areas. They used learning data, including satellite images with a resolution of 3 m per pixel collected from the PlanetScope dataset [
94], and their ground truth masks, the dissimilarity obtained from GLCM (Gray-Level Co-occurrence Matrix), NDVI (Normalized Difference Vegetation Index), and land cover map data, as well as the topographic normalization of each image to reduce the effect of shadow, and a data augmentation technique (rotation, mirroring, and horizontal/vertical flip) to train U-Net, achieving F1-scores of 93.0%, 93.8%, and 91.8% in the Andong, Samcheok, and Goseong study areas, respectively. Brunt and Manandhar [
95] also used U-Net to map burned areas in Sentinel-2 images of Indonesia and Central African regions. U-Net obtained an F1-score of 82%, 91%, and 92% using the Indonesia test data, the Central Africa test data, and the test data of both regions, respectively. Seydi et al. [
96] developed a DL method, Burnt-Net, to map burned areas from post-fire Sentinel-2 images. Burnt-Net is an encoder–decoder architecture, including convolutional layers, ReLU functions, max pooling layers, batch normalization layers, residual multi-scale blocks, morphological operators (dilation and erosion), and transposed convolutional layers. Burnt-Net was trained with Sentinel-2 images of wildland fires in Spain, France, and Greece, France, and tested using wildland fires located in Portugal, Turkey, Cyprus, and Greece, obtaining an accuracy of 98.08%, 97.38%, 95.68%, and 95.51%, respectively, superior to the accuracy of U-Net and the Landsat burned area product. Prabowo et al. [
97] also employed U-Net to map burned areas. They collected a new dataset comprising 227 satellite images with a resolution of 512 × 512 pix. acquired by the Landsat-8 satellite in Indonesian regions, and their corresponding binary masks. Using a data augmentation method (rotation), U-Net obtained a Jaccard index of 93%. U-Net was also evaluated in Colomba et al. [
98] to map burned areas. It was trained and evaluated with 73 images downloaded from the satellite burned area dataset [
98,
99] and data augmentation techniques (rotation, shear, and vertical/horizontal flip), obtaining an accuracy of 94.3%. Zhang et al. [
100] performed deep residual U-Net, which adopts the ResNet model as a feature extractor to map wildfires using the Sentinel-2 MSI time series and Sentinel-1 SAR data. Deep residual U-Net reached an F1-score of 78.07% and 84.23% on the Chuckegg Creek fire data acquired in 2019, and on the Sydney fire data collected between 2019 and 2020, respectively. Pinto et al. [
101] proposed a deep learning approach, BA-Net (Burned Areas Neural Network), based on daily sequences of multi-spectral images to identify and map burned areas. BA-Net is an encoder–decoder with five connections between the encoder and decoder. The encoder comprises ST-Conv3 modules and spatial convolution. Each ST-Conv3 consists of two 3D convolution layers, followed by batch normalization with a ReLU activation function and a 3D dropout layer. The decoder contains UpST-Conv3 modules and 3D transposed convolutions. Each UpST-Conv3 module includes two 3D transposed convolution layers, followed by batch normalization with the ReLU activation function and a 3D dropout layer. Several datasets covering five regions (California, Brazil, Mozambique, Portugal, and Australia) were used to train and test this approach: VIIRS Level 1B data [
102], VIIRS Active Fires data [
58], MCD64A1C6 [
103], FireCCI51 [
104], Landsat-8 53 scenes [
105], the FireCCISFD11 dataset [
106], the MTBS dataset [
107], TERN AusCover data [
108], and ICNF Burned Areas [
109]. BA-Net showed an excellent result (a Dice coefficient of 92%) in dating and mapping burned areas, outperforming the FireCCI51 simulators, thus confirming its ability in determining the spatiotemporal relations of active fires and the daily surface reflectances. Seydi et al. [
110] presented a new method, DSMNN-Net (Deep Siamese Morphological Neural Network) to map burned areas using PRISMA (PRecursore IperSpettrale della Missione Applicativa) and Sentinel-2 multispectral images of the Australian continent. Two deep feature extractors, which adopt 3D/2D convolutional layers and a morphological layer based on dilation and erosion, were employed to extract features from the pre-fire and post-fire datasets. Two scenarios were investigated: in the first scenario, pre- and post-fire datasets collected from Sentinel-2; and in the second scenario, pre-fire datasets downloaded from Sentinel-2 and post-fire datasets obtained from PRISMA. The numerical results showed that DSMNN-Net achieved an accuracy of 90.24% and 97.46% in the first and second scenarios, respectively, outperforming existing state-of-the-art methods such as CNN proposed by Belenguer-Plomer et al. [
88], random forest [
111,
112], and SVM [
113] .
4. Deep Learning-Based Approaches for Fire Susceptibility Using Satellite Data
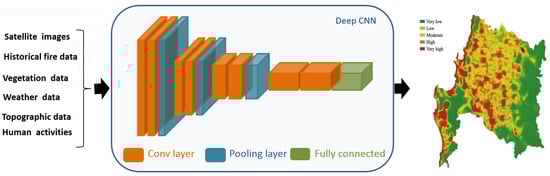
Deep learning models were applied to estimate fire severity and susceptibility using vegetation data, meteorological data, topographic data, historical fires, and human activities by providing information on the locations and intensities of fires, as shown in Figure 3. The severity level refers to the degree of vegetation damage caused by the wildland fire, and can be classified as very low, low, moderate, high, or very high, according to the severity of the damage.
Figure 3. Fire severity damage prediction based on DL model.
Zhang et al. [
114] proposed a spatial prediction model based on CNN for wildfire susceptibility modeling in China (Yunnan province). This CNN includes three convolutional layers, a ReLU activation function, two pooling layers, and three fully connected layers. The authors used numerous data, including the interpretation of satellite images and historical fire reports from 2002 to 2010 (7675 fires occurred) to generate a wildfire event map as the output. They also used fourteen fire influencing factors, divided into three categories: vegetation-related (distance to road, distance to rivers, NDVI, and forest coverage ratio), climate-related (average temperature, specific humidity, average precipitation, average wind speed, precipitation rate, and maximum temperature) [
115], and topography-related (aspect, slope, and elevation) [
116]. A higher accuracy of 95.81% was achieved, outperforming four benchmark models that are multilayer perceptron neural networks, random forests, kernel logistic regression, and SVM. Prapas et al. [
117] proposed a DL method, named ConvLSTM, for forest fire danger forecasting in the regions of Greece. The Datacube dataset [
118] was used in training and testing this model. It contains burned areas and fire information (climate data, human activity, and vegetation information) between 2009 and 2020, daily weather data, satellite data collected from MODIS (LAI (Leaf Area Index), Fpar (Fraction of Photosynthetically Active Radiation), NDVI, EVI (Enhanced Vegetation Index), day/night LST (Land Surface Temperature), road density, land cover information, and topography data (aspect, slope, and elevation). ConvLSTM reached a precision of 83.2% better than random forest and LSTM (Long Short-Term Memory). Zhang et al. [
119] studied the ability of CNN in predicting forest fire susceptibility maps divided into five levels (very high, high, moderate, low, and very low). Based on the processing cell type (grid and pixel), they proposed two CNNs, CNN-1D based on pixel cells and CNN-2D based on grid cells. CNN-1D consists of two 1D convolutional layers, three fully connected layers, ReLU activation functions, and a sigmoid function. CNN-2D contains two 2D convolutional layers, each one followed by ReLU activation and the max pooling layer, and three fully connected layers, the first two of which are followed by the ReLU activation function, and the last by a sigmoid function. Various data were employed in learning CNN: daily dynamic fire behaviors, individual fire characteristics, and estimated day of burn information, collected from the GFA (Global Fire Atlas) product from 2003 to 2016; metrology data obtained from the GLDAS (NASA Global Land Data Assimilation System), including average temperature, specific humidity, accumulated precipitation, soil moisture, soil temperature, and standardized precipitation index; vegetation data (LAI and NDVI) downloaded from the USGS (United States Geological Survey) website. Testing results showed that CNN-2D achieved accuracies of 91.08%, 89.61%, 93.18%, and 94.88% for four seasons (March–May, June–August, September–November, and December–February, respectively), surpassing the accuracies of CNN-1D and multilayer perceptron models. Le et al. [
120] developed deep neural computing, Deep-NC, which includes three ReLU activation functions and a sigmoid function to predict wildfire danger in Gia Lai province in Vietnam. In total, there were 2530 historical fire locations from 2007 to 2016; 2530 non-forest fire data points, slope, land use, NDWI (Normalized Difference Water Index), aspect, elevation, NDMI (Normalized Difference Moisture Index), curvature, NDVI, speed of the wind, relative humidity, temperature, and rainfall information were assessed to remove noise and were used as input [
121]. In the training step, four optimizers that are SGD (Stochastic Gradient Descent), Adam (Adaptive Moment Estimation), RMSProp (Root Mean Square Propagation), and Adadelta were employed to optimize Deep-NC’s weights. Deep-NC with Adam optimizer reached an accuracy of 81.50%. Omar et al. [
122] employed a DL method, which consists of LSTM, fully connected layers, dropout, and a regression function in predicting forest fires. In total, 536 instances and twelve features, including temperature, relative humidity, rain, wind, ISI (Initial Spread Index), DMC (Duff Moisture Code), FWI (Forest Fire Weather Index), FFMC (Fine Fuel Moisture Code), and BUI (Buildup Index) were used to train the proposed model, obtaining an RMSE (Root Mean Squared Error) score of 0.021, and surpassing machine learning methods (decision tree, linear regression, SVM, and a neural network). Zhang et al. [
123] developed a hybrid deep neural network (CNN2D-LSTM) to predict the global burned areas of wildfires based on satellite burned area products and historical time series predictors. CNN2D-LSTM includes two convolutional layers, three fully connected layers, ReLU functions, two max pooling layers, and two LSTM layers. A good RMSE of 4.74 was obtained using monthly burned area data between 1997 and 2016, collected from the GFED dataset, and temporally dynamic predictors (monthly maximum/minimum temperatures, average temperature, specific humidity, accumulated precipitation, soil moisture, soil temperature, standardized precipitation index, LAI, and NDVI), which affect forest fires. Shoa et al. [
124] proposed a DL model, which includes linear layers, batch normalization layers, and LeakyReLU activation functions to predict the occurrence of wildfires in China. To train the proposed model, they used historical fire data (96,594 wildfire points collected on MODIS from 2001 to 2019) in China’s regions, climatic data (daily maximum temperature, average temperature, daily average ground surface temperature, average air pressure, maximum wind speed, sunshine hours, daily average relative humidity, and average wind speed), vegetation data (fractional vegetation cover), topographic data (slope, aspect, and elevation), and human activities (population, gross domestic product, special holiday, residential area, and road). The testing results showed that the proposed DL model reached an accuracy of 87.4%. Shams-Eddin et al. [
125] proposed the 2D/3D CNN method to predict wildfire danger. The 2D CNN method was used to generate static inputs such as a digital elevation model, slope, distance to roads, population density, distance to waterways, etc., while 3D CNN generated dynamic inputs, including temperature, day/night land surface temperature, soil moisture index, relative humidity, wind speed, 2 m temperature, NDVI, surface pressure, 2 m dewpoint temperature, and total precipitation. Two LOADE (Location-Aware Adaptive Denormalization) blocks were also integrated into the 3D CNN to modulate dynamic features based on static features. Using FireCube [
126] and NDWS (Next Day Wildfire Spread) [
79] datasets, 2D/3D CNN showed a high performance (an accuracy of 96.48%), better than the baseline methods such as random forest, XGBoost, LSTM, and convLSTM. Jamshed et al. [
127] adopted the LSTM method to predict the occurrence of wildland fires from 2022 to 2025. Historical wildfire data and burned data from Pakistan during 2012 and 2021 were used as training data and provided an accuracy of 95%. Naderpour et al. [
128] designed a spatial method for wildfire risk assessment in the Northern Beaches region of Sydney. This method consists of two steps. In the first step, twelve influential wildfire factors (NDVI, slope, precipitation, temperature, land use, elevation, road density, distance to river, distance to road, wind speed, humidity, and annual temperature) [
129,
130] were fed into a deep NN (Neural Network) as a susceptibility model, which included more than three hidden layers to determine the weight of each factor, and then an FbSP (supervised fuzzy logic approach) method was used to optimize the results generated by deep NN. In the second step, the AHP (hierarchical analytical process) method was adopted as the vulnerability model to generate the physical and social vulnerability index using social and physical parameters such as population density, age, employment rate, housing, land use, high density, high value, etc. [
131,
132]. Finally, a risk function was used to calculate the wildfire risk map, giving the inventory of fire events (very low, low, medium, high, and very high). The proposed method obtained a Kappa coefficient of 94.3%. Nur et al. [
133] proposed the hybrid models CNN-ICA and CNN-GWO, which include a CNN and a metaheuristic method (ICA: Imperialist Competitive Algorithms [
134] and GWO: Grey Wolf Optimization [
135]) to assess wildland fire susceptibility divided into five classes (very low, low, moderate, high, and very high). First, the DPM (Damage Proxy Map) method was adopted to identify burned forest areas on Sentinel-1 SAR (Synthetic Aperture Radar) images from 2016 to 2020 in the Plumas National Forest regions, and to generate an inventory dataset. Then, the inventory data and 16 wildfire conditioning factors, including topography factors (aspect, altitude, slope, and plan curvature), meteorological factors (precipitation, maximum temperature, solar radiance, and wind speed), environmental factors (distance to stream, drought index, soil moisture, NDVI, and TWI (Topographic Wetness Index)), and anthropological factors (land use, distance use, and distance to settlement) were used to train and test this model. Finally, the CNN hyperparameters were optimized using the ICA and GWO methods, and forest fire likelihoods were produced. The obtained result revealed that the CNN-ICA performance (an RMSE of 0.351) is better than the CNN-GWO result (an RMSE of 0.334). Bjånes et al. [
136] designed an ensemble learning model based on two CNN architectures, namely CNN-1 and multi-input CNN, to predict forest fire susceptibility classes, which are split into five classes (very low, low, moderate, high, and very high) using satellite data from the Biobio and Nuble regions. CNN-1 is a modified Zhang’s CNN [
114] by adding batch normalization in the first convolutional layer and dropout in the fully connected layers. Multi-input CNN is a simple CNN proposed by San et al. for flower grading [
136]. A large data was used as learning data, consisting of fifteen fire influencing factors and fire history data from 2013 to 2019 (including 18,734 fires). The fire influencing factors were grouped into four categories: climatic data collected from the TerraClimate dataset [
137] (minimum/maximum temperature, precipitation, wind speed, climatic water deficit, and actual evapotranspiration), anthropogenic data (distance to urban zones and distance to roads), vegetation data (NDVI, distance to rivers, and land cover type), and topographic data (aspect, surface roughness, slope, and elevation). This proposed model showed an F1-score of 88.77%, surpassing CNN-1 and multi-input CNN, and traditional methods such as XGBoost and SVM.
Deep learning methods were also employed to map burn severity as a multi-class semantic segmentation task. Huot et al. [
138] studied four deep learning models; convolutional autoencoder, residual U-Net, convolutional autoencoder with convolutional LSTM, and residual U-Net with convolutional LSTM to predict wildfires. To train deep learning models, several datasets were used: historical wildfire data [
139] since 2000 collected from MOD14A1 V6 of daily fire mask composites at 1 km resolution, vegetation data [
140] obtained from the Suomi National Polar-Orbiting Partnership (S-NPP) NASA VIIRS Vegetation Indices (VNP13A1) dataset, and contained vegetation indices since 2012 sampled at 500 m resolution, topography data [
141] obtained from the SRTM (Shuttle Radar Topography Mission) and sampled at 30 m resolution, drought [
142], and weather data (temperature, humidity, and wind) [
143] collected from GRIDMET (Gridded Surface Meteorological) at 4 km resolution since 1979. Residual U-Net achieved the best accuracy of 83%, showing a great ability to detect zones of high fire likelihood. Farasin et al. [
144] proposed a novel supervised learning method, called Double-Step U-Net, to estimate the severity level of affected areas after wildfires through Sentinel-2 satellite data, giving each sub-area of the wildland fire area a numerical severity level of between 0 and 4, where 0, 1, 2, 3, and 4 represent an unburned area, negligible damage, moderate damage, high damage, and areas destroyed by fire, respectively. First, a binary classification U-Net method was employed to identify each sub-area as unburned or burned. Then, a regression U-Net method was applied to determine the severity level only of the burned area. Two sources of information were used, Copernicus EMS (Emergency Management Service), which offers the damage severity maps of five burned regions (Spain, France, Portugal, Sweden, and Italy) affected by past fires used as ground truth maps, and Sentinel-2, which offers satellite imagery. Using data augmentation techniques (horizontal/vertical flip, rotation, and shear), Double-Step U-Net achieved an F1-score of 95% for binary classification U-Net, and a high RMSE for regression U-Net, outperforming the U-Net and dNBR (delta Normalized Burnt Ratio) [
145] methods. Monaco et al. [
146] also studied the ability of Double-Step U-Net with varying loss functions (Binary Cross Entropy (BCE) and Intersection on Union Loss) in generating the damage severity map on manually labeled data collected by Copernicus EMS. The experiment results showed that the Double-Step U-Net with BCE loss achieved the best MSE of 0.54. Monaco et al. [
147] also developed a two-step CNN solution to detect burned areas and predict their damage on satellite data. First, a binary semantic segmentation method-based CNN was used to detect burned areas, and then a regression method-based CNN was applied to predict their damage severity between 0 (no damage) and 4 (completely destroyed). Four semantic segmentation methods (U-Net, U-Net++, SegUNet, and attention U-Net [
148]) were employed as a backbone to extract wildfire features. Using a satellite image collected from Copernicus EMS, DS -UNet, and DS-UNet++ models with BCE loss showed a higher IoU of 75% and 74%, respectively, in delineating the burnt areas compared to DS-AttU and DS-SegU; DS-AttU, DS-UNet, and DS-UNet++ performed better in predicting the damage severity levels of burned areas, obtaining an RMSE of 2.429, 1.857, and 1.857, respectively. Monaco et al. [
149] also used DS-UNet to detect wildfire and to predict the damage severity level, from 0 (no damage) to 5 (completely destroyed) on Sentinel-2 images. DS-UNet achieved an average RMSE of 1.08, overcoming baseline methods such as DS-UNet++, DS-SegU, UNet++, PSPNet, and SegU-Net. Hu et al. [
150] also investigated various deep learning-based multi-class semantic segmentation methods such as U-Net, U
2-Net [
151], UNet++, UNet3+ [
152], attention U-Net, Deeplab v3 [
153], Deeplab v3+, SegNet, PSPNet, etc. in mapping burn severity into five classes that are unburned, low, moderate, high, and non-processing area/cloud. A large-scale dataset, named MTBS (Monitoring Trends in Burn Severity), was developed to learn these models. It includes post-fire and pre-fire top-of-atmosphere Landsat images, dNBR images, perimeter mask, RdNBR (relative dNBR) images, and thematic burn severity from 2010 to 2019 (more than 7000 fires). Five loss functions (Cross-entropy, Focal, Dice, Lovasz softmax, and OHEM loss) and data augmentation techniques (vertical/horizontal flip) were used to evaluate these models. Attention U-Net achieved the best Kappa coefficient of 88.63%. Ding et al. [
154] designed a deep learning method based on U-Net, called WLF-UNet, to identify the wildfire location and intensity (no-fire, low-intensity, and high-intensity) on the Himawari-8 satellite data. More than 5000 images captured by the Himawari-8 satellite between November 2019 and February 2020 in the Australian regions were employed as training data, achieving an accuracy of greater than 80%. Prapas et al. [
155] also applied U-Net++ as a global wildfire forecasting method. Using the seasFire cube dataset [
156], which includes variables related to fire such as historical burned areas and fire emissions between 2001 and 2021, climate, vegetation, oceanic indices, and human related data, U-Net++ reached an F1-score of 50.7%.
5. Deep Learning-Based Approaches for Fire Spread Prediction Using Satellite Data
The fire spread approach estimates fire danger by representing the variable and fixed factors that affect the rate of fire spread, and the difficulty in controlling fires, thereby predicting how fires move and develop over time. Wildfire risk is mainly influenced by various factors such as weather (e.g., wind and temperature), fuel information (e.g., fuel type and fuel moisture), topographic data (e.g., slope, elevation, and aspect), and fire behaviors. Several systems were developed to estimate fire spread, area, behavior, and perimeter; for example, the Canadian FFBP (Forest Fire Behavior Prediction) system [
157]. Throughout the years, numerous research studies have been proposed to predict fire spread. This section reports only the methods based on deep learning. Stankevich [
158] describes the process of an intelligent system to predict wildfire spread, avoiding state-of-the-art challenges such as low forecast performance, computational cost and time, and limited functionality in uncertain and unsteady conditions. Various data were used as inputs: satellite images collected from several sources: fire propagation data obtained from the NASA FIRMS resource management system [
159]; environment data including air temperature, window speed, and humidity; forest vegetation data obtained from the European Space Agency Climate Change Initiative’s global annual Land Cover Map [
160]; and weather data from Ventusky InMeteo [
161]. Four CNNs, which consist of convolutional layers, ReLU activation functions, max pooling layers, and fully connected layers were used. First, a simple CNN was adopted to recognize objects in the forest fire data. Then, three CNNs were employed to estimate the environmental data, air temperature 2 m above the ground, wind speed at a height of 10 m above the ground, and relative air humidity. Finally, an auto-encoder generated the fire forecast. Radke et al. [
162] proposed a novel model, FireCast, which integrates two CNNs to predict fire growth. Each CNN includes convolutional layers, one average pooling layer, three dropout layers, ReLU activation functions, two max pooling layers, and a sigmoid function. Given an initial fire perimeter, atmospheric data, and location characteristics as inputs, FireCast predicts the areas of the current fires that are expected to burn over the next 24 h. It obtained an important result (an accuracy of 87.7%), overcoming Farsite simulator [
163] and the random prediction method using geospatial information such as Landsat8 satellite imagery [
25], elevation data, GeoMAC dataset as fire perimeters data, and atmospheric and weather data collected from NOAA. Bergado et al. [
164] proposed a deep learning method, AllConvNet, which includes convolutional layers, max pooling layers, and downsampling layers to estimate the probabilities of wildland fire burn over the next seven days. A heterogeneous dataset [
165,
166,
167,
168] was used as input, consisting of historical forest fire burn data from the Victoria Australia region during 2006 and 2017, topography data (slope, elevation, and aspect), weather data (rainfall, humidity, wind direction, wind speed, temperature, solar radiation, and lighting flash density), proximity to anthropogenic interface (distance to the power line and distance to roads), and fuel information (fuel moisture, fuel type, and emissivity). The experimental study reported that AllConvNet reached an accuracy of 58.23% better than baseline methods such as SegNet (56.03%), logistic regression (51.54%), and multilayer perceptron (50.48%). Hodges et al. [
169] developed a DCIGN (Deep Convolutional Inverse Graphics Network) to determine the spread of wildland fire and to predict the burned zone up to 24 h. DCIGN consists of two convolutional layers, ReLU activation functions, two max pooling layers, one fully connected layer followed by TanH (hyperbolic tangent) activation functions, and one transpose convolutional layer. Various data are used as input, such as vegetation information (canopy height, canopy cover, and crown ratio), fuel model, moisture information (100-h moisture, 10-h moisture, 1-h moisture, live woody moisture, and live herbaceous moisture), wind information (north wind and east wind), elevation, and initial burn map. DCIGN was trained to predict homogenous and heterogeneous fire spread using 9000 and 2215 simulations, respectively, achieving an F1-score of 93%. Liang et al. [
170] proposed an ensemble learning model, which includes a BPNN (Backpropagation Neural Network), LSTM, and RNN (Recurrent Neural Network) to predict the scale of forest fire. They used fire data on the Alberta region between 1990 and 2018, obtained from the Canada National Fire Database. They also employed eleven meteorological data (minimum temperature, mean temperature, maximum temperature, cooling degree days, total rain, total precipitation, heating degree days, total snow, speed of maximum wind gust, snow on ground, and direction of maximum wind gust) as input. The testing result showed that this method is suitable for estimating the size of the burned area and the duration of the wildfire, with a high accuracy of 90.9%. Khennou et al. [
171] developed a deep learning model based on U-Net and FU-NetCast to determine the wildfire spread over 24 h, and to predict the newly burned areas. FU-NetCast showed excellent potential in predicting forest fire spread using satellite images, atmospheric data, digital elevation models (DEMs) [
66], fire perimeter data, and climate data (temperature, humidity, wind, pressure, etc.) [
171]. Khennou and Akhloufi [
172] also developed FU-NetCastV2 to predict the next burnt area after a 24-h scale. Using GeoMAC data (400 fire perimeters) from 2013 to 2019, FU-NetCastV2 achieved a high accuracy of 94.60%, outperforming FU-NetCast by 1.87%. Allaire et al. [
173] developed a deep learning model to identify fires and to determine their spread. This model is a deep CNN with two types of inputs that are the remaining scalar inputs and the spatial fields describing the surrounding landscape. It consists of four convolutions layers followed by a batch normalization layer, the ReLU activation function, an average pooling layer, and various dense layers, followed by batch normalization and the ReLU activation function. A MAPE (Mean Absolute Percentage Error) of 32.8% is reached using large training data, which includes a data map of Corsica (land cover field and elevation field) and various environmental data: fuel moisture content (FMC), wind speed, terrain slope, ignition point coordinates, heat of combustion perturbation, particle density perturbation, fuel load perturbations, fuel height perturbations, and surface–volume ratio perturbations, confirming the potential of this method in estimating fire spread in a wide range of environments. McCarthy et al. [
174] illustrated a deep learning model based on U-Net to downscale GEO satellite multispectral imagery, monitor, and estimate fire progress. An excellent performance (a precision of 90%) is obtained, showing the effectiveness of this method in determining fire evolution with high spatiotemporal resolution (375 m) using quasi-static features (terrain, land, and vegetation information) and dynamic features obtained from GEO satellite imagery.