Your browser does not fully support modern features. Please upgrade for a smoother experience.
Please note this is a comparison between Version 1 by Mohamed Shehata and Version 2 by Lindsay Dong.
Globally, renal cancer (RC) is the 10th most common cancer among men and women. The new era of artificial intelligence (AI) and radiomics have allowed the development of AI-based computer-aided diagnostic (AI-based CAD/CAP) systems, which have shown promise for the diagnosis of RC (i.e., subtyping, grading, and staging) and prediction of clinical outcomes at an early stage. This will absolutely help reduce diagnosis time, enhance diagnostic abilities, reduce invasiveness, and provide guidance for appropriate management procedures to avoid the burden of unresponsive treatment plans.
- renal cancer
- artificial intelligence
- computer-aided diagnostic techniques
1. Introduction
Renal cancer (RC) is ranked tenth among all types of cancer in men and women worldwide. The number of renal cancer patients increases dramatically each year. In the USA, around 81,800 new cases of RC are expected to be diagnosed in 2023 [1][2][1,2], with approximately 14,890 patients expected to die [1][2][1,2]. Approximately, 67% of RC patients are diagnosed before developing metastasis and have a 5-year survival chance of 93%. The development of metastatic disease reduces the 5-year survival chance to 72% for local metastases and 15% for distant metastases, which becomes a serious life-threatening problem [1][2][1,2]. In 2022, the National Cancer Institute estimated an expenditure of USD 5.1 billion for RC care in the USA [3].
Renal cancer is a heterogeneous group of tumors which develop from different cell types within the kidney. Renal cell carcinoma (RCC) is considered the most common and aggressive type of RC, representing around 70% of all RC cases [4][5][4,5]. The clear-cell subtype of RCC (ccRCC) represents around 70% of RCCs, while non-clear-cell subtypes (nccRCC) make up the remaining proportion. These include papillary RCC (paRCC) and chromophobe RCC (chrRCC), which account for 15% and 5% of all RCCs, respectively [6]. According to the World Health Organization (WHO) [6], this taxonomy is of immense importance, as each RCC subtype has its own prognosis [6][7][8][6,7,8]. Using conventional diagnostic techniques, benign lesions such as angiomyolipoma (AML) and oncocytoma (ONC) can be easily misclassified as RCC [9][10][11][12][13][9,10,11,12,13], especially lipid-poor AML [14].
Traditional methods to detect RC include complete blood count (CBC), in which red blood cells are counted; urine tests to check for blood, bacteria, or malignant cells; and blood tests which measure markers of renal function. Although these tests have the ability to suggest the presence of RC, they cannot provide an accurate diagnosis, subtype, grade, or stage. Biopsy remains the gold standard for a definitive diagnosis of RC [1][2][1,2]. However, it is not favorable due to its invasive nature, high cost, and relatively long recovery and diagnostic reporting time.
Multiphasic (Phase 1: unenhanced or precontrast, Phase 2: arterial or corticomedullary, Phase 3: portal venous or nephrographic, and Phase 4: delayed or excretory) contrast-enhanced computed tomography (CECT) [15][16][20,21], multiphasic contrast-enhanced magnetic resonance imaging (CEMRI) [17][22], and diffusion-weighted MRI (DW-MRI) [18][23] are widely used for renal tumor diagnostic purposes. Radiomics techniques have been widely performed on CT and MR images to extract quantitative markers in different aspects, such as texture, morphology, and function, that characterize disease states [19][20][24,25] and could be used to improve diagnostic and prognostic accuracy for RC [21][26] at an early stage (see Figure 1). The new era and advances in the artificial intelligence (AI) field, including various machine learning (ML) and deep learning (DL) techniques, have demonstrated an important role, along with radiomics, in many clinical applications/practices. An illustrative example of an AI-based computer-aided diagnostic/prediction (AI-based CAD/CAP) pipeline to diagnose RC/predict treatment response is shown in Figure 2. Better diagnostic and predictive capabilities will allow for earlier intervention with an optimized management plan.
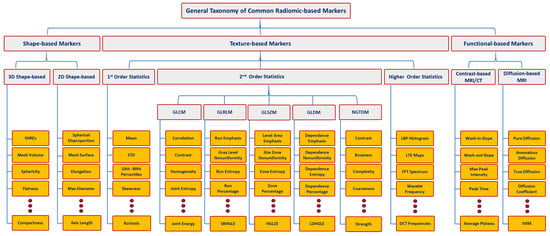
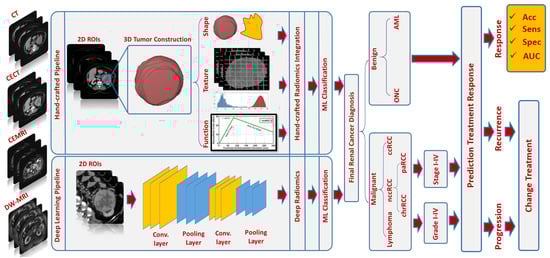
Figure 1. Taxonomy for different types of radiomic-based markers. Let magnetic resonance imaging (MRI) , computed tomography (CT, gray-level co-occurrence matrix (GLCM), CT, GLCM, GLDM, gray-level run-length matrix (GLRLM), neighborhood gray-tone difference matrix (NGTDM), gray-level size-zone matrix (GLSZM)GLRLM, NGTDM, GLSZM, SHREs, standard deviation (STD)STD, SRHGLE, HGLZE, LDHGLE, LBP, LTE, FFT, DCT, and IVIM denote magnetic resonance imaging, computed tomography, gray-level co-occurrence matrix, gray-level dependence matrix, gray-level run-length matrix, neighboring gray-tone difference matrix, gray-level size zone matrix, spherical harmonics reconstruction errors, standard deviation, short-run high gray-level emphasis, high gray-level-zone emphasis, large-dependence high gray-level emphasis, local binary pattern, Law’s texture energy, fast Fourier transform, discrete cosine transform, and intravoxel incoherent motion, respectively.
Figure 2. An illustrative example of an AI-based CAD/CAP pipeline
2. AI-Based Diagnostic Studies
2.1. Computed Tomography (CT) Studies
In the differentiation of benign and malignant renal tumors, Hodgdon et al. and Yang et al. [14][22] discovered that first- and second-order texture markers of unenhanced CT (Phase 1) yielded an accuracy range of 82% to 91% and an area under the curve (AUC) range of 0.73 to 0.90 when using support vector machine (SVM) classifiers. A number of studies by You et al., Cui et al., Lee et al., and Feng et al. [23][24][25][26] found that first- and second-order texture markers of multiphasic CECT, along with SVM classifiers, achieved an accuracy range of 72% to 94% and an AUC range of 0.75 to 0.97. Yan et al. [27], Ma et al. [28], and Tang et al. [29] achieved comparable results with texture markers from multiphasic CECT. For instance, Yan et al. [27] employed artificial neural networks (ANNs) in conjunction with texture markers and attained 97% accuracy on a relatively small, unbalanced dataset (N = 50). Ma et al. [28] and Tang et al. [29] reported an AUC range of 0.67 to 0.93 using logistic regression (LR) classifiers in combination with texture markers. An expanded study by Ma et al. [28] found high accuracy using the nephrographic phase (Phase 3) of CECT with an AUC range of 0.74 to 0.89.
Tanaka et al. [30] implemented a DL pipeline using the Inception-V3 convolutional neural network (CNN) and reported an accuracy range of 41% to 88% and an AUC range of 0.49 to 0.85, favoring Phase 2 CECT over other contrast phases. Li et al. [31] successfully distinguished benign ONC from malignant chrRCC by employing first- and second-order texture markers of multiphasic CECT along with an SVM classifier, resulting in 95% accuracy and an AUC of 0.85. The authors suggested that phases 2 and 3 outperformed other contrast phases for the specific task. In subsequent studies with larger datasets [32][33], they discovered that incorporating clinical factors improved the overall diagnostic accuracy. Meanwhile, Zabihollahy et al. [34] employed 2D and 3D CNNs in conjunction with semiautomated and automated tumor segmentation methods, reporting an accuracy range of 77% to 84%.
An illustrative example of an AI-based CAD/CAP pipeline
2. AI-Based Diagnostic Studies
2.1. Computed Tomography (CT) Studies
In the differentiation of benign and malignant renal tumors, Hodgdon et al. and Yang et al. [14,27] discovered that first- and second-order texture markers of unenhanced CT (Phase 1) yielded an accuracy range of 82% to 91% and an area under the curve (AUC) range of 0.73 to 0.90 when using support vector machine (SVM) classifiers. A number of studies by You et al., Cui et al., Lee et al., and Feng et al. [28,52,53,54] found that first- and second-order texture markers of multiphasic CECT, along with SVM classifiers, achieved an accuracy range of 72% to 94% and an AUC range of 0.75 to 0.97. Yan et al. [55], Ma et al. [56], and Tang et al. [57] achieved comparable results with texture markers from multiphasic CECT. For instance, Yan et al. [55] employed artificial neural networks (ANNs) in conjunction with texture markers and attained 97% accuracy on a relatively small, unbalanced dataset (N = 50). Ma et al. [56] and Tang et al. [57] reported an AUC range of 0.67 to 0.93 using logistic regression (LR) classifiers in combination with texture markers. An expanded study by Ma et al. [56] found high accuracy using the nephrographic phase (Phase 3) of CECT with an AUC range of 0.74 to 0.89.
Tanaka et al. [62] implemented a DL pipeline using the Inception-V3 convolutional neural network (CNN) and reported an accuracy range of 41% to 88% and an AUC range of 0.49 to 0.85, favoring Phase 2 CECT over other contrast phases. Li et al. [63] successfully distinguished benign ONC from malignant chrRCC by employing first- and second-order texture markers of multiphasic CECT along with an SVM classifier, resulting in 95% accuracy and an AUC of 0.85. The authors suggested that phases 2 and 3 outperformed other contrast phases for the specific task. In subsequent studies with larger datasets [64,65], they discovered that incorporating clinical factors improved the overall diagnostic accuracy. Meanwhile, Zabihollahy et al. [66] employed 2D and 3D CNNs in conjunction with semiautomated and automated tumor segmentation methods, reporting an accuracy range of 77% to 84%.
To sum up, the AI-based CAD systems that utilized CECT images demonstrated promising findings in the early diagnosis of RCC. These systems have effectively differentiated malignant from benign tumors with an accuracy range of 41% to 98% and an AUC range of 0.49 to 0.97, classified RCC tumor subtypes with an accuracy range of 47% to 92% and an AUC range of 0.49 to 0.92, and graded and staged RCC tumors with an accuracy range of 70% to 97% and an AUC range of 0.67 to 0.98. Entropy, a first-order texture marker, has frequently been identified as a crucial radiomic marker extractable from multiphasic CECT. Phases 2 and 3, namely the arterial phase/corticomedullary phase and portal venous/nephrographic phase, have been the most commonly used and recommended. Furthermore, machine learning classifiers such as LR, RF, SVM, and ANN have yielded the best classification results. While CECT has proven sufficient in RCC diagnosis, it is not the preferred modality when radiation exposure is contraindicated (e.g., in pregnant or pediatric patients). This has prompted researchers to explore the capabilities of alternative imaging modalities, such as MRI, to avoid radiation exposure whenever possible.
2.2. Magnetic Resonance Imaging (MRI) Studies
In the differentiation of benign and malignant renal tumors, Xu et al. [35] investigated the potential of DL and ML using T2-weighted MRI and DW-MRI. Their study included a total of 217 patients with renal tumors, allocating 173 patients to the training set and 44 patients to the testing set. Following manual identification of ROIs, the investigators used three distinct DL ResNet-18 models and three separate handcrafted-based RF models, incorporating a total of 96 radiomic markers. The first model used T2-weighted imaging, the second model used DW-MRI, and the third model combined both modalities. The ResNet-18 models demonstrated accuracies of 77%, 80%, and 81.3%, while the handcrafted RF models attained accuracies of 77%, 71%, and 82%. Oostenburgge et al. [36] conducted a study to evaluate texture markers derived from 3D ADC maps of DW-MR images for distinguishing benign ONC from malignant RCC. The dataset comprised 39 renal tumors, including 32 RCCs and 7 ONCs. The authors found that entropy, STD, tumor volume, and gender demonstrated statistical significance among the different tumor groups. By integrating these markers, they achieved an AUC of 0.91 with 86% sensitivity and 84% specificity using the LR classification model. Furthermore, they discovered that entropy and the 25th percentile were statistically significant when comparing healthy cortical regions with tumor tissue.
In the differentiation of benign and malignant renal tumors, Xu et al. [29] investigated the potential of DL and ML using T2-weighted MRI and DW-MRI. Their study included a total of 217 patients with renal tumors, allocating 173 patients to the training set and 44 patients to the testing set. Following manual identification of ROIs, the investigators used three distinct DL ResNet-18 models and three separate handcrafted-based RF models, incorporating a total of 96 radiomic markers. The first model used T2-weighted imaging, the second model used DW-MRI, and the third model combined both modalities. The ResNet-18 models demonstrated accuracies of 77%, 80%, and 81.3%, while the handcrafted RF models attained accuracies of 77%, 71%, and 82%. Oostenburgge et al. [30] conducted a study to evaluate texture markers derived from 3D ADC maps of DW-MR images for distinguishing benign ONC from malignant RCC. The dataset comprised 39 renal tumors, including 32 RCCs and 7 ONCs. The authors found that entropy, STD, tumor volume, and gender demonstrated statistical significance among the different tumor groups. By integrating these markers, they achieved an AUC of 0.91 with 86% sensitivity and 84% specificity using the LR classification model. Furthermore, they discovered that entropy and the 25th percentile were statistically significant when comparing healthy cortical regions with tumor tissue.
Gunduz et al. [37] used texture analysis of ADC maps for distinguishing benign ONC from malignant chrRCC in a small cohort of 14 patients (ONC = 6 and chrRCC = 8). The study identified six texture markers, with five being second-order (run variance, short-run emphasis, normalized run-length nonuniformity, run percentage, long-run emphasis) and one being first-order (square root of mean ADC). They achieved 87.5% sensitivity and 83% specificity using ROC analysis. Matsumoto et al. [38] explored texture analysis on DW-MRI for differentiating between AMLs and ccRCCs. Their study consisted of two datasets. The first dataset comprised 83 tumors (AML = 18 and ccRCC = 65) that were used for the development of the diagnostic model, while, the second dataset included 39 tumors (AML = 13 and ccRCC = 17), serving as external validation. From the ADC maps, they extracted 39 texture markers and employed an RF model to determine the importance of these markers. They identified the mean ADC value as a significant first-order texture marker and both long-run low gray-level enhancement and gray-level run emphasis as dominant second-order texture markers in the diagnostic process, achieving an AUC of 0.87.
Gunduz et al. [94] used texture analysis of ADC maps for distinguishing benign ONC from malignant chrRCC in a small cohort of 14 patients (ONC = 6 and chrRCC = 8). The study identified six texture markers, with five being second-order (run variance, short-run emphasis, normalized run-length nonuniformity, run percentage, long-run emphasis) and one being first-order (square root of mean ADC). They achieved 87.5% sensitivity and 83% specificity using ROC analysis. Matsumoto et al. [32] explored texture analysis on DW-MRI for differentiating between AMLs and ccRCCs. Their study consisted of two datasets. The first dataset comprised 83 tumors (AML = 18 and ccRCC = 65) that were used for the development of the diagnostic model, while, the second dataset included 39 tumors (AML = 13 and ccRCC = 17), serving as external validation. From the ADC maps, they extracted 39 texture markers and employed an RF model to determine the importance of these markers. They identified the mean ADC value as a significant first-order texture marker and both long-run low gray-level enhancement and gray-level run emphasis as dominant second-order texture markers in the diagnostic process, achieving an AUC of 0.87.
To sum up, the AI-based CAD systems that utilized various types of MRIs demonstrated interesting results and findings in the early diagnosis of RCC. These systems achieved an accuracy range of 77% to 91% and an AUC range of 0.82 to 0.91 for differentiating malignant from benign tumors. Furthermore, they attained an accuracy range of 77% to 98% and an AUC range of 0.76 to 0.89 for subtyping and/or grading RCC tumors. First-order texture markers such as entropy, MPP, mean, skewness, and kurtosis have been frequently identified as the most dominant and important radiomic markers derived from multiparametric MRIs. These markers are useful for differentiating between benign and malignant renal tumors. The addition of second-order texture markers derived from GLRLM has also proven valuable. Notably, texture analysis of ADCs derived from DW-MRI was the most commonly used technique among MRI studies. Additionally, RF classifiers were chosen by the majority of these studies, yielding superior classification results. In spite of MRIs being useful for identifying malignancy status, subtyping RCCs, and grading RCCs, there is a lack of research investigating the staging of RCCs. Staging is crucial for determining a tumor’s spread, size, and location, making it a vital area for future investigation.