Your browser does not fully support modern features. Please upgrade for a smoother experience.
Please note this is a comparison between Version 1 by Annunziata Lapolla and Version 2 by Lindsay Dong.
The increased frequency of type 2 diabetes worldwide has led to a concomitant increase in pregnancies complicated by type 2 diabetes This is mainly due to two factors: the earlier age of diabetes onset and the advanced age of pregnancy occurrence. Patients with type 2 diabetes in pregnancy show a high frequency of maternal and fetal complications, posing a series of problems in the follow-up of these women.
- diabetes
- pregnancy
- maternal complications
- fetal complications
1. Introduction
Pregnancy complicated by diabetes, if not properly followed and treated, is associated with severe maternal and fetal complications [1]. In this context, the recent increase all over the world of type 2 diabetes and, consequently in pregnancy [2] highlighted new problems in terms of approach to medical care for these women. Recent publications evidence an increase in pregnancy in women affected by type 2 diabetes, which is often complicated by adverse maternal and fetal outcomes. Low attendance to pre-pregnancy care, non-optimal glycemic control during organogenesis, high utilization of harmful drugs during pregnancy, and low folic acid consumption contribute to adverse maternal and fetal outcomes. Furthermore, young women with type 2 diabetes in pregnancy experiencing these negative outcomes are often immigrants, minorities, and/or in low socioeconomic conditions that prevent adequate pre-pregnancy care and strict follow up during pregnancy.
2. Epidemiology
Over the last 20 years, the marked increase in the frequency of type 2 diabetes (T2D) worldwide has led to a concomitant increase in pregnancies in women affected by T2D, due to two main factors: the earlier age of diabetes onset and the advanced age of pregnancy occurrence [2]. In this context, many studies have evaluated the prevalence of T2D in pregnancy. Utilizing data from the 1988 National Maternal and Infant Health Survey, Engelgau et al. estimated that in the U.S., diabetes was present in 154,000 (4%) pregnancies that resulted in live births, among which 8% were complicated by type 2 diabetes [3]. Albrecht et al. evaluated the prevalence of this condition in the United States between 1994 and 2004, reporting an increase of 367% [4]. From 1998 to 2012, the rate in Sweden rose from 0.003 to 0.1% [5]. Meanwhile, a report from Scotland evidenced a growth from 1998 to 2013 of 0.1 to 0.19% [6]. Using electronic health records of the United Kingdom (UK), Coton et al. showed that the prevalence of T2D increased from 1995 to 2008 from 2.34 per 1000 to 5.09 per 1000, with a more rapid increase in 2012 (10.2 per 1000) [7]. An observational retrospective study in Spain analyzed 2,481,479 deliveries between 2009 and 2015 [8]. The data showed that the incidence rate per 10,000 deliveries grew significantly in T2D pregnant women, from 14.56 in 2009 to 22.4 (p < 0.001) in 2015.3. Pregnancy Outcomes
The summary of the studies on pregnancies complicated by type 2 diabetes are reported in Table 1.Table 1. Summary of studies on pregnancies complicated by type 2 diabetes. PPC = pre-pregnancy counseling, FA = folic acid, NA = not available, CA = congenital anomaly, SB = stillbirth, PND = perinatal death, ND = neonatal death, LGA = large for gestational age, NM = neonatal mortality, SGA = small for gestational age, PTD = preterm delivery, NI = non indigenous, I = indigenous, IR = insulin resistance, Non IR = non-insulin resistance, CS = caesarean section.
| Author (References) |
N° | T2D Duration Years |
AGE Years | HbA1c% 1st Trim. |
BMI or % Obesity (O) (>30 kg/m | 2 | ) | Caucasian | PPC | Folic Acid | Pregnancy Outcomes | Country |
|---|---|---|---|---|---|---|---|---|---|---|---|---|
| Macintosh 2006 [9] | Macintosh 2006 [11] |
652 | 3(2–6) | 33.5(30–37) | 7.0(6.1–7.1) | O = 62% | 50.8% | 24.8% | 29.4% | CA 4.3% SB 29.2‰ PND 32.3‰ ND 9.5‰ LGA 13.9% |
UK CEMACH |
|
| Lapolla 2008 [10] | Lapolla 2008 [12] |
164 | 5.7(5.9) | 33.2 (4.8) | 6.6(1.7) | 28.1(6.4) | NA | 29.1% | NA | Miscarriage 10.7% ND 1.9% SB 1.9% CA 2.0% Macrosomia 11.8% |
Italy | |
| Owens 2015 [11] | Owens 2015 [13] |
108 | 4.3(3.8) | 33.7(4.8) | 6.9(1.7) | 34.9(6.7) | 70% | 34% | 55% | Miscarriage 8.3% SB 1.9% CA 2.8% LGA 20% SGA 5.6% |
Ireland ATLANTIC DIP |
|
| Murphy 2017 [12] | Murphy 2017 [14] |
1386 | 4.8(4.3) | 33.6(5.2) | 6.8 | 33.3(7.3) | 46% | NA | 22.5% | CA 34.6‰ ND 11.4‰ SB 10.5‰ PTD 21.7% LGA 23.9% |
UK | |
| Maple-Brown 2019 [13] | Maple-Brown 2019 [15] |
175 (NI 23 I 152) |
NA | NI = 33.6(5.6) I = 31.1(5.6) |
NI = 6.9(1.8) I = 7.8(2.0) |
NI = 30.3(7.6)I = 31.3(5.7) | NA | NA | NA | CA NI = 4.2 vs. I = 4.6% LGA NI = 27.3 vs. I = 39.5% SGA NI = 18.2 vs. I = 6.9% |
Australia PANDORA | |
| Ali 2020 [14] | Ali 2020 [16] |
50 | 5.49(4.4) | 35.5(3.8) | NA | 32.6(8.1) | 59% | 46% | 64% | Intrauterine fetal death 8.1% CA 2.7% Miscarriage 18.3% Macrosomia ≥ 4000 g 30% |
Ireland | |
| Lopez de Andres 2020 [8] |
4391 | NA | 34.17(5.42) | NA | 10.79% | NA | NA | NA | PTD 15.03% | Spain | ||
| Nadeau 2020 [15] | Nadeau 2020 [17] |
160 | NA | IR 29.1(6.4) Non IR 30.6(5.5) |
IR 8.4(2.0) Non IR 7.3(1.9) |
IR 38.6(9.2) Non IR 36.6(8.2) |
IR 28% Non IR19% |
NA | NA | PTD IR 23% NON-IR 25% SB IR 1% NON-IR 2% CA IR 6% NON-IR 6% LGA IR 20% NON-IR 32% SGA IR 3% NON-IR 4% |
USA 2 groups according to insulin resistance |
|
| Murphy 2021 [16] | Murphy 2021 [18] |
8685 | 3(0–10) | 34 (22–37) | 6.9 | 32.5 (24.8–43.0) ≥30 = 65% |
43.2% | NA | 22.3% | PTD 23.4% SB 13.5‰ ND11.2‰ CA 40.5‰ LGA 26.2% SGA 14.1% |
UK | |
| Guarnotta 2021 [17] | Guarnotta 2021 [19] |
62 | 4.11(3.1) | 33.7(6.1) | NA | 31.4(6.7) | NA | NA | NA | PTD 19.1% Miscarriage 12.9% LGA 25.8% |
Italy | |
| Gualdani 2021 [18] | Gualdani 2021 [20] |
606 | NA | 33.8(4.9) | NA | 28.1(6.3) | 78.3% | NA | NA | LGA 12.5% CA 0.9% PTD 25.6% |
Italy | |
| Newman 2021 [19] | Newman 2021 [21] |
244 | 6.8(6.3) | 34.3(5.7) | 6.7(3.5) | 32.5(6.9) | 61.1% | 29.5% | 49.6% | SB 0.4% PTD 22.4% CA 3.9% |
Ireland | |
| Newman 2022 [20] | Newman 2022 [22] |
374 | 5.6(3.2) | 34.4(5.8) | 6.7(3.5) | 33.4 (7.6) | 63.6% | 25.9% | 36.1% | SB 0.8% Miscarriage 15.6% PTD 20.7% CA 5.1% |
Ireland | |
| Pylypjuk C 2021 [21] | Pylypjuk C 2021 [23] |
112 | NA | 22 (19–25.5) |
9.3 (7.8–10.9) |
27.5 (26.9–28.6) O = 39.6% |
NA | NA | NA | Miscarriage 27.7% SB 11.6% NND 3.6% Shoulder distocia 13.1% CS 41% LGA 55.4% CA 19.6% |
Canada | |
| Today study 2022 [22] | Today study 2022 [24] |
141 (260 pregnancies) | 8.1(3.2) | 21.5(3.16) | 8.7(2.78) | 35.6 (7.16) | 15% | 20% | NA | Miscarriage 25.3% PTD 23.8% Fetal death 3.7% CA 10% |
USA |
4. Metabolic Control during Pregnancy
To clarify the behavior of glycemic profiles in T2D pregnant women, a prospective study was conducted by seven-day continuous glucose monitoring in 40 T2Ds in the first, second, and third trimesters of pregnancy. All patients were treated with insulin during pregnancy. The data show that the percentage of time spent in a state of hyperglycemia (>140 mg/dL per 24 h) was reduced during pregnancy (32.8% in the first, 19.5% in the second, and 11.6% in the third trimester, p < 0.001). However, the frequency of nocturnal hypoglycemia was not significantly different during pregnancy (14.8% in the first, 16.5% in the second, and 18.4% in the third trimester, p > 0.05) considering glucose values <70 mg/dL and <50 mg/dL [23][28]. However, new systems for glucose evaluation (continuous glucose monitoring systems) and new therapeutic strategies (continuous insulin infusion systems; insulin analogs) are not routinely used in T2D mothers. Even if T2D pregnant women show low levels of HbA1c during pregnancy, only half of these pregnancies meet the recommended levels of HbA1c and glycemia [14][24][25][16,29,30]. The physiologic insulin resistance of pregnancy is amplified by obesity, which often characterizes T2D patients [26][27][31,32]. How effective is adherence to treatment in pregnant women with diabetes? To answer this question, Wernimont et al. performed a prospective study of 103 women, 40 T2D at <29 sg, between December 2015 and June 2019. All patients were educated on a cellular glucometer that uploaded the glucose values to a cloud-based system. The overall adherence to glucose testing was low in these patients (51%).5. Factors Affecting Pregnancy Outcomes in Women with Type 2 Diabetes
One answer comes from Gaudio et al., who evaluated the outcome of T2D pregnancy in women of childbearing age (16–45 yr), taking into consideration women that delivered in 2004 (3218), compared with those who delivered in 2017 (6.657) [28][34]. Of the patients examined, 61.5% were affected by T2D in 2004 and 65% in 2017. The glycemic control improved in T2D women in 2017 compared to 2004; in particular, the proportion of women with HbA1c < 6.5% increased from 27.2% to 35.4%. Furthermore, more were treated with antihypertensive and statin drugs at preconception. However, there were unfavorable factors (e.g., smoking, obesity) in 70.7% of these pregnancies, and only 23% received counseling on the necessity of utilizing appropriate contraception when metabolic control is not optimal. Using statistical data linked to birth certificates for a cohort of T2D patients (38,324) who delivered in California (US) between 1997 and 2006, it was found that 33,502 attended prenatal care in the first, 3723 in the second, and 810 in the third trimester of pregnancy, and 275 in the 36th gestational week. The frequency of intrauterine fetal demise was higher in women attending prenatal care at the time of delivery than those attending in the first trimester (11.3% vs. 0.9%, p < 0.001). The same true is for the rate of preterm delivery (29.4% vs. 21.0%, p < 0.004). After adjusting for possible confounding variables, the significant differences were confirmed [29][35]. Finally, some considerations must be made regarding the hypoglycemic therapy utilized in T2D pregnant women. In most studies, metformin is the most common drug utilized (alone or in conjunction with insulin). In particular, Murphy et al. found that most T2D women were treated with metformin and only 18.5% received insulin, with a high frequency of SGA babies [16][18]. This is surprising, considering that T2D pregnant women often have a short duration of disease and no severe chronic diabetic complications. Although, vasculopathy can reduce uteroplacental flux with a consequent reduction in nutrients for the fetus. Similar results were reported by Feig et al. in a study on the effect of metformin + insulin in T2D pregnant women. In this case, patients treated with metformin showed a high rate of SGA babies [30][39]. Metformin crosses the placenta and can reduce the production of ATP, which is critical for embryo development [30][39]. Therefore, studies evaluating the long-term effects on the offspring of mothers treated with metformin are necessary to safely utilize this drug in pregnancy [31][40].6. Physiopathology
Despite the poor metabolic control in T2D pregnant women, a high rate of perinatal mortality and other negative maternal outcomes are experienced by these women. The negative effect of obesity, often present in T2D pregnant women, is well known and can explain (in part) these outcomes [32][33][34][36,37,38]; however, other factors may play a role. Kurana et al. evaluated the endothelial function, utilizing flow-mediated vasodilatation (FMD) in T2D pregnant women in the second and third trimesters during a hyperinsulinemic–hyperglycemic clamp study [35][41]. The results showed that hyperinsulinemia did not affect FMD in both trimesters (second and third); this could be due the to endothelium resistance to the vasodilatory effect of insulin. However, hyperglycemia significantly reduced FMD in late pregnancy and may contribute to increased negative pregnancy outcomes. Gene expression and the function of endothelial cells in the human fetal umbilical vein were studied in 17 T2D pregnant women using flow cytometry and genome-wide microarray expression methods. High levels of mitochondrial superoxide anions, increased apoptosis, and reduced cell proliferation were found. Furthermore, 42 genes were down-regulated, and 90 genes were up-regulated. Up-regulated genes are important in endothelial dysfunction, which in turn, influences cellular movements and the inflammatory response; this can contribute to the maternal and fetal complications of these women [36][42].7. Strategies to Improve Pregnancy Outcomes in Women with TD2
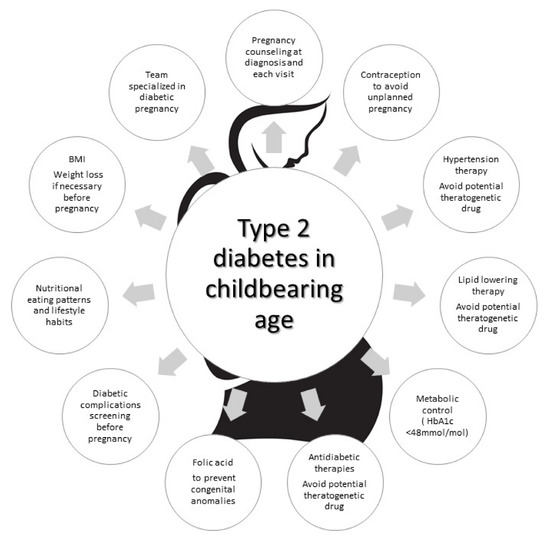
In this context, the NPID 2019–2020 report identified crucial areas of intervention to reduce maternal and fetal complications, focusing attention on T2D pregnant women. It states that for T2D women, “access to structured education, management of weight, and diabetes prevention should be prioritized”. Then, “support for provision of contraception and pregnancy preparation to improve glycemic management, and 5 mg folic acid supplementation in women with T2D is recommended” [37][9]. This agrees with the conclusions of the audit meeting of the Diabetic Pregnancy Study Groups of the European Association of the Study of Diabetes [38][48] and the recommendations of the American Diabetes Association [39][49]. Low attendance to pre-pregnancy care, low consumption of folic acid, low utilization of contraceptives in T2D women with bad glycemic control to avoid pregnancy, non-optimal metabolic control before and during pregnancy, and high utilization of harmful drugs during pregnancy are the unmet goals (Figure 1).Figure 1.
Strategies to be used to address the unmet goals in pregnant women with type 2 diabetes.