Your browser does not fully support modern features. Please upgrade for a smoother experience.
Please note this is a comparison between Version 2 by Sirius Huang and Version 1 by Prashanth Shyam Kumar.
Vectorcardiography (VCG) is a valuable diagnostic tool that complements the standard 12-lead ECG by offering additional spatiotemporal information to clinicians. However, due to the need for additional measurement hardware and too many electrodes in a clinical scenario if performed along with a standard 12-lead, there is a need to find methods to derive the VCG from the ECG.
- ECG
- vectorcardiography
- LSTM networks
- personalized medicine
- Bayesian optimization
1. Introduction
Clinical ECG consists of 12 leads (S12)—namely limb leads I, II, and III, augmented leads aVR, aVL, aVF, and precordial leads V1 through V6. Vectorcardiography (VCG) [1] is complementary to the S12. It is essentially the spatiotemporal representation of the cardiac vector in 3 orthogonal planes—namely vertical, transverse, and sagittal planes. S12 is the standard whereas VCG is rarely acquired. However, several conditions have more prominent VCG changes than S12, so it is a useful complement to S12. Furthermore, dynamic spatial and temporal information that can be derived from VCGs is unavailable from an ECG, which may enhance the automatic assessments of cardiovascular diseases [2].
Ernest Frank introduced the XYZ lead system known as vectorcardiography to provide a 3-dimensional representation of the cardiac vector. Figure 1 shows the electrode placement for vectorcardiogram and an example of a vectorcardiogram tracing for a healthy male subject.
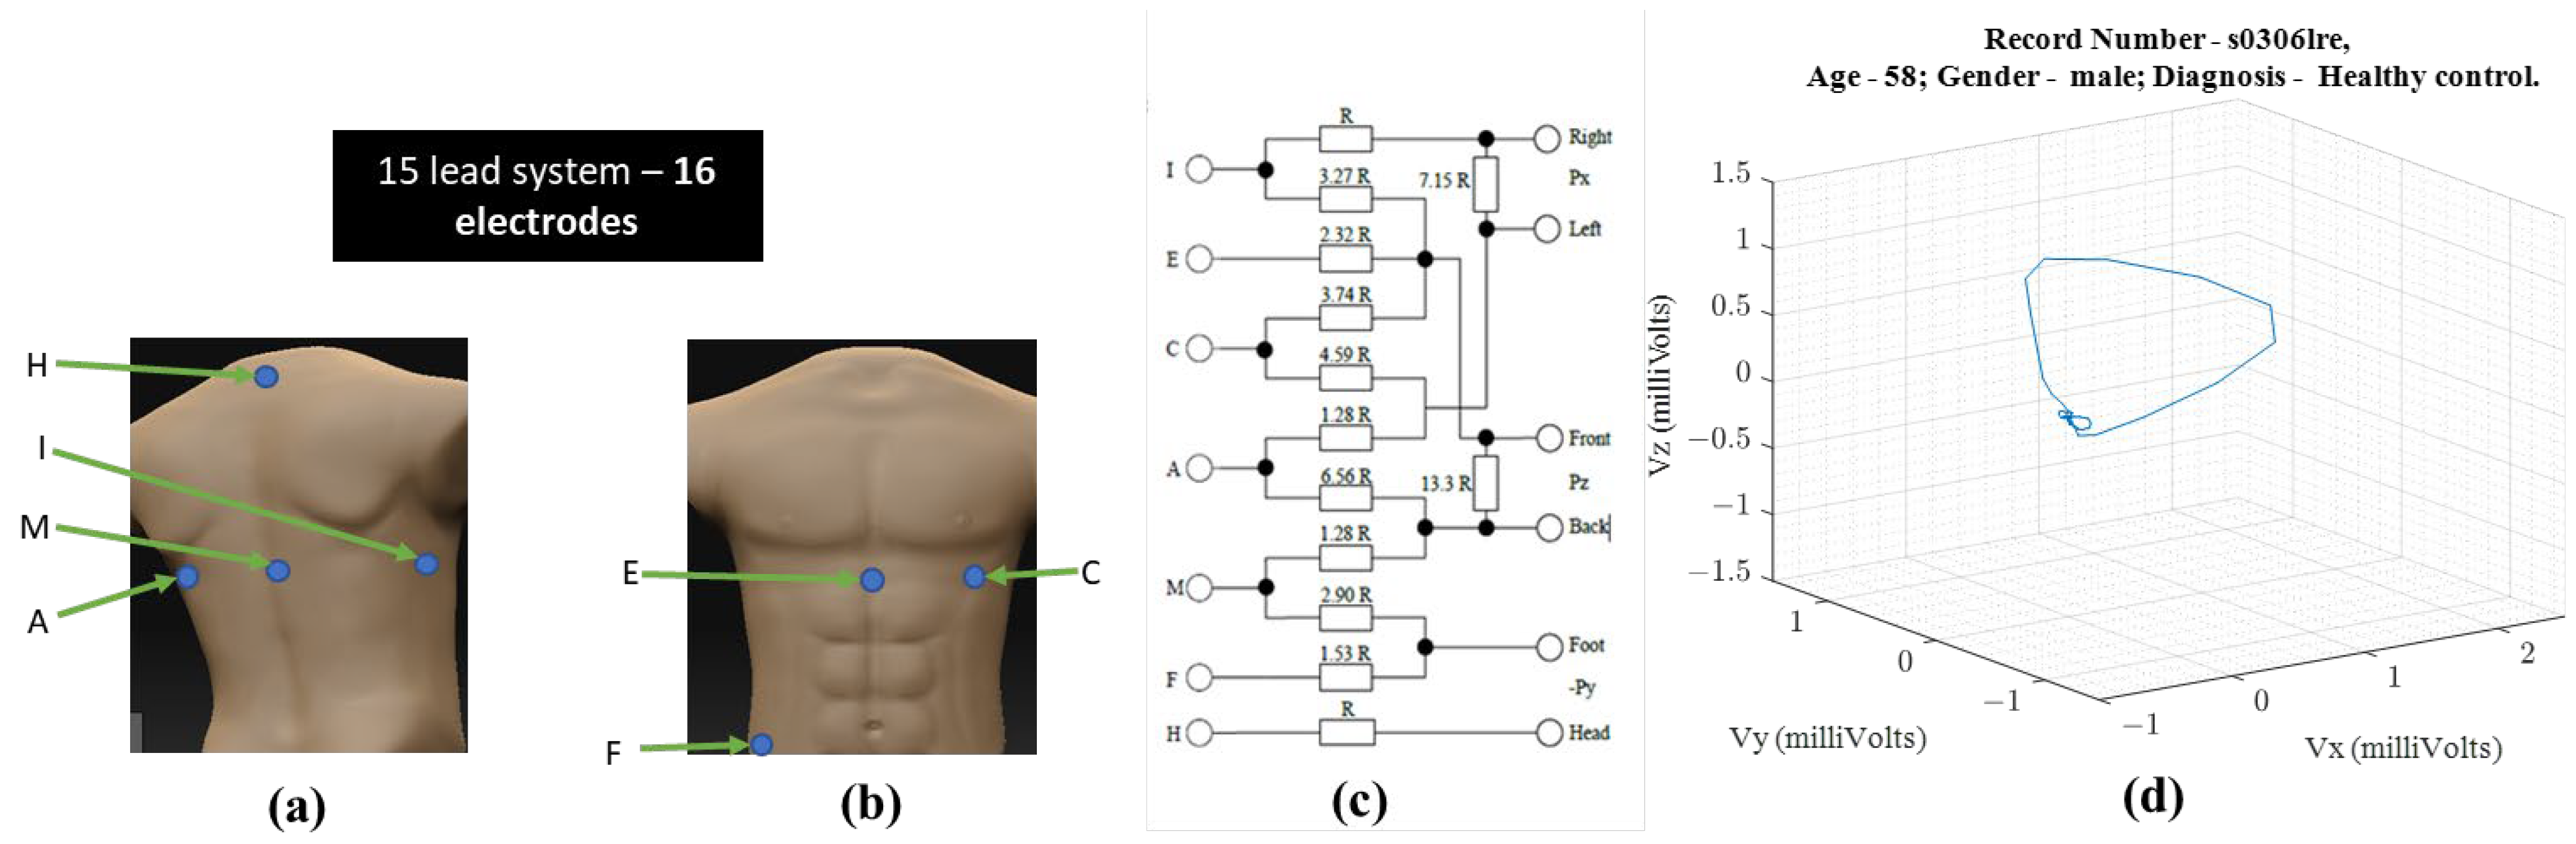
Figure 1. For obtaining VCG—(a) ventral electrode positions, (b) dorsal electrode positions, (c) resistor network needed to compensate for non-homogenous human tissue—additional instrumentation beyond standard 12-lead ECG equipment [1] (d) 3-D illustration of a single heartbeat from a 58-year-old healthy male [3,4][3][4].
Following the illustration in Figure 1, a vector tracing the boundary of this 3D object circumscribed by the vectorcardiography is the cardiac vector. Ideally, these ECG leads—X, Y, and Z—would be orthogonal to each other and form a basis for the cartesian space spanned by the cardiac vector. Figure 2 illustrates how the temporal X, Y, and Z lead waveforms translate to a spatiotemporal VCG.
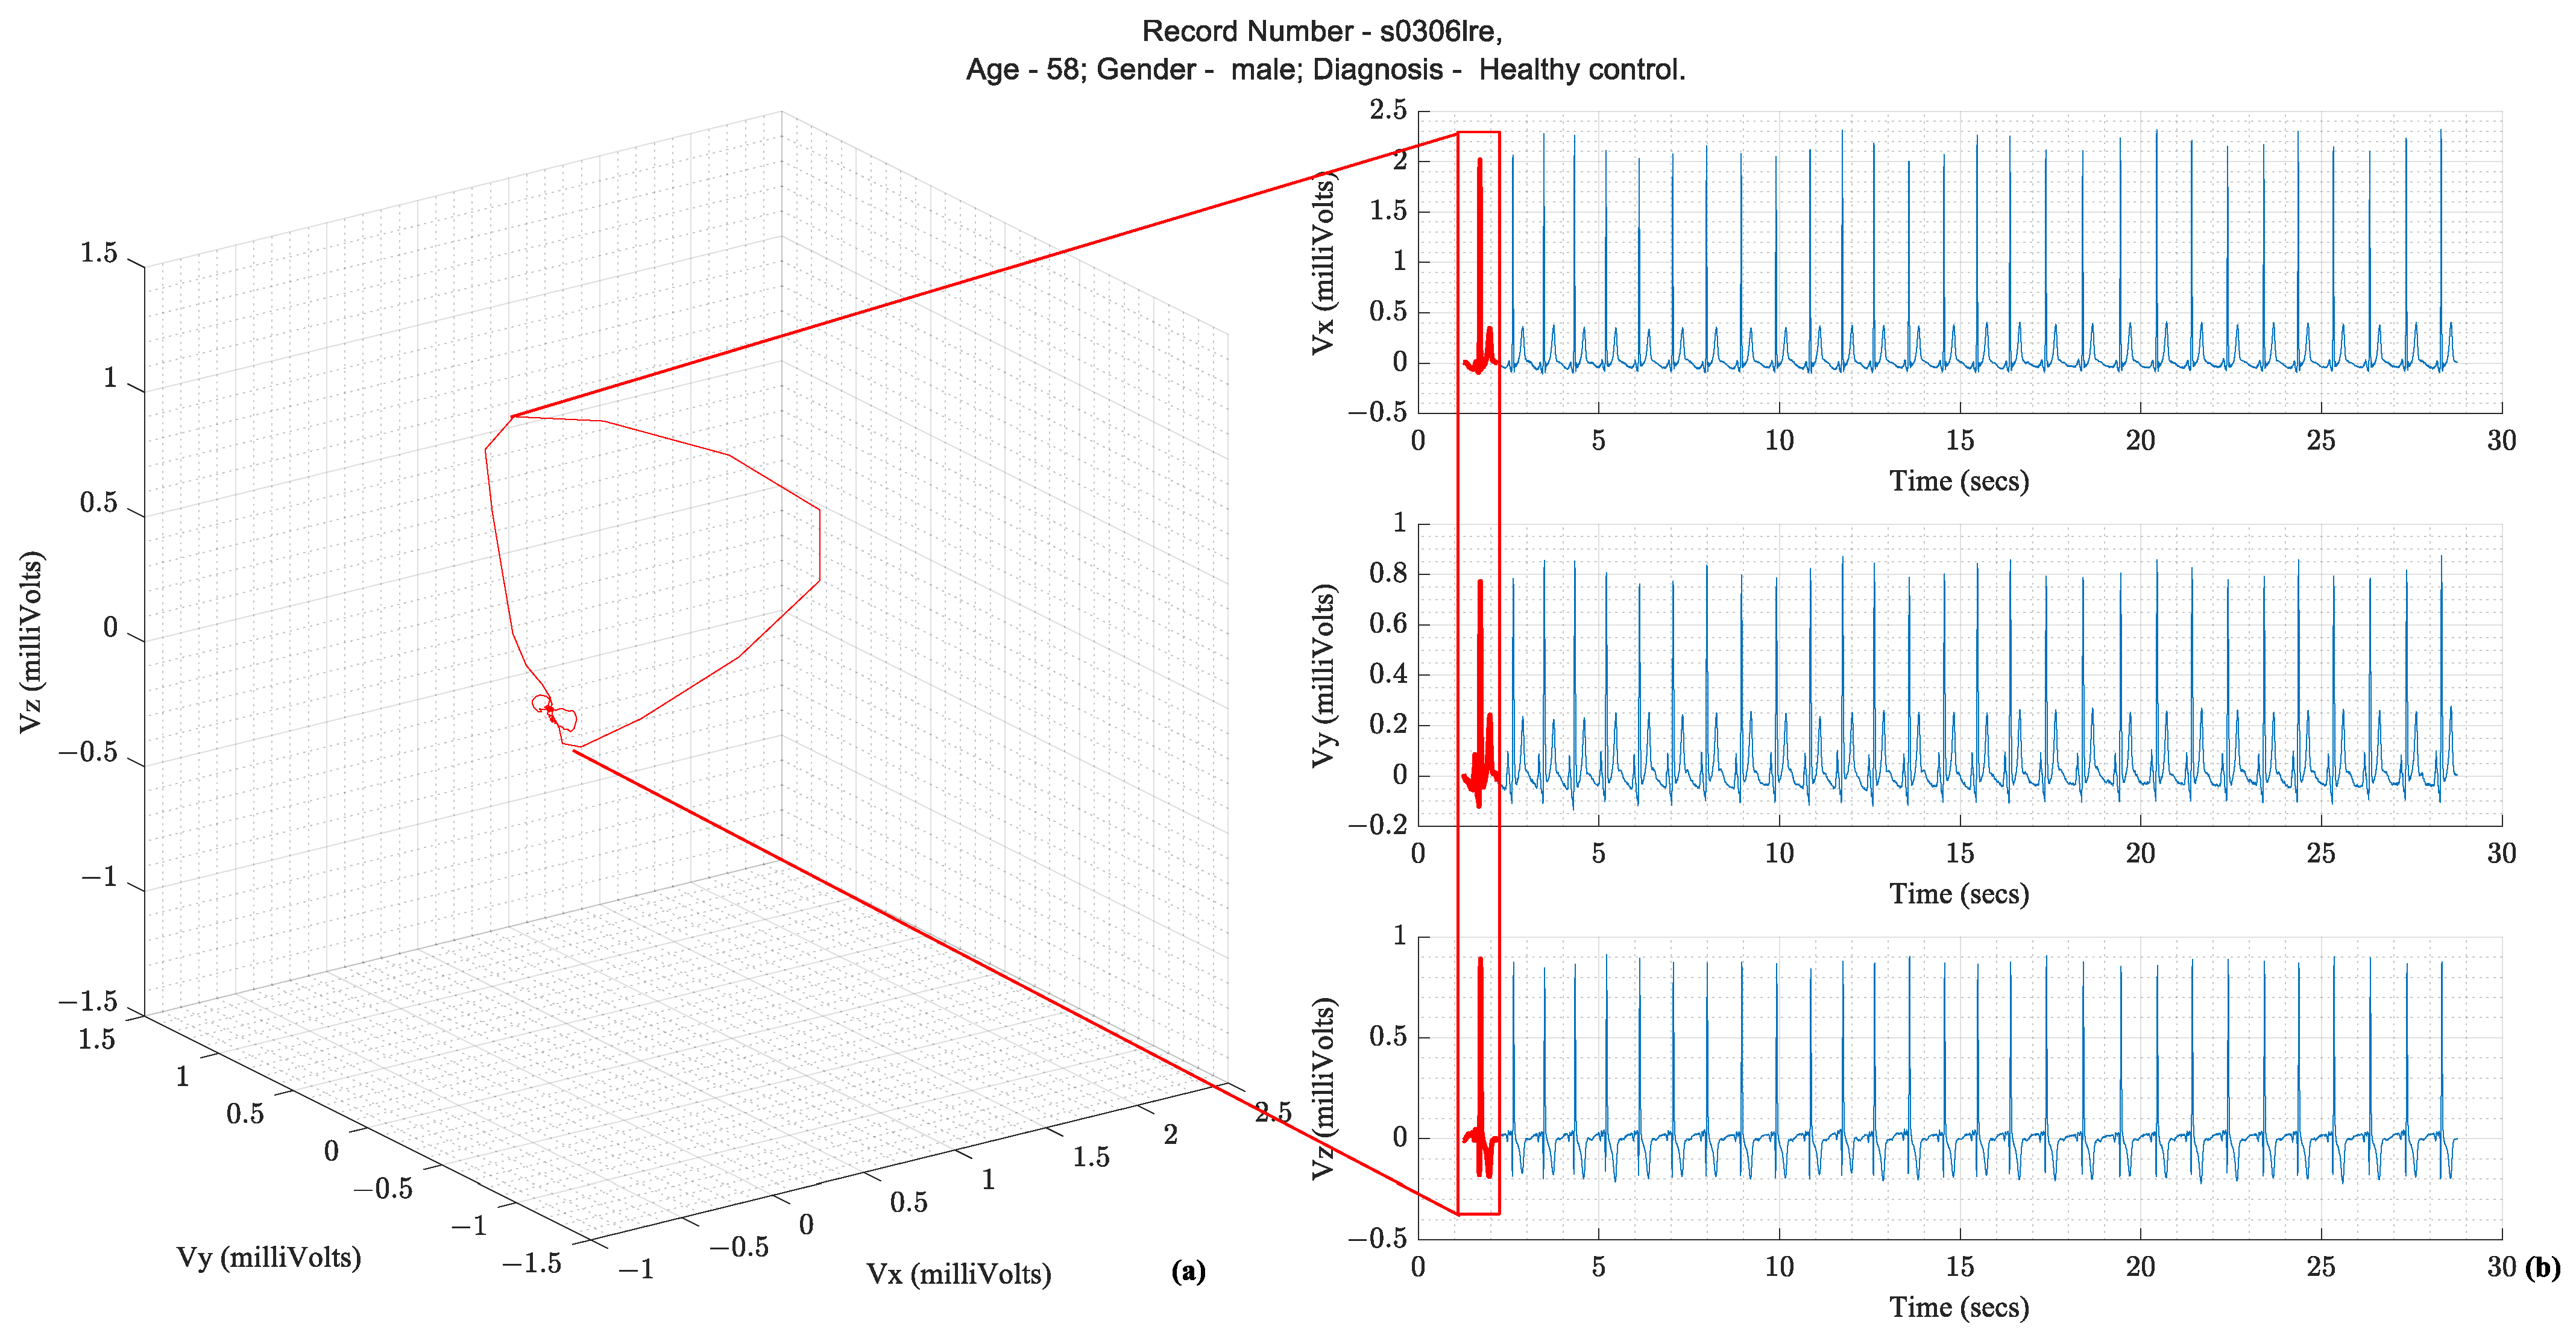
Figure 2.
(
a
) Vectorcardiography of one heartbeat (
The S12 requires ten electrodes on the skin while the Frank XYZ requires only 7 electrodes. There is only one electrode position in common (i.e., the left leg). Suppose all 15 leads are to be recorded with an ECG acquisition system, then sixteen electrodes should be placed on the patient’s skin. Another practical issue with the location of the Frank XYZ electrodes is the rear electrodes. Patients can sleep on their backs, but having cables on their backs can be uncomfortable.
2. Diagnostic Importance of VCG and Its Complementarity to ECG
Over several decades of research, three parameters extracted from the VCG waveform are considered diagnostically important. They are the QRS amplitude, T-loop magnitudes, and Spatial QRS-T loop angles. Figure 3 illustrates these parameters on a vectorcardiogram.
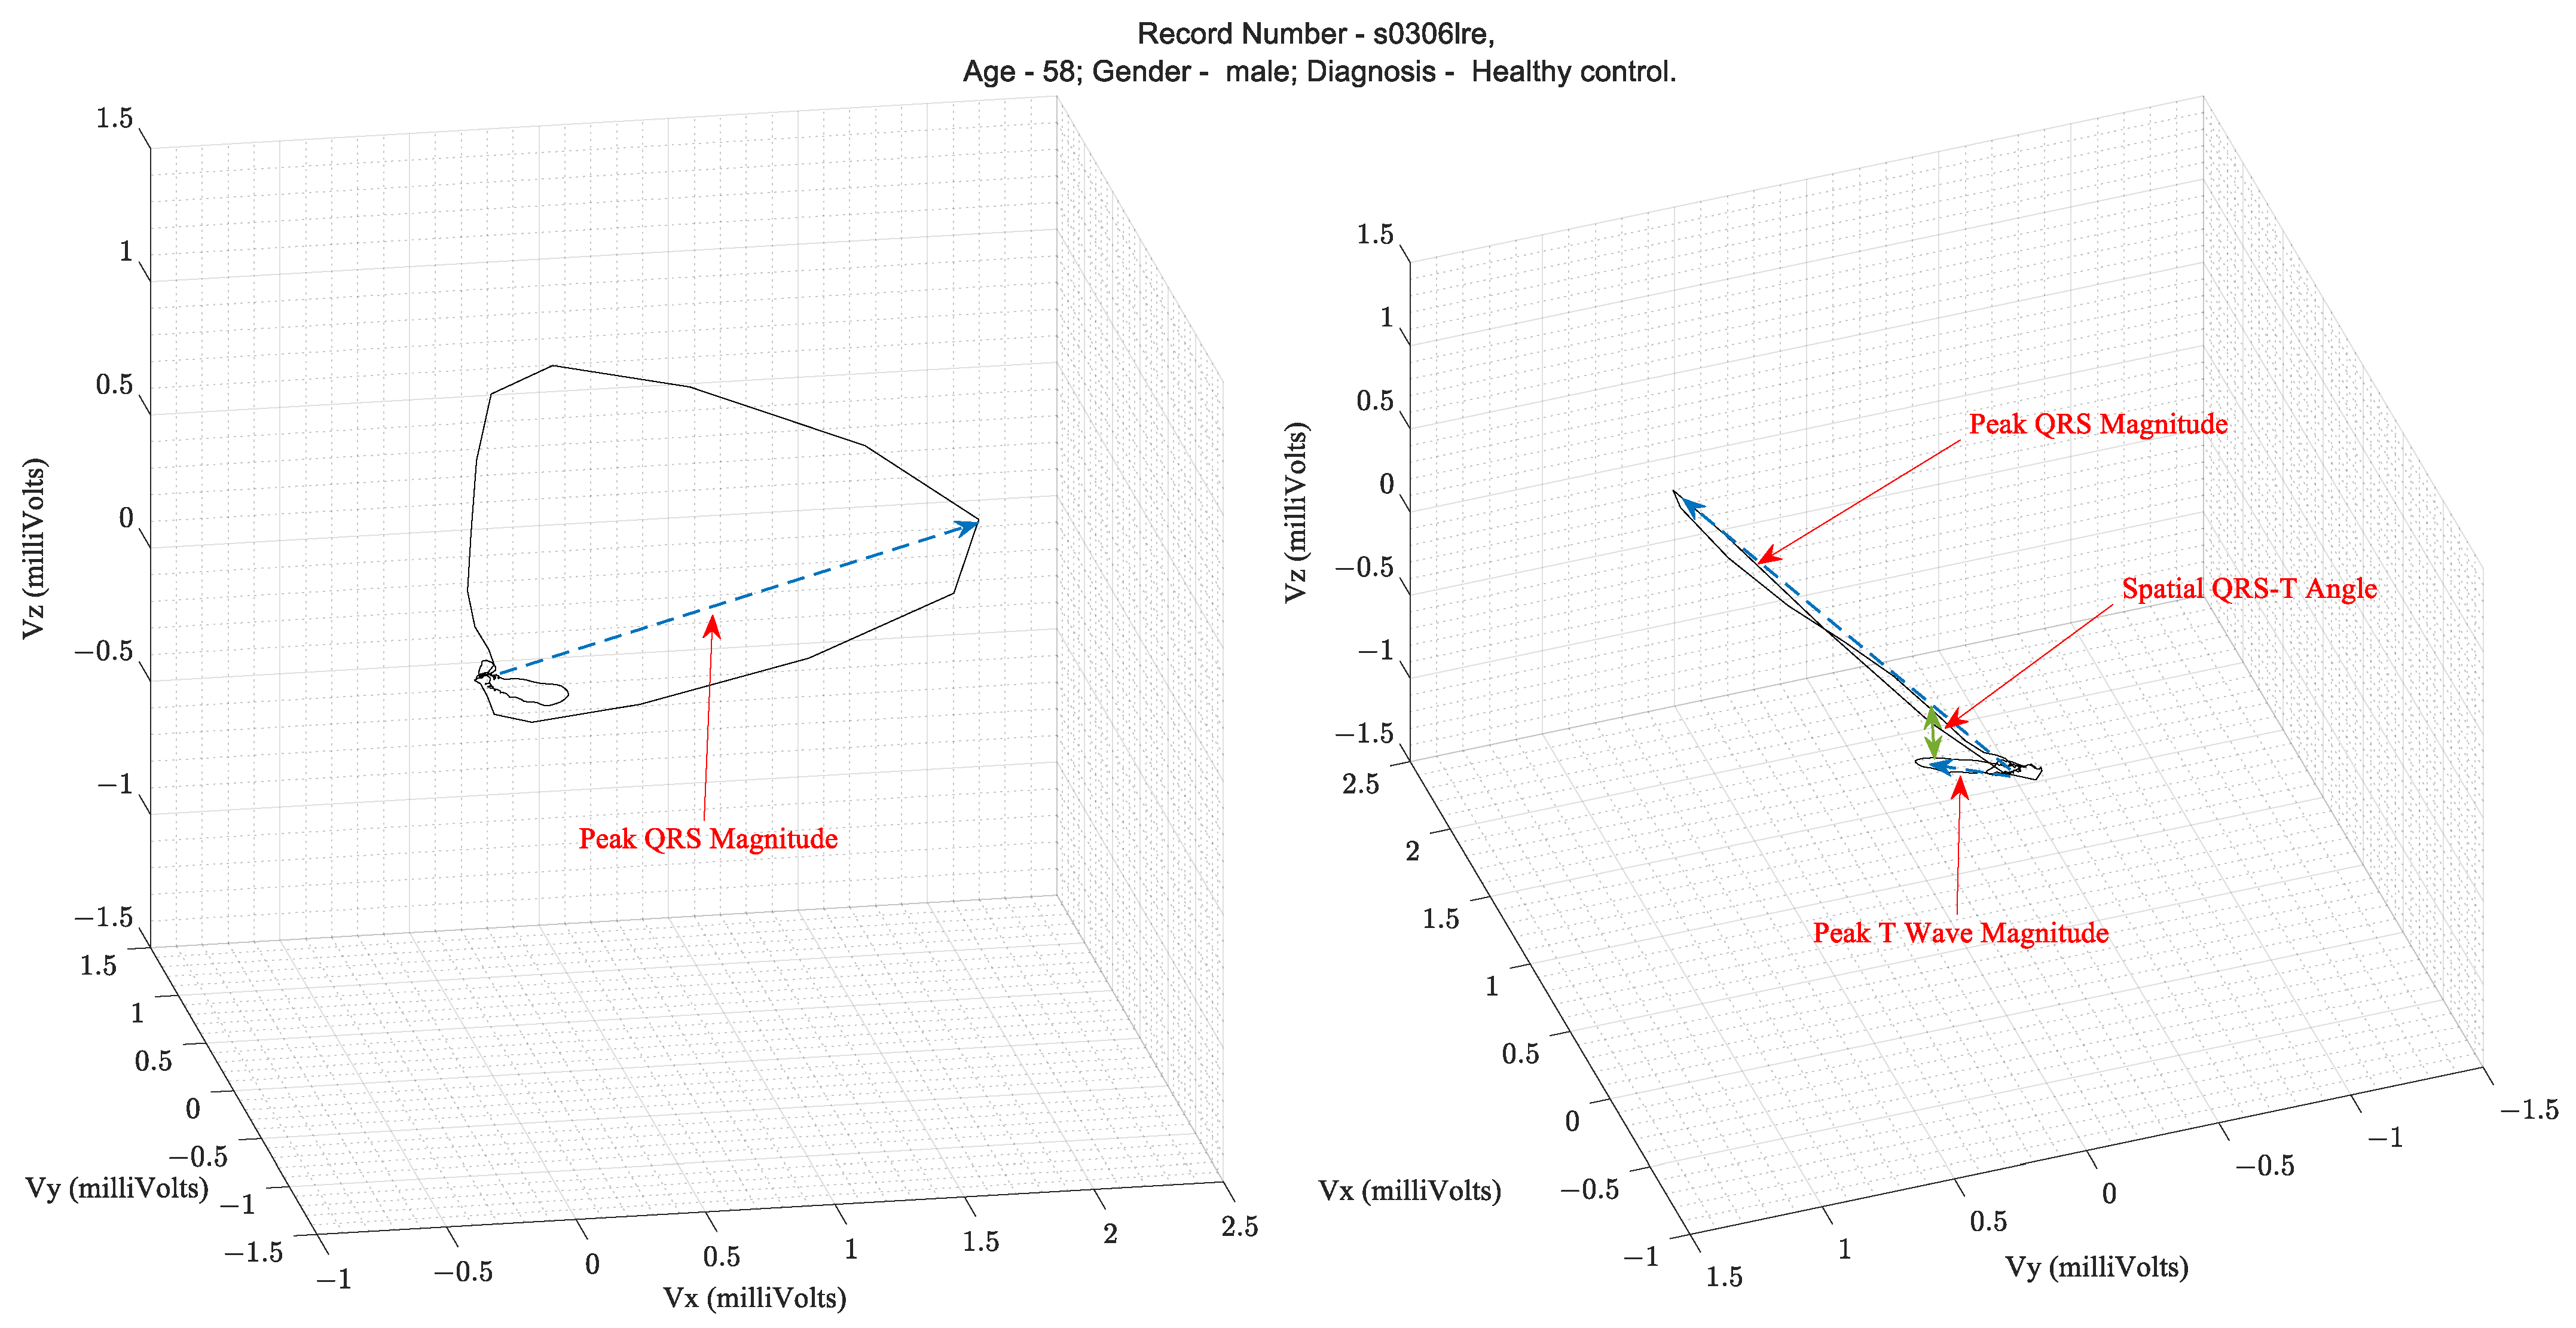
Table 1 lists the clinical applications of these parameters that have been validated in the literature. The spatial QRS-T angle parameter has been shown to be useful for risk stratification for cardiac events, evaluation of incident coronary disease and heart failure, and efficacy of therapy for adult hypertension and diabetes mellitus [5]. For example, in the PTB diagnostic database [3,4][3][4] ECG used in this study, the mean and standard deviation of the Spatial QRS-T angles from patients with MI and healthy controls were 87.9° ± 46.84° and 52.95° ± 35.76°, respectively, as computed using the VCG parameter extraction algorithms described herein.
Table 1.
Diagnostic parameters of interest computed from Vectorcardiograms.
| VCG Signal Feature | Clinical Application |
|---|---|
| QRS magnitude | Predicts ventricular arrhythmia in selected cohorts |
| T magnitude | Lower values are associated with an increased risk of cardiac events |
| Spatial QRS-T angle | In addition to assisting with risk stratification for cardiac events, the angle is also useful for the evaluation of
|
Additionally, there are specific conditions where the VCG is considered superior to the ECG. VCG is more sensitive and specific than ECG in detecting atrial and ventricular enlargements. Due to the greater spatially localized information in a VCG, the suspicion of electrically inactive areas in the septal or anteroseptal walls of the left ventricle can be assessed with a VCG. The left ventricular mass, which is currently assessed with an echocardiogram, can be assessed with a VCG. VCG findings are better correlated to echocardiography findings than ECG findings. VCG has a greater diagnostic sensitivity than ECG for AMI when associated with a left anterior fascicular block [6]. Lastly, the myocardial damage caused by Chagas disease can be assessed with VCG findings complementing ECG findings [7]. Figure 4 illustrates the conditions and the location of the affected heart anatomy.
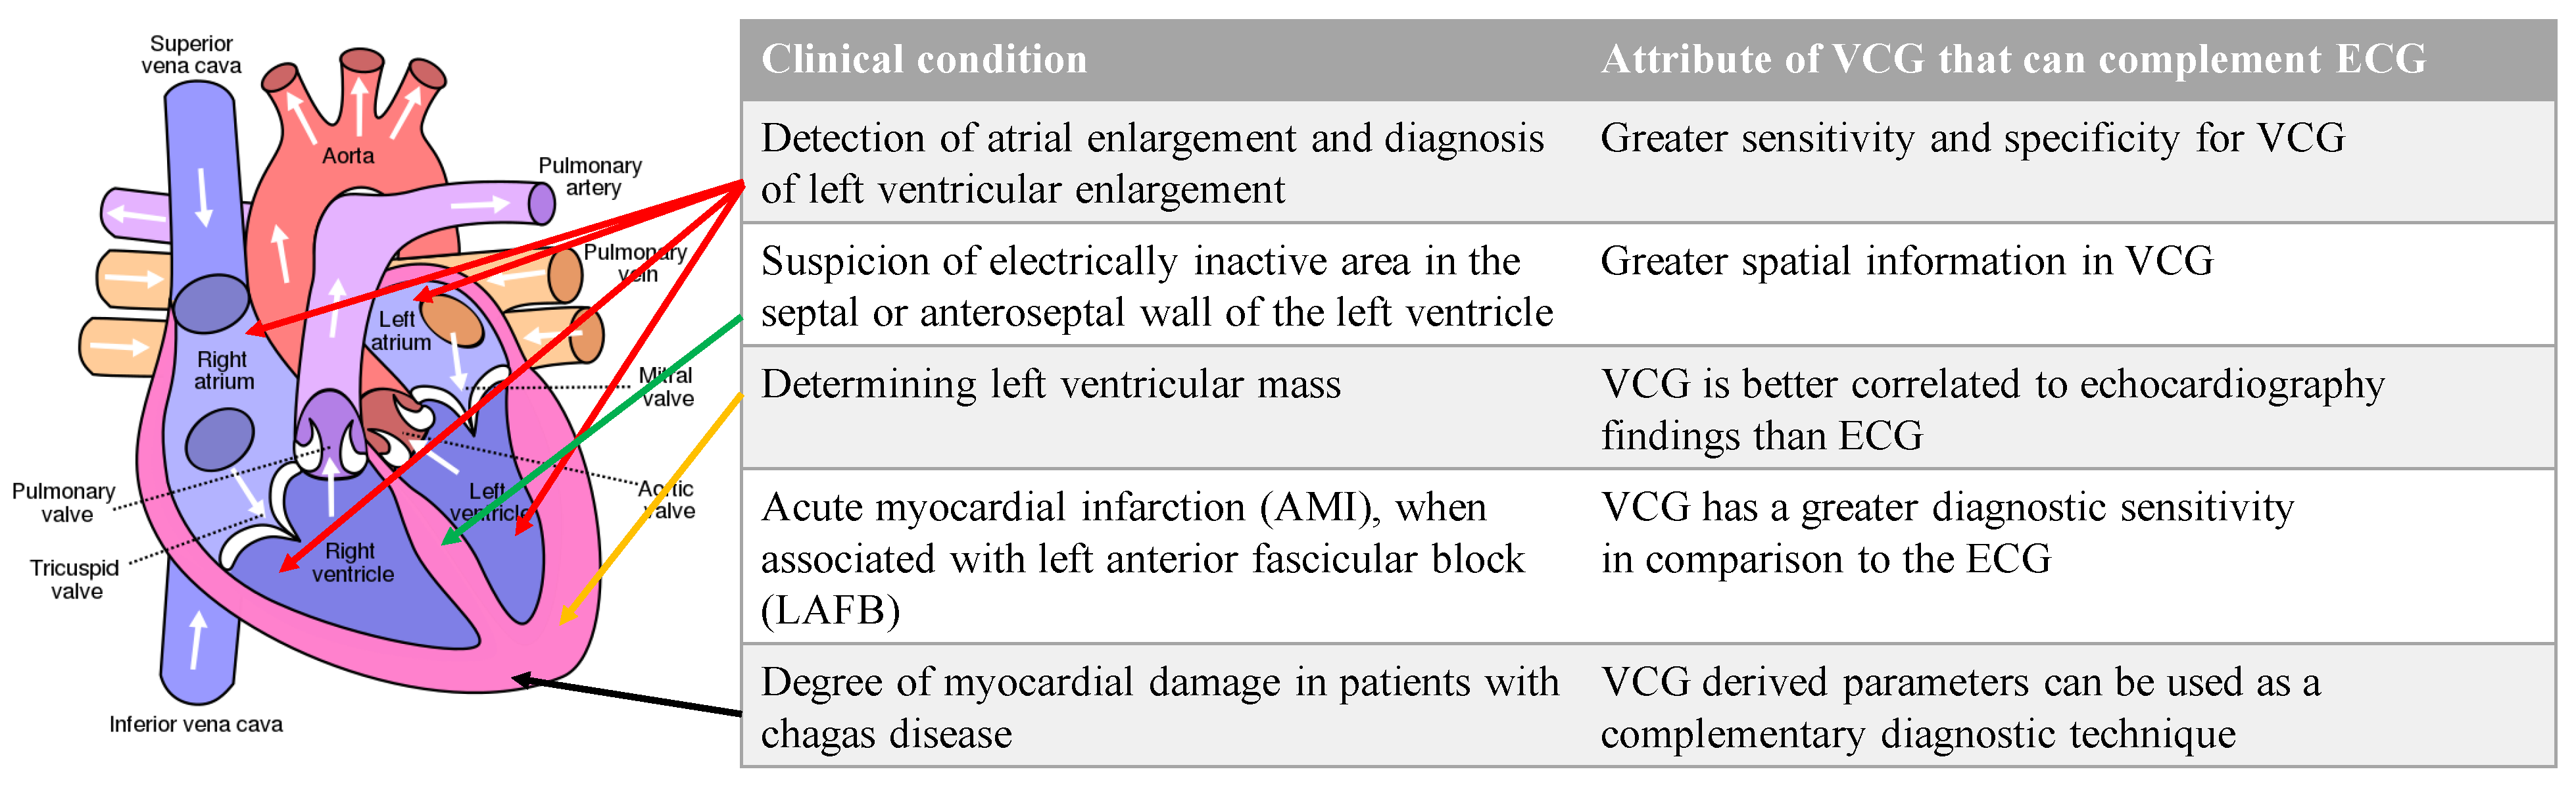
Figure 4. List of conditions where VCG is more effective than ECG for diagnosis and the corresponding anatomic location of the affected region of the heart. Authored by Wapcaplet and shared under Creative Commons (CC BY-NC-SA 3.0). The white arrows indicate the direction of blood flow.
Since VCGs are not acquired during regular clinical settings, but standard 12-lead waveforms are acquired, there is a need to derive VCG from the 12-lead ECG. Specifically, an arbitrarily complex transformation mapping the 12-lead ECG to the VCG is needed. Several research efforts are focused on arriving at the linear transformation of ECGs from standard 12-lead to Frank XYZ.
3. Related Work
Linear regression has been explored in the literature for lead transformation. Some studies have used open, publicly available data sets, whereas others have used closed data sets or data sets acquired with custom built hardware devices. Between 1986 and 2009, the lead transformation of interest was from S12 to Frank XYZ. Closed data sets were used for some studies [13,14,15,16][8][9][10][11] and open for others [17,18][12][13]. A neural network-based transformation was first proposed in 2010 [19][14]. Table 2 summarizes the works in the literature that focused on obtaining Frank XYZ from S12. Since then, several efforts have been made in reducing leads required to be monitored while retaining the diagnostic power of S12. Most of the studies have tried to derive S12 from a three-lead ECG [12,19,20,21,22,23,24][14][15][16][17][18][19][20].Table 2. List of related works that evaluated lead transformations from S12 to Frank XYZ. (𝑁 is the number of samples per ECG channel, 𝑦 is the actual acquired ECG, and 𝑦 ̂ is the output ECG from the transformation).
| Publication | Data Availability/Transformation Method | Reported Performance Metrics |
|---|---|---|
| Bjerle P et al., 1986 [11][21] | closed/Linear regression | Amplitudes of ECG waves QRS, ST and T |
| Edenbrandt L et al., 1988 [12][15] | Amplitude of R wave | |
| Kors J. A et al., 1990 [13][8] | ||
| Hyttinen J et al., 1995 [14][9] | ||
| Guillem MS et al., 2006 [15][10] | open/Linear Regression | ; |
| Dawson D et al., 2009 [16][11] | ||
| This work | PTB diagnostic ECG [3,4][3][4]. Open/LSTM | RMS error; Correlation coefficient, R2, QRS magnitude, T magnitude, and Spatial QRS-T angle |
References
- Frank, E. An Accurate, Clinically Practical System for Spatial Vectorcardiography. Circulation 1956, 13, 737–749.
- Yang, H.; Bukkapatnam, S.T.S.; Komanduri, R. Spatiotemporal representation of cardiac vectorcardiogram (VCG) signals. BioMed. Eng. OnLine 2012, 11, 16.
- Bousseljot, R.; Kreiseler, D.; Schnabel, A. Nutzung der EKG-Signaldatenbank CARDIODAT der PTB über das Internet. Biomed. Tech. Biomed. Eng. 1995, 40, 317–318.
- Goldberger, A.L.; Amaral, L.A.; Glass, L.; Hausdorff, J.M.; Ivanov, P.C.; Mark, R.G.; Mietus, J.E.; Moody, G.B.; Peng, C.K.; Stanley, H.E. PhysioBank, PhysioToolkit, and PhysioNet: Components of a new research resource for complex physiologic signals. Circulation 2000, 101, E215–E220.
- Chaudhry, U.; Cortez, D.; Platonov, P.G.; Carlson, J.; Borgquist, R. Vectorcardiography Findings Are Associated with Recurrent Ventricular Arrhythmias and Mortality in Patients with Heart Failure Treated with Implantable Cardioverter-Defibrillator Device. Cardiology 2020, 145, 784–794.
- Pérez Riera, A.R.; Uchida, A.H.; Filho, C.F.; Meneghini, A.; Ferreira, C.; Schapacknik, E.; Dubner, S.; Moffa, P. Significance of Vectorcardiogram in the Cardiological Diagnosis of the 21st Century. Clin. Cardiol. 2007, 30, 319–323.
- Correa, R.; Laciar, E.; Arini, P.; Jané, R. Analysis of QRS loop in the Vectorcardiogram of patients with Chagas’ disease. In Proceedings of the 2010 Annual International Conference of the IEEE Engineering in Medicine and Biology, Buenos Aires, Argentina, 31 August–4 September 2010; pp. 2561–2564.
- Bjerle, P.; Arvedson, O. Comparison of Frank vectorcardiogram with two different vectorcardiograms derived from conventional ECG-leads. Proc. Eng. Found 1986, 11, 13–26.
- Edenbrandt, L.; Pahlm, O. Vectorcardiogram synthesized from a 12-lead ECG: Superiority of the inverse Dower matrix. J. Electrocardiol. 1988, 21, 361–367.
- Kors, J.A.; van Herpen, G.; Sittig, A.C.; van Bemmel, J.H. Reconstruction of the Frank vectorcardiogram from standard electrocardiographic leads: Diagnostic comparison of different methods. Eur. Heart J. 1990, 11, 1083–1092.
- Hyttinen, J.A.; Viik, J.J.; Eskola, H.; Malmivuo, J.A. Optimization and comparison of derived Frank VECG lead systems employing an accurate thorax model. In Proceedings of the Computers in Cardiology 1995, Vienna, Austria, 10–13 September 1995; pp. 385–388.
- Guillem, M.S.; Sahakian, A.V.; Swiryn, S. Derivation of orthogonal leads from the 12-lead ECG. accuracy of a single transform for the derivation of atrial and ventricular waves. In Proceedings of 2006 Computers in Cardiology, Valencia, Spain, 17–20 September 2006; pp. 249–252.
- Dawson, D.; Yang, H.; Malshe, M.; Bukkapatnam, S.T.S.; Benjamin, B.; Komanduri, R. Linear affine transformations between 3-lead (Frank XYZ leads) vectorcardiogram and 12-lead electrocardiogram signals. J. Electrocardiol. 2009, 42, 622–630.
- Atoui, H.; Fayn, J.; Rubel, P. A Novel Neural-Network Model for Deriving Standard 12-Lead ECGs From Serial Three-Lead ECGs: Application to Self-Care. IEEE Trans. Inf. Technol. Biomed. 2010, 14, 883–890.
- Sohn, J.; Yang, S.; Lee, J.; Ku, Y.; Kim, H.C. Reconstruction of 12-Lead Electrocardiogram from a Three-Lead Patch-Type Device Using a LSTM Network. Sensors 2020, 20, 3278.
- Tomasic, I.; Trobec, R.; Lindén, M. Can the Regression Trees Be Used to Model Relation Between ECG Leads? In Proceedings of the Internet of Things, Rome, Italy, 27–29 October 2015; IoT Infrastructures: Rome, Italy, 2015; pp. 467–472.
- Trobec, R.; Tomašić, I. Synthesis of the 12-Lead Electrocardiogram From Differential Leads. IEEE Trans. Inf. Technol. Biomed. 2011, 15, 615–621.
- Zhu, H.; Pan, Y.; Cheng, K.-T.; Huan, R. A lightweight piecewise linear synthesis method for standard 12-lead ECG signals based on adaptive region segmentation. PLoS ONE 2018, 13, e0206170.
- Zhang, Q.; Frick, K. All-ECG: A Least-number of Leads ECG Monitor for Standard 12-lead ECG Tracking during Motion*. In Proceedings of the 2019 IEEE Healthcare Innovations and Point of Care Technologies, (HI-POCT), Bethesda, MD, USA, 20–22 November 2019; pp. 103–106.
- Lee, D.; Kwon, H.; Lee, H.; Seo, C.; Park, K. Optimal Lead Position in Patch-Type Monitoring Sensors for Reconstructing 12-Lead ECG Signals with Universal Transformation Coefficient. Sensors 2020, 20, 963.
- Hochreiter, S.; Schmidhuber, J. Long Short-Term Memory. Neural Comput. 1997, 9, 1735–1780.
More