Your browser does not fully support modern features. Please upgrade for a smoother experience.
Please note this is a comparison between Version 1 by Wenhui Li and Version 3 by Jessie Wu.
Organophosphate esters (OPEs) are increasingly used as flame retardants and plasticizers in various products. Most of them are physically mixed rather than chemical bonded to the polymeric products, leading to OPEs being readily released into the surrounding environment. Due to their relatively high solubility and mobility, OPEs are ubiquitous in the aquatic environment and may pose potential hazards to human health and aquatic organisms.
- organophosphate esters
- aquatic environment
- distribution characteristics
- aquatic organisms
1. Water
As for mammals, organophosphate esters (OPEs) were detected in dolphins, seals, and polar bears. Aznar-Alemany et al. [1][103] investigated the concentrations of OPEs in the muscles of Indian Ocean dolphins. The mean concentration of OPEs was 10,452 ± 11,301 ng/g lw, with TBOEP accounting for 82 ± 28% of the total OPE contamination. Sala et al. (2019) reported OPEs in the dolphin samples from the Alboran Sea [2][104]. The concentrations of OPEs in the muscle tissue varied from 70 to 2939 ng/g lw, and were one order of magnitude lower than those detected in the Indian Ocean [1][103]. According to Sutton et al. (2019), four types of OPEs were detected in harbor seal blubber: TDCPP (nd-56 ng/g lw), TCPP (nd-30 ng/g lw), TCEP (nd-8.3 ng/g lw), and TPhP (nd-27 ng/g lw) [3][63]. Letche et al. [4][105] collected tissue samples from the polar bears of various Hudson Bay subpopulations. Only TEHP could be quantified in the samples despite the presence of several types of OPEs, indicating limited intake and absorption due to the rapid metabolism in polar bears.
As some OPEs have a relatively large logKow through bioaccumulation, they can be transferred from low trophic organisms to high trophic organisms through the food web [3][5][6][63,107,108]. The survival and reproduction of organisms may be threatened by the toxicity of OPEs, which mainly manifests as growth inhibition [2][7][8][89,104,109], developmental delay [9][10][110,111], reproduction toxicity [11][13], neurotoxicity toxicity [12], and apoptosis [13][15].
2. Surface Water (Rivers, Lakes, and Coastal Seawater)
The concentrations of OPEs in rivers and lakes range widely, depending on local industrial distribution and human activities, especially in the manufacturing and construction industry [14][15][42,68]. OPEs are usually observed near urban and industrial areas [16][17][59,65]. For example, Lian et al. (2022) studied the Zijiang River, which has large mining operations occurring in its downstream [18][51]. The results showed that TCEP, TCPP, TEP, TNBP, and TBOEP were detected in almost all samples, with TNBP and TBOEP accounting for 14.2% and 9.3% of the OPEs, respectively. TNBP and TBOEP are widely used in hydraulic fluids and lubricants, which may be released into the surrounding environment during mining. Human activity is a main factor in causing the different spatial distribution of OPEs [19][54]. Zhang et al. (2018) used GC-MS to study eight OPEs of urban and rural surface water samples [20][55]. The concentrations of the OPEs detected in urban rivers (340–1688.7 ng/L) were higher than those in rural rivers (185.4–321 ng/L). The concentrations of three Cl-OPEs in urban surface water were significantly higher than those in rural surface water, indicating that there may be more potential pollution sources in urban areas. The amount and type of OPEs in surface water also reflects the industrial development level between urban and rural areas [17][20][55,65].
Significant differences in the level of OPEs were found in different seasons [21][22][23][56,57,62]. Chen et al. (2019) sampled seawater and sediments in northwestern Bohai Bay from 2014 to 2017, and detected the concentrations of 12 OPEs using GC-MS/MS [24][69]. The concentration of TEP in summer was the highest among the three seasons investigated, which may be caused by the high temperature and frequent rainfall in Tianjin in the summer. High temperature may lead to the release of OPEs from the materials, and the wet deposition utilizes the atmosphere to migrate OPEs from the air to the aquatic system. Among the OPEs studied, TEP has the highest water solubility among all the investigated OPEs, so it is more readily soluble in water. However, for TCEP and TBOEP, the trend is the complete opposite. The concentrations of TCEP and TBOEP were the lowest in summer, and this difference may be related to the physical and chemical characteristics of OPEs. Besides the impact of high temperature [24][25][69,70], floods can also affect the level of OPEs in rivers. Increased discharge during floods reduces the levels of OPEs in water and results in a relatively uniform distribution throughout the river [26][19].
The coastal environment is an important sink of OPEs [15][68]. The release of OPEs from the inland is accompanied by the flow of rivers into the sea. At the same time, the pollution from intensive fishery activities, aquaculture wastewater discharge, and even some ports and tourism activities, all lead to great environmental stress [27][58]. The Bohai Sea, Yellow Sea, and East China Sea are important marginal sea areas for China. According to Zhong et al. (2020), Qi at al. (2021), and Lin et al. (2022), high concentrations of OPEs were detected in the Bohai Sea and the Yellow Sea. The total concentration of OPEs in the Bohai Sea (10.9–516.4 ng/L) was the highest, followed by the Yellow Sea (12.7–202.6 ng/L) and then the East China Sea [28][29][30][53,71,72], which was attributed to there being more pollution sources and poor seawater exchange around the Bohai Sea. Due to a low boiling point and semi-volatility, the OPEs in coastal seawater can be deposited into sediments and be volatilized into the atmosphere [31][73]. The long-distance migration of the atmosphere and ocean currents transport OPEs from industrialized regions to the sea [32][33][74,75]. Na et al. (2020) demonstrated the long-distance migration ability of OPEs [34][76]. Ten OPEs were found in seawater samples from the northwestern Pacific and the Arctic, with the concentration varying from 8.5 to 143 ng/L. Xiao et al. (2021) collected surface seawater from the West Pacific Ocean [35][60]. The total concentration of OPEs was 3.02–48.4 ng/L, which were comparable with those in the surface water of the largest High Arctic lake (mean: 12.9 ng/L) [36][77]. In addition, Li et al. (2017) revealed there were OPEs (0.3–8.4 ng/L, mean: 2.9 ng/L) in the seawater of the northeast Atlantic and the Arctic Ocean [32][74]. Compared with the open sea, the concentrations of OPEs in coastal waters were higher [37][64].
Previous studies have shown that some OPEs can accumulate in sediments and persist in aquatic environments [3][16][24][28][38][39][40][41][18,50,52,53,59,63,67,69]. OPEs may even produce more toxic transformation products through biotransformation, photodegradation, or hydrolysis. Rivers are the main vehicle for transporting and mobilizing OPEs from the mainland to the coastal marine environment. Monitoring and controlling the concentration of pollutants in rivers and lakes can effectively prevent marine pollution.
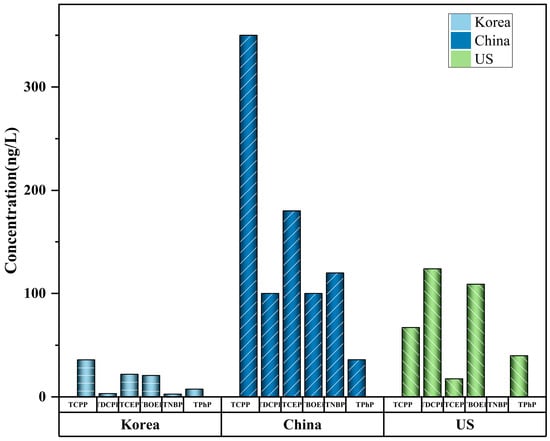
The mean values or range (min–max) are shown. Tap water is the cheapest and most common drinking water in cities and contains abundant OPEs [55][91]. Tap water is frequently obtained from rivers and lakes near urban areas [56][92], and the levels of OPEs in treated tap water are usually significantly lower than those in rivers or lakes (Figure 1). This is due to the purification of OPEs in water sources by drinking water treatment plants (DWTP) [21][56]. Park et al. [54][90] used GC-MS to detect the level of OPEs (total concentrations 74–342 ng/L) in the tap water of Korean cities. TnBP, TCEP, TCPP, and TBOEP were detected in all samples. Li et al. [52][87] proposed that OPEs are widely distributed in tap water, and that the level of OPEs varies greatly in different cities. The total concentration of halogenated OPEs is 3.1–207 ng/L (mean: 50.3), accounting for 65% (mean) of the total OPEs. The potential risks posed by tap water to human beings vary depending on the raw water source and treatment process used. Compared with conventional drinking water treatment technology (DWTT), advanced DWTT can reduce the concentration of OPEs by about 47.8%, indicating that DWTT plays a significant role in the purification of OPEs and is a key factor affecting the OPEs level of drinking water. Choo et al. (2020) further compared the removal efficiency of OPEs between traditional and advanced DWTP [50][85]. The results show that advanced treatment processes such as ozonation and granular-activated carbon filtration are more efficient in removing most OPEs. For example, the average removal rates of the two Cl-OPEs were negative for conventional DWTP (TCEP: −87%, TCPP: −41%) and positive for advanced DWTP filtration that uses granular-activated carbon (TCEP: 46%, TCPP: 49%). This shows that upgrading the DWTT capabilities of water plants is a successful strategy through which to lessen the threat that OPEs pose to tap-water safety.
 Some studies have shown that OPEs were observed in barreled water and bottled water. Liang et al. (2022) found that the OPE contaminations of bottled water (<MDL-180 ng/L) and barreled water (11–100 ng/L) were much lower than those of tap water (3.1–940 ng/L) and river water (25–840 ng/L) [46][81]. The level of OPEs in bottled water was comparable to those in Korea (median: 104 ng/L) (Lee et al., 2016) [49][84]. The level of OPEs in tap water were higher than those in bottled water, which may be caused by the widespread use of PVC pipes carrying residual OPEs. The pollution of OPEs in bottled and barreled water may be caused by many reasons: the water source, packaging materials, purification process, etc. Lao et al. (2022) pointed out that OPEs could potentially leak out of plastic containers. [57][93]. OPEs will leak out more from plastic containers into barreled and bottled water during long-term and high-temperature storage. For this reason, short-time storage and maintaining room temperature are essential to avoid the leaching of OPEs. At the same time, the use of clean water from natural reserves and advanced purification technology in the manufacturing process is a feasible approach through which to reduce the pollution of bottled water.
The concentration of OPEs in drinking water is significantly affected by the economic development and population density of different regions [52][87]. Zhang et al. (2021) determined that OPEs in drinking water showed a downward trend from coastal cities (mean: 154 ng/L) to inland cities (mean: 119 ng/L) [58][94]. The highest ΣOPE concentrations of the tap water in Korea were found from large-scale industrialized cities, such as Ulsan (mean 144 ng/L) and Ansan (mean 74.0 ng/L) [49][84]. However, the relatively lowest concentrations of OPEs were observed in several coastal cities with developed industries, such as Shanghai and Dalian. The use of advanced process treatment technologies may be the cause of these variations in the levels of OPEs
These data indicate that drinking water, which is generally considered to be relatively safe, was being polluted on a large scale. Overall, the mean concentration of OPEs in drinking water decreased in the following sequence: tap water > bottled water > barreled water. Nevertheless, studies on the pollution level of OPEs in drinking water are relatively limited. It is very important for human safety to upgrade the DWTT capabilities of water plants, and to also regularly monitor raw water sources in order to reduce the OPE pollution of drinking water.
Some studies have shown that OPEs were observed in barreled water and bottled water. Liang et al. (2022) found that the OPE contaminations of bottled water (<MDL-180 ng/L) and barreled water (11–100 ng/L) were much lower than those of tap water (3.1–940 ng/L) and river water (25–840 ng/L) [46][81]. The level of OPEs in bottled water was comparable to those in Korea (median: 104 ng/L) (Lee et al., 2016) [49][84]. The level of OPEs in tap water were higher than those in bottled water, which may be caused by the widespread use of PVC pipes carrying residual OPEs. The pollution of OPEs in bottled and barreled water may be caused by many reasons: the water source, packaging materials, purification process, etc. Lao et al. (2022) pointed out that OPEs could potentially leak out of plastic containers. [57][93]. OPEs will leak out more from plastic containers into barreled and bottled water during long-term and high-temperature storage. For this reason, short-time storage and maintaining room temperature are essential to avoid the leaching of OPEs. At the same time, the use of clean water from natural reserves and advanced purification technology in the manufacturing process is a feasible approach through which to reduce the pollution of bottled water.
The concentration of OPEs in drinking water is significantly affected by the economic development and population density of different regions [52][87]. Zhang et al. (2021) determined that OPEs in drinking water showed a downward trend from coastal cities (mean: 154 ng/L) to inland cities (mean: 119 ng/L) [58][94]. The highest ΣOPE concentrations of the tap water in Korea were found from large-scale industrialized cities, such as Ulsan (mean 144 ng/L) and Ansan (mean 74.0 ng/L) [49][84]. However, the relatively lowest concentrations of OPEs were observed in several coastal cities with developed industries, such as Shanghai and Dalian. The use of advanced process treatment technologies may be the cause of these variations in the levels of OPEs
These data indicate that drinking water, which is generally considered to be relatively safe, was being polluted on a large scale. Overall, the mean concentration of OPEs in drinking water decreased in the following sequence: tap water > bottled water > barreled water. Nevertheless, studies on the pollution level of OPEs in drinking water are relatively limited. It is very important for human safety to upgrade the DWTT capabilities of water plants, and to also regularly monitor raw water sources in order to reduce the OPE pollution of drinking water.
The mean values or range (min–max) are shown. Generally, chlorinated OPEs were the main fraction of the total OPEs in biota samples [67][106]. The average relative abundance of chlorinated OPEs (34.7%−58.2%) was higher than those of aryl OPEs (4.06–32.2%) and alkyl OPEs (18.1–40.6%), which may be due to their higher bioaccumulation and lower biotransformation. These features make chlorinated OPEs more resistant to metabolism and more persistent in aquatic organisms than other OPE individuals [59][95].
Several studies have investigated OPEs in algae, invertebrate species, and fish from different regions. Fu et al. (2020) detected sixteen OPEs in six algae samples collected from Antarctica using LC-MS/MS [59][95]. TEP, TCEP, TCPP, TPhP, and TNBP were detected in more than 75% of the samples, with the total concentration of 1.60 ng/g dw. Bekele et al. [60][96] collected marine species from Laizhou Bay, North China. The results showed that the concentrations of 20 analyzed OPEs in organisms varied from 21 to 3510 ng/g lipid weight (lw). A total of 17 of 20 OPEs were detected in biota samples with the highest detection frequency of TCPP (85%), TiBP (80%), and TBEP (77%). The high detection frequencies were evidence of the extensive use and widespread contamination of OPEs in Laizhou Bay. Zheng et al. (2020) revealed the median concentration of ΣOPE was 4.97 ng/g wet weight (ww) in sentinel fish [61][97]. Castro et al. (2020) collected seven mussel samples from Galicia [62][98]. Then, 8 out of 18 OPEs were detected in these samples (total concentration LOQ-291 ng/g dry weight (dw)). Aznar-Alemany et al. [63][99] monitored the OPEs in the mussel from different European fish and shellfish farming sites. OPEs were found in all 17 samples with the concentrations ranging from 7 to 2005 ng/g lw. Choi et al. (2022) collected lake trout from five locations in the Great Lakes between 2001 and 2017 [64][100]. A total of 12 of 22 OPEs were detected above the MDLs, while only 3 of them (TEP, TCPP, and TBOEP) showed high detection frequencies (>50%). The total OPE concentration was 9–122 ng/g ww. Guo et al. (2017) studied lake trout and walleye samples from the Great Lakes basin (n = 3 for each lake) [65][101]. Of these, 6 out of 18 OPEs were detected in the fish samples (mean: 36.6 ng/g lw), and TNBP was detected in 47% (mean: 1.63 ng/g lw). TPhP, TCPP, TNBP, and TCEP were detected in more than 7 samples. Bekele et al. [66][102] analyzed ten fish species from Laizhou Bay, North China. Of these, 17 out of 20 OPEs were detected in the fish samples, with a total concentration ranging from 7 to 107 ng/g dw.
As for mammals, OPEs were detected in dolphins, seals, and polar bears. Aznar-Alemany et al. [1][103] investigated the concentrations of OPEs in the muscles of Indian Ocean dolphins. The mean concentration of OPEs was 10,452 ± 11,301 ng/g lw, with TBOEP accounting for 82 ± 28% of the total OPE contamination. Sala et al. (2019) reported OPEs in the dolphin samples from the Alboran Sea [2][104]. The concentrations of OPEs in the muscle tissue varied from 70 to 2939 ng/g lw, and were one order of magnitude lower than those detected in the Indian Ocean [1][103]. According to Sutton et al. (2019), four types of OPEs were detected in harbor seal blubber: TDCPP (nd-56 ng/g lw), TCPP (nd-30 ng/g lw), TCEP (nd-8.3 ng/g lw), and TPhP (nd-27 ng/g lw) [3][63]. Letche et al. [4][105] collected tissue samples from the polar bears of various Hudson Bay subpopulations. Only TEHP could be quantified in the samples despite the presence of several types of OPEs, indicating limited intake and absorption due to the rapid metabolism in polar bears.
These studies demonstrated the presence of the OPEs observed in aquatic organisms. As some OPEs have a relatively large logKow through bioaccumulation, they can be transferred from low trophic organisms to high trophic organisms through the food web [3][5][6][63,107,108]. The survival and reproduction of organisms may be threatened by the toxicity of OPEs, which mainly manifests as growth inhibition [2][7][8][89,104,109], developmental delay [9][10][110,111], reproduction toxicity [11][13], neurotoxicity toxicity [12], and apoptosis [13][15].
3. Drinking Water (Tap Water, Bottled Water, and Barreled Water)
Drinking water is regarded as one of the main ways for OPEs to come into contact with humans. In general, bottled water, tap water, and barreled water are the three common types of drinking water [42][78]. At present, plenty of studies on the fate of OPEs in drinking water have been carried out in China [21][43][44][45][46][47][20,56,79,80,81,82], Pakistan [48][83], South Korea [49][50][84,85], Canada [51][86], USA [37][52][64,87], and in other countries and regions [53][88]. The concentrations of OPEs in different types of drinking water are summarized in Table 1.Table 1.
Concentration of OPEs in several types of drinking water (ng/L).
| Location of Sampling | TCPP | TDCPP | TCEP | TBOEP | TNBP | TPhP | ΣOPE | Analysis Instrument | Year | Ref | |
|---|---|---|---|---|---|---|---|---|---|---|---|
| Nanjing, China |
Bottled water | 1.3–16.2 | ND | ND-48.8 | 19.5–81.7 | - | - | 165 | UPLC-MS/MS | 2014 | [44][79] |
| Eastern China | Well water | 1.3–3.8 | ND-1.1 | 0.1–3.5 | 0.01–0.6 | 0.1–0.4 | ND-0.5 | 4.5 | UPLC-MS/MS | 2015 | [45][80] |
| Barreled Water |
ND-48.5 | ND-7.0 | 0.2–44.2 | ND-0.3 | ND-1.6 | 0.05–0.9 | 27.6 | ||||
| Filtered drinking water | 1.6–26.5 | ND-6.6 | 1.9–48.5 | ND-5.3 | 0.2–6.6 | ND-1.8 | 59.2 | ||||
| Tap water | 21.5–109 | 5.4–6.8 | 28.5–139 | 1.4–6.6 | 3.9–76.3 | 0.3–4.0 | 192 | ||||
| Pakistan | Industrial zones |
0.03–85.7 | <MDL-21.4 | 0.09–31.2 | - | - | - | <MDL-71.1 | GC-MS | 2016 | [48][83] |
| Rural zones | <MDL-13.1 | <MDL-9.2 | <MDL-12.1 | - | - | - | <MDL-12.1 | ||||
| Background zones | <MDL | <MDL | <MDL-0.06 | - | - | - | <MDL-0.08 | ||||
| Korea | Tap water | 67.0 | - | 38.8 | 26.1 | 3.40 | - | 137.4 | GC-MS | 2016 | [49][84] |
| Purified water |
155 | - | 70.1 | 10.7 | 1.27 | - | 264.7 | ||||
| Bottled water | 79.6 | - | 25.3 | 35.6 | 4.29 | - | 53 | ||||
| The Pearl River Delta, China |
Bottled water | <MDL-170 | <MDL-1.9 | <MDL-3.1 | <MDL-2.2 | <MDL-4.5 | 0 | 34 | UPLC-MS/MS | 2022 | [46][81] |
| Barreled water | 9.8–100 | 65 | <MDL-1.6 | 94 | <MDL-0.6 | <MDL-14 | 24 | ||||
| Tap water | <MDL-350 | 100 | <MDL-180 | 100 | <MDL-120 | <MDL-36 | 72 | ||||
| Shanghai, China |
DWTP | 100.5–220.4 | 1.9–16.4 | 33.8–47.6 | <MDL-7.0 | 3.5–39.5 | <MDL-1.6 | 312.1 | UPLC-MS/MS | 2022 | [21][56] |
| Nakdong River, South Korea |
DWTP | 15–35.9 | 2.2–3.2 | 13.5–21.8 | 5.7–20.6 | 0.8–2.7 | 2.8–7.5 | 49.4–86.5 | GC-MS | 2020 | [50][85] |
| Nanjing, China |
Tap water | 78 | 41.4 | 207.6 | 6.7 | 27.7 | 179.7 | 719.8 | HPLC-MS/MS | 2022 | [22][57] |
| Xiangjiang River, China |
Tap water | 9 | - | 0.3 | - | 6.2 | 7.5 | 23.6 | GC-MS/MS | 2021 | [43][20] |
| New York State, US |
Tap water | <LOQ-67.1 | <LOQ-124 | <LOQ-17.4 | <LOQ-109 | - | <LOQ-39.9 | 41.6 | HPLC- MS/MS | 2018 | [37][64] |
| Hefei China |
Tap water | 15.8 | 2.2 | 15.5 | 0.5 | 1.1 | 1.3 | - | UPLC-MS | 2020 | [7][89] |
| Beijing, China |
Barreled Water | ND-6.3 | ND-2.2 | ND-8,2 | ND | ND-1.6 | ND-0.25 | 0.5–23.9 | UPLC-MS/MS | 2021 | [42][78] |
| Major metropolitan cities, Korea | Tap water | 49.4 | 2 | 39.5 | 43.9 | 11.8 | 23 | 169 | GC-MS | 2018 | [54][90] |
Note—MDL: the method detection limit; “-”: not measured; ND: not detected; LOD: limit of detection; and LOQ: the limit of quantitation.
Figure 1.
Max values of OPEs in tap water. Data are compiled from
Table 1
.
4. Aquatic Organisms
Aquatic environments are of great importance for protecting biodiversity and maintaining fishery resources. OPEs are mainly transported into remote areas through long-distance atmospheric deposition or ocean currents. Therefore, the potential effects of OPEs on freshwater and marine ecosystems must be given special consideration. The concentration of OPEs in different kinds of aquatic organisms are summarized in Table 2.Table 2.
Concentration of OPEs in several aquatic organisms (ng/L).
| Location | Species | Number of OPEs Analyzed | TCPP | TDCPP | TCEP | TBOEP | TNBP | TPhP | ΣOPE | Analysis Instrument | Year | Ref. |
|---|---|---|---|---|---|---|---|---|---|---|---|---|
| Antarctic | algae | 16 | 23.4 | ND | 25.5 | 1.33 | 9.7 | 2.6 | 88.3 (ng/g lw) | LC-MS/MS | 2020 | [59][95] |
| Laizhou Bay, China | fish and invertebrate | 20 | - | - | - | - | - | - | 21.1–3510 (ng/g lw) | GC-MS | 2019 | [60][96] |
| Alaska | sentinel fish | 24 | - | - | - | - | 5.5 | 0.1 | 5.95 (ng/g ww) | UPLC-QQQ MS | 2020 | [61][97] |
| Spain | mussels | 18 | 3.8–29.6 | ND | <LOQ | 5.6–12.4 | 0.9–9.4 | 23.6–623.6 | -(ng/g dw) | LC-MS/MS | 2020 | [62][98] |
| 7 European countries | mussel | - | - | - | - | - | - | - | 0.50–102 (ng/g dw) | LC-MS | 2018 | [63][99] |
| Great Lakes | lake trout | 22 | - | - | - | - | - | - | 9–122 (ng/g ww) | LC-MS/MS | 2022 | [64][100] |
| Great Lakes | fish | 18 | 6.7 | 9.6 | 13.3 | - | 1.6 | 17.1 | 36.6 (ng/g lw) | GC-MS | 2017 | [65][101] |
| Laizhou Bay, China | fish muscle | 20 | ND-6.1 | ND-2.5 | ND-5.8 | - | ND-13.1 | ND-8.4 | 6.6–107 (ng/g dw) | GC-MS | 2021 | [66][102] |
| Indian Ocean | dolphin | 14 | ND | ND | ND | 952–31,841 | ND-1333 | ND | 10,452 ± 11,301 (ng/g lw) | LC-MS/MS | 2019 | [1][103] |
| Alboran Sea, Spain | dolphin muscle | 16 | ND | - | 32.1 | 66.9 | 1309 | ND | 69.5–2939 (ng/g lw) | LC-MS | 2019 | [2][104] |
| US | harbor seal | 13 | ND-30 | ND-56 | ND-8.3 | <2.5 | <1.5 | ND-27 | 17–67 (ng/g lw) | LC-MS/MS | 2019 | [3][63] |
| Canada (in SHB/WHB) |
polar bear | 17 | - | - | - | - | - | - | 0.163/0.308 (ng/g lw) | UPLC-MS/MS | 2018 | [4][105] |
Note—“-”: not mentioned; ND: not measured; and LOQ: the limit of quantitation.