The reduction of the production cost and negative environmental impacts by pesticide application to control cotton diseases depends on the spatialization of infection patterns on the farm scale. Here, we evaluate the potential of three-band multispectral imagery from a multi-rotor UAV platform for the detection of Ramularia leaf blight from different flight heights in an experimental field. Increasing infection levels indicate the progressive degradation of the spectral vegetation signal, but were not sufficient to differentiate disease severity levels. At resolutions of ~5 cm (100 m) and ~15 cm (300 m) up to a ground spatial resolution of ~25 cm (500 m flight height), two-scaled infection levels can be detected for the best performing algorithm of four tested classifiers, with an overall accuracy of ~79% and a kappa index of ~0.51. Despite limited classification performance, the results show the potential interest of low-cost multispectral systems to monitor Ramularia blight in cotton.
- disease severity assessment
- ground cover
- UAV
- Ramularia areola
- remote sensing
- Introduction
Remote sensing has been proven to be a key technology in monitoring cotton (Gossypium hirsutum L.) crop yields [1][2], nutrient status [3,4], water stress [5,6] and diseases [7–11]. Up to now, the focus has been mainly put on the application of field spectroscopy at the canopy scale [8,12–16] and manned airborne systems [2,17] to support precision farming approaches. However, specific cotton-related orbital remote sensing studies are rare [18–20]. Most satellite-based approaches, including the identification of cotton crops, are broader land use and land cover studies or biomass estimates without the characterization of the physical, biological, or chemical conditions of the crop [21,22]. Furthermore, previous studies on remote pest detection mainly focused on cotton rot [17,23] or the identification of crop diseases on the leaf scale [24].
Ramularia leaf blight, also known as false or grey mildew, includes the fungus Ramularia areola Atk. as etiologic agent and is the most important foliar cotton disease. In Central-West Brazil, yield losses of ~20%–30% have been reported; such losses can exceed 70% without control measures in other production regions such as India [25]. Infection can cause boll abortion, malformation of bolls, and lower fiber quality. For effective control measures, up to nine fungicide applications may be necessary, which causes an increase in production costs and additional negative ecological impact of the culture on natural resources.
As a quickly emerging remote sensing technology, triggered by the advanced miniaturization of electronic devices (sensors, modems, processors, servos, batteries, etc.) [26], low-cost unmanned airborne vehicles (UAV) have been applied to fine-scale monitoring of the crop development, parameters of fertility and physical soil conditions, and precision farming and pest control [27–31]. The UAVs can be operated quickly and economically. They fly below the cloud layer and require little logistic resources and planning time if compared with photogrammetric aircraft campaigns. High spatial resolution imagery allows the examination of individual plants and sub-metric spatial patterns [32,33]. One of the most common classifications of UAV, besides their size and weight, is based on their flying principle. Rotor wing systems were found to be more flexible in operation, whereas fixed wing systems allow a quicker coverage of larger areas [34].
Crop diseases alter multispectral reflectance of plants at different damage levels. In the absence of visual symptoms such as leaf lesions, plants can react to the presence of a pathogen with a physiological mechanism such as the reduction of the photosynthesis rate [35], increasing reflection in visual wavelengths and decreasing near-infrared reflection. Despite of their potential [30], supported by results of non-imaging spectroscopy measurements of cotton plants [7], image classification of cotton leafs [36] and spectroscopic approaches in different scales for leaf diseases identification in different crops [37–39], peer-reviewed studies on the application of UAV for cotton disease monitoring are extremely scarce. In our review, no previous studies on the applicability of air- or spaceborne, multispectral remote sensing techniques for the detection of Ramularia blight could be identified.
Initially considered only a secondary phytosanitary problem and occurring only at final stages of the production cycle, highly productive cotton cultivars are now as well affected in initial stages. In conjunction with a possible increasing resistance against fungicides [40], an effective corrective measure can demand up to ten repetitive applications [25], turning the detection and mapping of Ramularia blight as early as possible imperative.
Here, we examine the performance of multispectral imagery from a low-cost, low-flight multi-rotor UAV platform for the differentiation of Ramularia infection levels in cotton on the farm scale. Furthermore, we evaluate how different flight heights affect the separability measures between infection classes to guide potential users in balancing between adequate spatial resolution and terrain coverage during UAV operation.
- Materials and Methods
2.1 Study area
Field data were obtained from a research field station of the Cotton Institute of Mato Grosso (IMAmt), in the Primavera municipality, in one of the most important cotton farming regions of the Neotropics in the Central Brazilian highlands (Planalto Central). It is located at ~54°11'46"W and 15°32'12"S, ~210 km east of the Mato Grosso state capital Cuiabá (Figure 1). The average annual temperature of the region is ~22°C and the rainfall precipitation is ~1650 mm with a rainy season between November and April and a dry season from May through October. As large parts of the crop farming regions of Central-Western Brazil, experimental sites are installed over Tertiarian sandstones on a gently rolling relief, where deep oxisols develop.
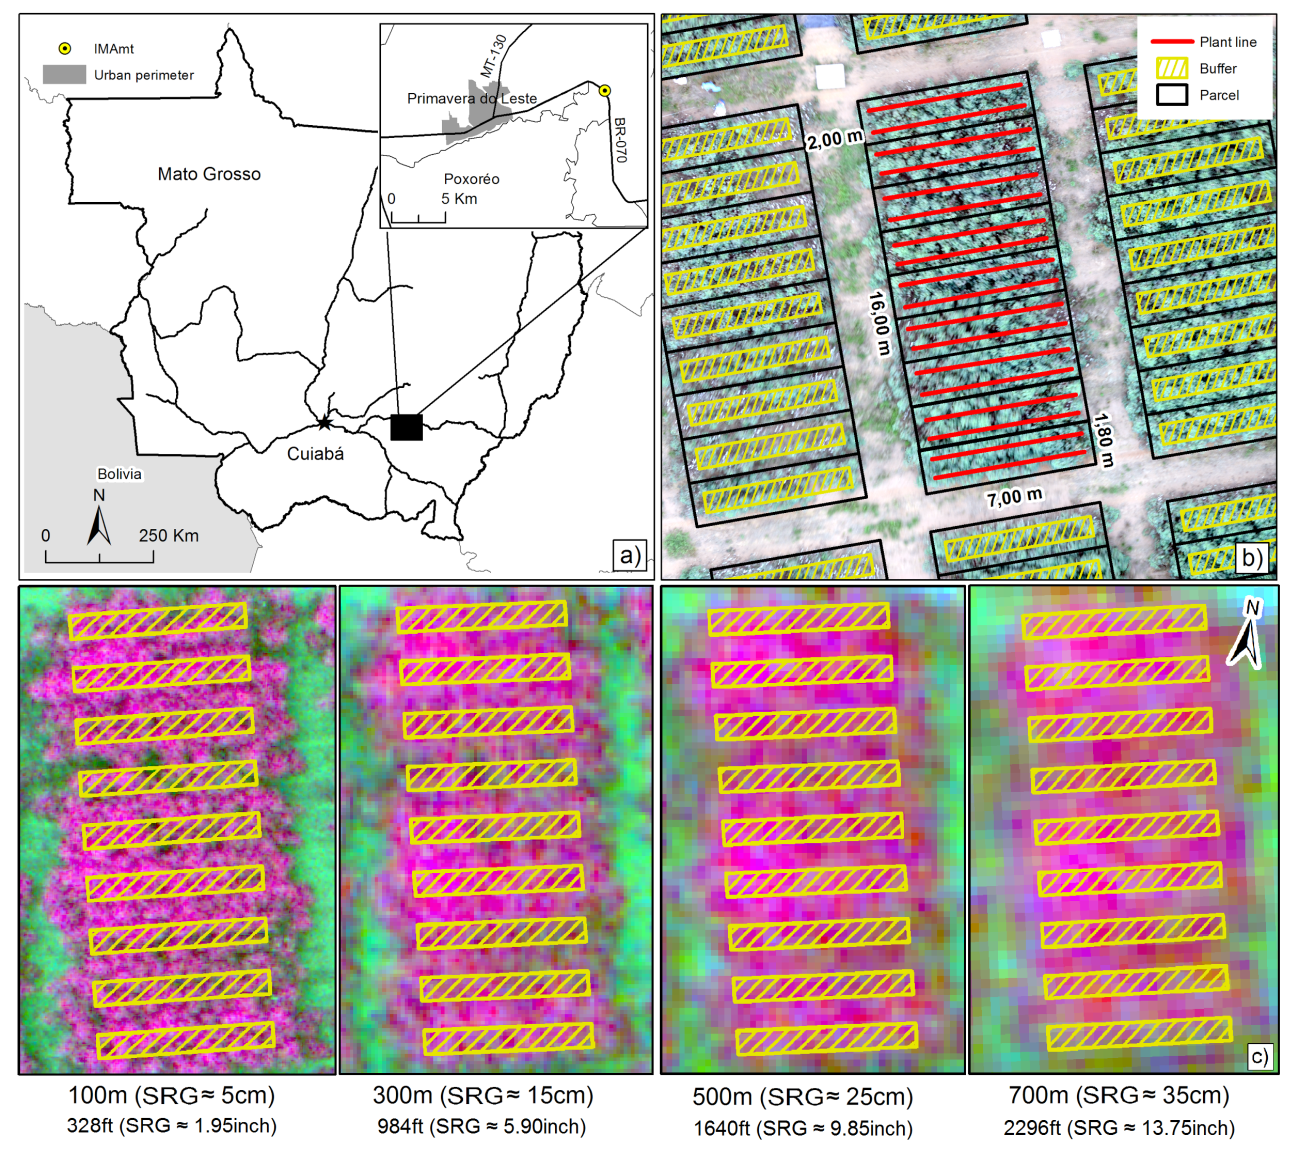
Figure 1. (a) Experimental test site of the IMAmt, (b) parcel structure with inner buffer and (c) plant lines in a SL camera true-color image and multispectral RGB-composites with inner buffers used for signature extraction as obtained from four flight heights with the value of spatial resolutions at ground (SRG) of each image.
2.2. UAV system, image acquisition, and data preprocessing
The UAV system we used is composed of a vertical takeoff and landing, eight-rotor Oktokopter, model MK Okto XL 6S12, HiSystems GmbH (Moormerland, Germany) and a lightweight (200g), multispectral TetraCam ADC camera of Tetracam, Inc. (Gainesville, FL, USA) with a 3.2 Megapixel CMOS sensor (2048 x 1536 pixels) and 8.0mm focal lens (Figure 2). The MK-Okto platform includes an ARM-processor equipped with a mainboard and a navigation mainboard (NaviCtrl) with compass and GPS modules.
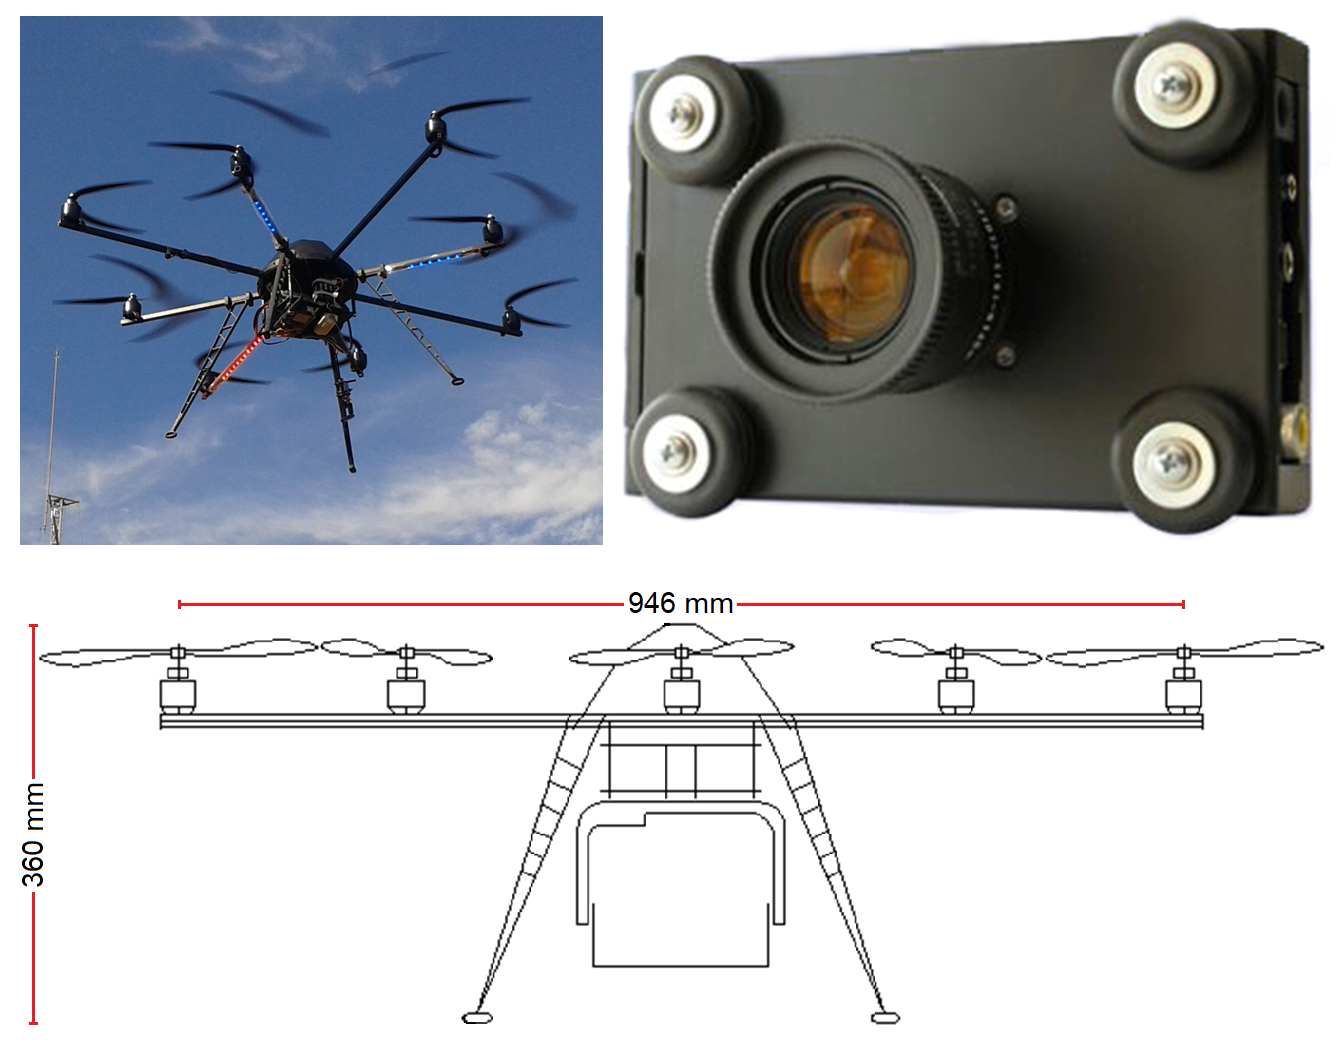
Figure 2. Eight-rotor Oktokopter, model MK Okto XL 6S12 and docked TetraCam ADC Lite multispectral camera.
The NaviCtrl in conjunction with a pressure sensor enables predefined autonomous flights. Lithium polymer battery with up to 6600 mAh capacity allowed flight durations of around 15 minutes. A standard 2.4 GHz transmitter remote control with additional channels for steering mechanisms and camera triggering was used for flight control. The ADC camera was mounted on a digital gimbal with biaxial roll and pitch control for flexible camera configurations.
The TetraCam ADC is sensitive in the spectral range between 520 nm and 920 nm and was operated with 8-bit data depth. The three available bands simulate the Landsat TM sensor bands 2, 3, and 4 (OLI sensor bands 3, 4, and 5) at wavelengths of 520–600 nm (green band), 630–690 nm (red band), and 760–900 nm (near-infrared band).
A waypoint-programmed vertical flight was realized on May 30, 2014, between approximately 2:00 and 3:00 pm local time under clear weather conditions, with the air temperature of 30.6 °C and relative humidity of 51%. The cotton crops at the experimental site were in the maturity stage. Images were acquired at four different flight heights: 100 m, 300 m, 500 m, and 700 m, with the nominal ground sample, distances spatial resolutions at ground (SRG) of ~5 cm, ~15 cm, ~25 cm, and ~35 cm, respectively. The preprocessing of the images accounted for vignetting and sensor-related radiometric distortions corrections and was carried out by the PixelWrench 2 software (Tetracam Inc.).
During the flights the Tetracam ADC was in automatic exposure mode, therefore the images were acquired with the following different integration times: 0.860 ms (at 100 m flight height), 0.946 ms (at 300 m flight height), and 1.032 ms (at 500 m and 700 m flight height). To minimize image distortions the UAV platform was programmed to remain stable for 30 sec at respective flight heights. To compare the digital counts (or grey levels) of the acquired images with different exposure times, we applied a time normalization to the data by dividing each image by its exposure time, where DCexp are the time-normalized data in DC/s (Digital counts per seconds), according to Equation 1:
 |
(1) |
where DC= is the digital count in a specific band x; a = is the flight height, and T' = is the image exposure time in seconds.
In addition to time normalization, radiometric normalization was required for the comparison because of weather conditions, solar illumination geometry, and atmospheric scattering and absorption variations differences for each flight height. For that purpose, we identified 26 semi-invariant radiometric sites in the scenes. The grey levels of a semi-invariant radiometric site are not supposed to change from scene to scene, except for differences in atmospheric scattering, absorption, relief, or illumination and viewing geometry conditions. We selected 26 bare soil sites to spread all over the study area and calculated their average digital count per second at each of the different flight heights. Using the 100 m flight height image as the reference, we calculated a radiometric normalization factor (fa), according to Equation 2:
 |
(2) |
where MED100= is the bare soil pixels average of the 100 m flight height image, and MEDa= is the average of the bare soil pixels at other flight heights.
When multiplying each of the images acquired at flight heights of 300 m, 500 m, and 700 m with the respective factors, we radiometrically normalized them to the image acquired at 100 m flight height. Therefore, the time and radiometrically normalized images in digital counts per seconds (DCnor) were obtained with Equation 3:
 |
(3) |
where = is the exposition time-corrected digital count value at a specific band and flight height, = is the flight height, and = is the atmospheric normalization factor.
2.3. The spatial arrangement of field experiment and assessment of Ramularia blight infection levels
The field experiment for assessment of Ramularia blight infection levels at IMAmt totalized an area of about 1.09 ha, subdivided in 78 plots, each with an extension of 16 m * 7 m, with management corridors of 2 m (Figure 1b). Plots were further divided in nine parcels of 7 m * 1.8 m, each including two plant lines of identical genotype (exact specifications were maintained under business confidentiality of IMAmt) and fertilizer and pesticide applications.
Single crop cotton genotypes, which result in the highest yields and quality, are seeded in Central Brazil at the end of October and yielded mostly in June or July. Infection commonly surges during advanced phenological development. Small angular leaf lesions of 3–4 cm surge in the initial phases of infection, whereas lesions become necrotic with severe chlorosis during advanced stages, causing premature leaves death. In general, infection is initiated in lower leaf layers at the leaf downside.
The technical staff of the IMAmt examined the cotton infection levels of Ramularia blight at the experimental site. Individual cotton plants were classified using a five-level key (Figure 3).
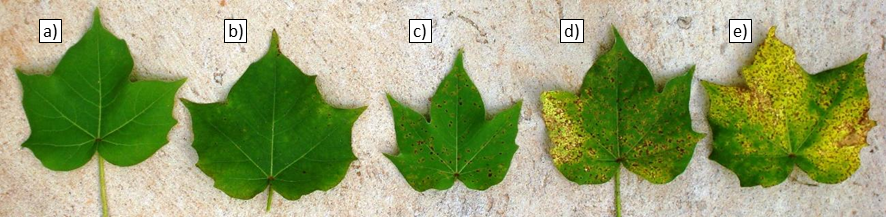
Figure 3. Classification key for the Ramularia blight infection severity of cotton leaves. For comparison with UAV imagery, individual plant classification was averaged, rounded by parcel, and labeled with the same key. (a) 0: without symptom; (b) 1: ≤5% of the leaf area infected, without incidences in the middle layer;(c) 2: 5%–25% of the leaf area infected, incidences in the middle layer; (d) 3: 25%–50% of the leaf area infected, incidences in the upper layer; and (e) 4: >50% of the leaf area infected, incidences in the upper layer, leaf loss.
For comparison with UAV imagery, individual plant classifications were then averaged by parcel. The average was rounded to the 5-level key. Infection levels were initially spatialized by vectorization of parcel limits over a real-color orthophoto mosaic taken during a previous low-altitude flight at 50 m using a photogrammetric pipeline based on bundle adjustment, which has been georeferenced by 20 control points installed at the test site. Because control point adjustment of multispectral imagery from the different flights achieved only an absolute spatial accuracy of 0.44m (RMS) on average, parcels had to be individually adjusted for every flight height to guarantee an accurate signature extraction over the linear parcels. To exclude mixed pixels and reduce neighborhood effects of adjacent pixels of the management corridors, only pixels from a 50cm inside buffer were considered in data analysis (Figure 1c). The number of extracted pixels for each inside buffer varied therefore between about 2500 at 100m flight height and about 50 at the 700m flight height. Pixels values were then averaged for each buffered parcel and spectral band, resulting in 154 instances for each flight height. This number is inferior to the number of originally planted parcels in the experiment, as some of the parcels were not entirely imaged in the 100m flight height and others had to be excluded from analysis due to incomplete crop development caused by waterlogging and soil degradation.
2.4. Data analysis
The distribution of class-wise DCnor values was tested for normality using the Kolmogorov–Smirnov test for every spectral band and flight height. The separability between DCnor cotton pixel values for each band from different flight heights and between DCnor values of Ramularia wilt infection classes for each band and flight height was evaluated by exploratory data analysis and, according to the normality tests, by the nonparametric, unpaired Mann–Whitney test (MWT). Adjacent remote sensing imagery pixels were autocorrelated [41] and cannot be considered as independent samples. To avoid the inflating of test statistics, we, therefore, averaged DCnor values by parcel to test group differences. Furthermore, multispectral classifications were conducted using four nonparametric classifiers as implemented in the WEKA data mining software [42]: (1) Multinomial logistic regression (MLR) [43], (2) Multinomial logistic regression with boosting (MLRb) [44], (3) Support Vector Machine (SVM) [45], and (4) Random Forest Tree (RFT). Here, we did not focus on the comparison of classifier performances but on the application of different algorithms to minimize the possibility that the obtained performance of infection level classification outcomes may be caused by specifications of a single classifier. The selected algorithms have been widely applied in remote sensing imagery classification [46–48] and are known to have different requirements with respect to the training data input and complexity of the parameter adjustment to achieve a sufficient generalization performance.
The MLR uses a linear predictor function and requires a relatively small number of training data to estimate the parameters necessary for classification. Furthermore, there is no need for predictors to be statistically independent of each other compared with, for example, the Bayes classifier [49]. The SVM techniques perform well in multispectral remote sensing classification, even with a modest amount of training data [46]. However, the SVM may be subjected to overfitting the dataset because it adjusts to nonlinear class predictor relations [50]. The other two approaches are more affected by overfitting of training data or demand higher amounts of training data, that is, MLRb because of underlying boosting [51] and RFT because it is an ensemble approach based on bootstrap aggregating (bagging) [52].
For classification and validation, the dataset (n=154) was spilled, two thirds for training and one third for validation. Overall accuracy and kappa index were then determined using a 10-fold cross-validation approach.
- Results
The empirical flight height normalization factors increased with flight heights in both bands of the visual spectrum (GREEN, RED), whereas they slightly decreased or remained almost stable in the near-infrared (NIR) range (Table 1). The modest 'Fa' increase in the visual bands and the slight reduction in the NIR are caused by higher sensor exposure times at higher flight heights, which reduce the DCnor estimates and thus compensate for increasing path radiance.
The DCnor values of extracted cotton pixels increased slightly in the GREEN and RED bands with flight height and decreased in the NIR.
Table 1. Spatial Resolution at Ground (SRG), Atmospheric normalization factor ( ), and descriptive statistics of cotton pixel values after atmospheric normalization (DCnor) for the three spectral bands and different flight heights. The trends of the statistical parameters do not change; an identical pixel number (n=6102) is generated for all flight heights by random sampling. According to the MWT, all distributions of the band-specific DCnor from different heights are significantly equal (p>0.05).
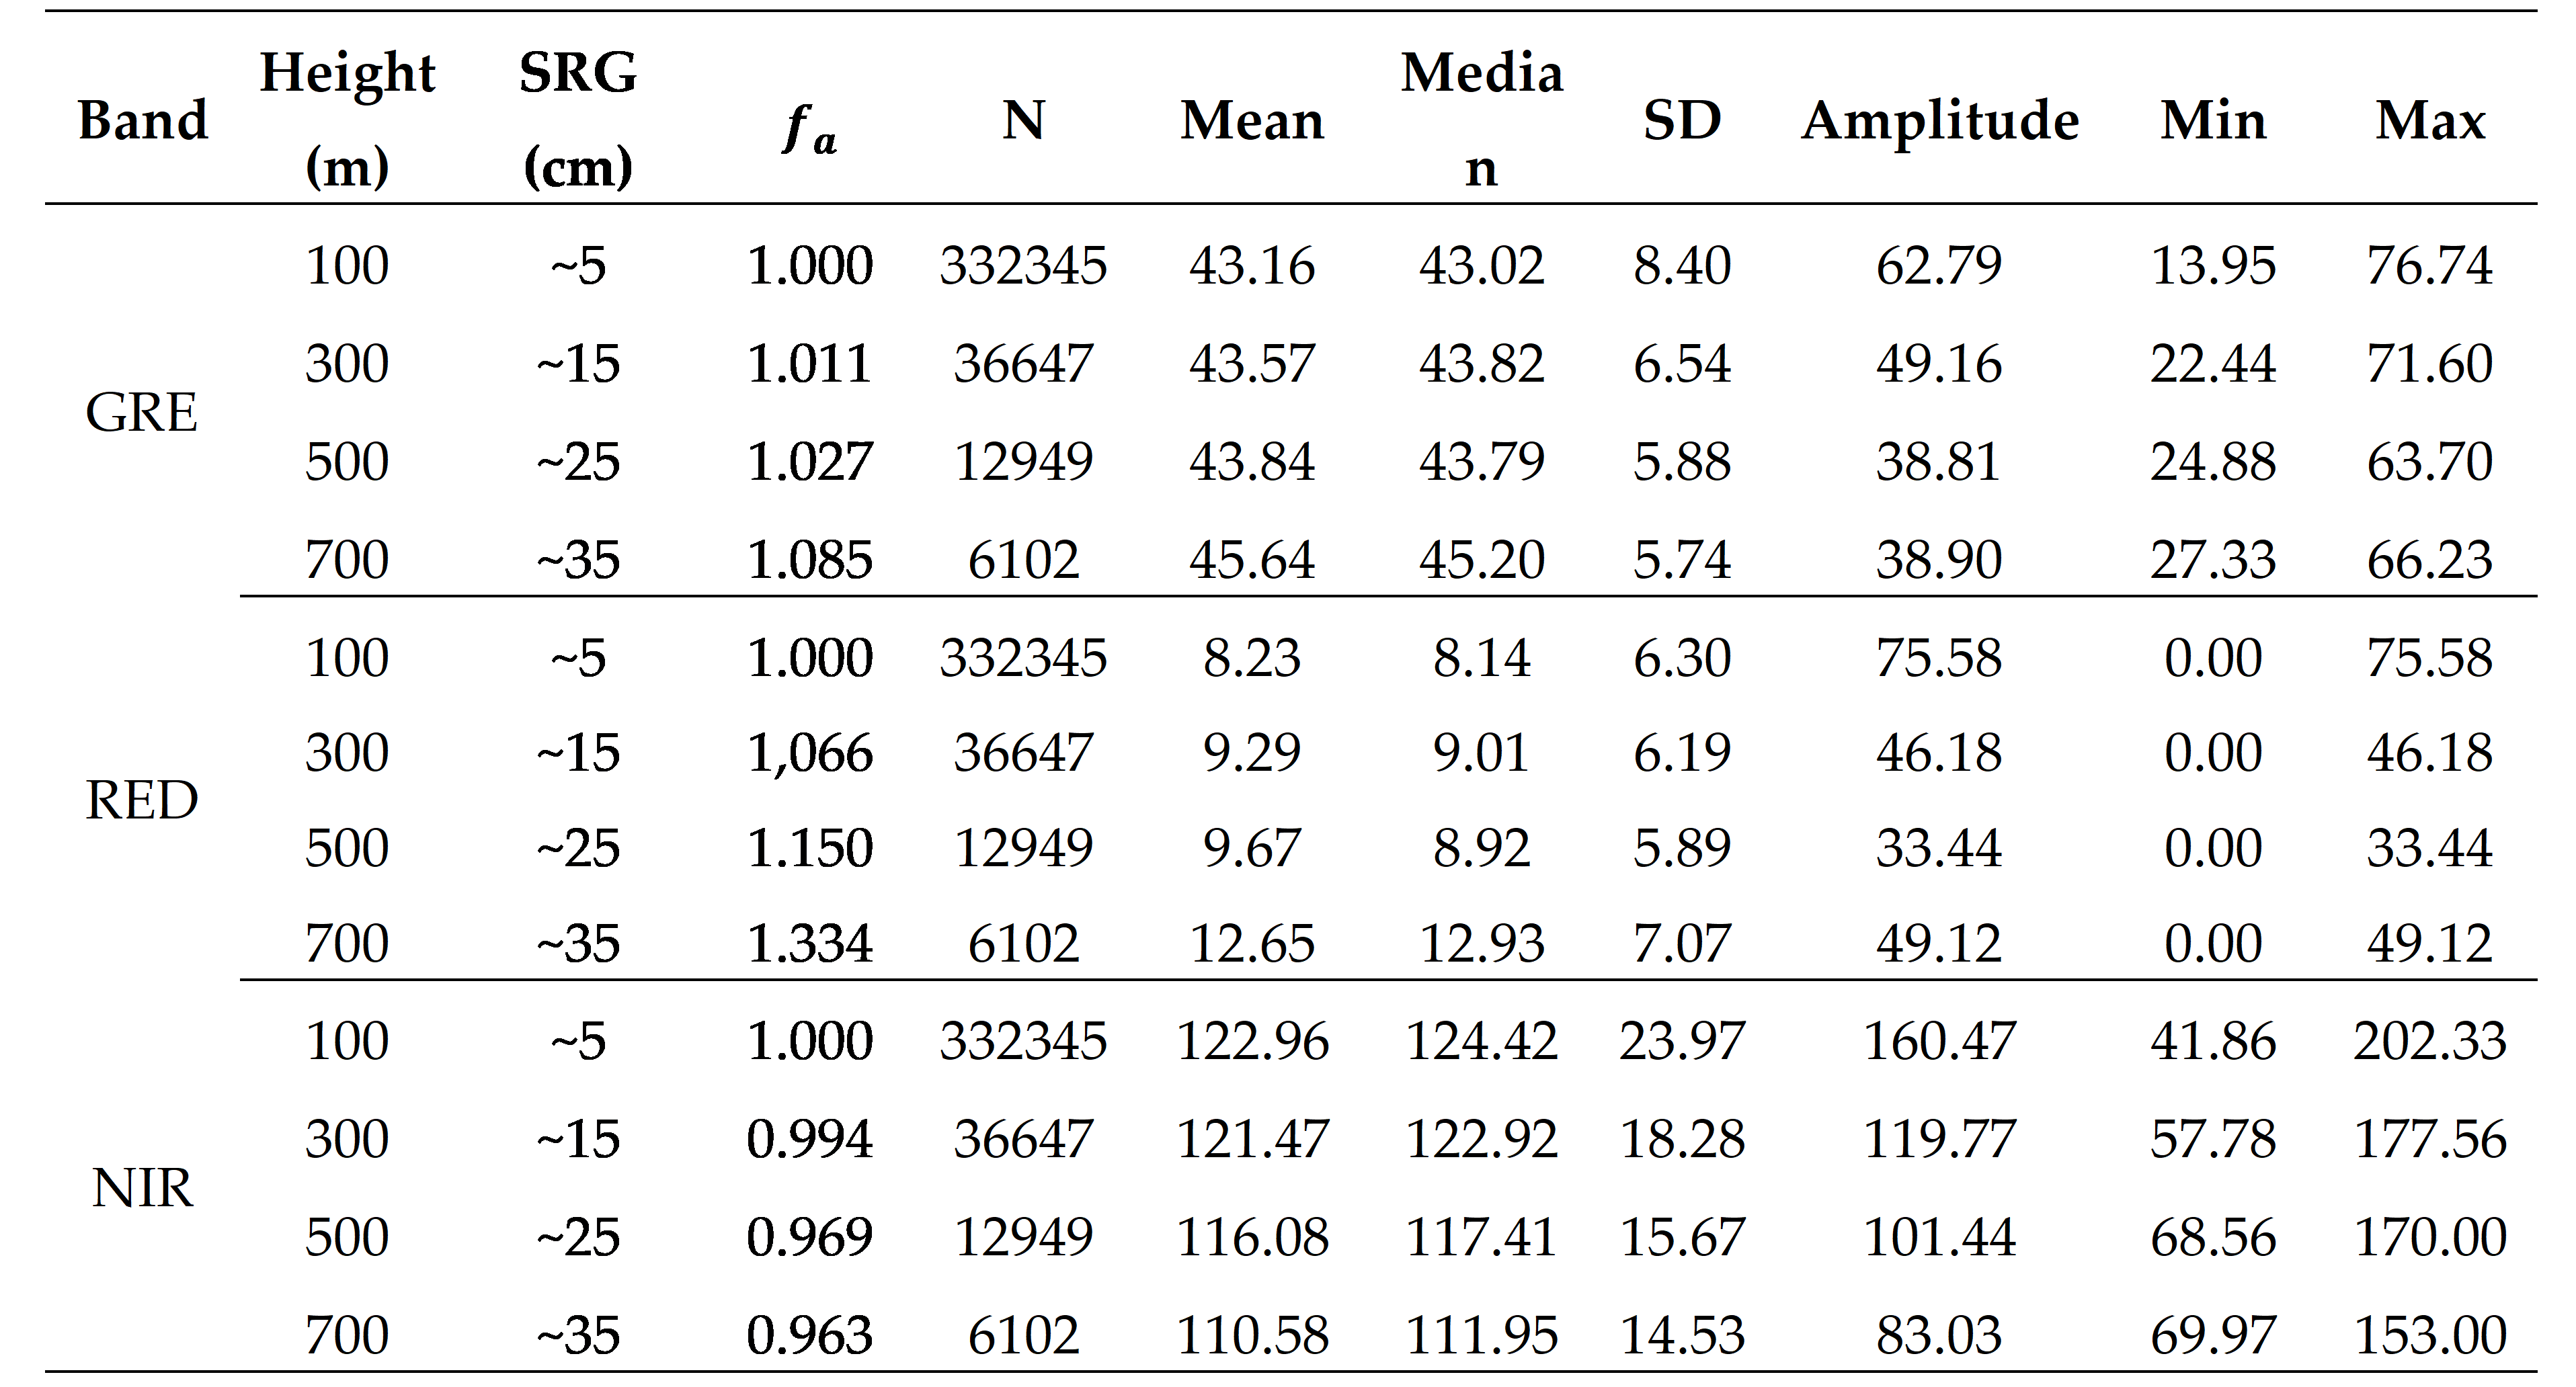
The dispersion decreased with flight heights in all spectral bands, except in the case of the RED band between 500 and 700 m. Due to the reduced spatial resolution, zero values recorded at all flight heights had a lower relative percentage (700 m: 1.6%, 500 m: 2.4%) than at lower heights (100 m: 4.9%, 300 m: 3.2%), increasing relatively central tendencies. The reduction in the variability is a function of the spatial resolution. At lower flight heights, both higher maximum (e.g., pure open soil, directionally reflecting leaves) and minimum (e.g., shadows) DCnor values were registered. Based on the Kolmogorov normality test, the distribution of cotton DCnor values differed significantly from the normality, mainly in the RED band with zero values occurring at all flight heights.
On average, the parcels of all infection levels showed a vegetation signal with expressive NIR values and higher values in the GREEN than RED band. The DCnor values of cotton parcels with lower yields [2] and canopies infected with Verticillium wilt [7] decreased in the GREEN and NIR bands with increasing infection level (Figure 4) and increased in the RED, which corresponds to a reduction of the “red edge” in the plant leaf reflectance [53]. In general, these characteristics were maintained at all flight heights. Absolute values within the classes have the same trends at different flight heights and dispersion levels as observed for the entire dataset (Table 2), with slightly increasing values in the visible wavelength range, a decrease in the NIR, and decreasing variance with increasing flight height.
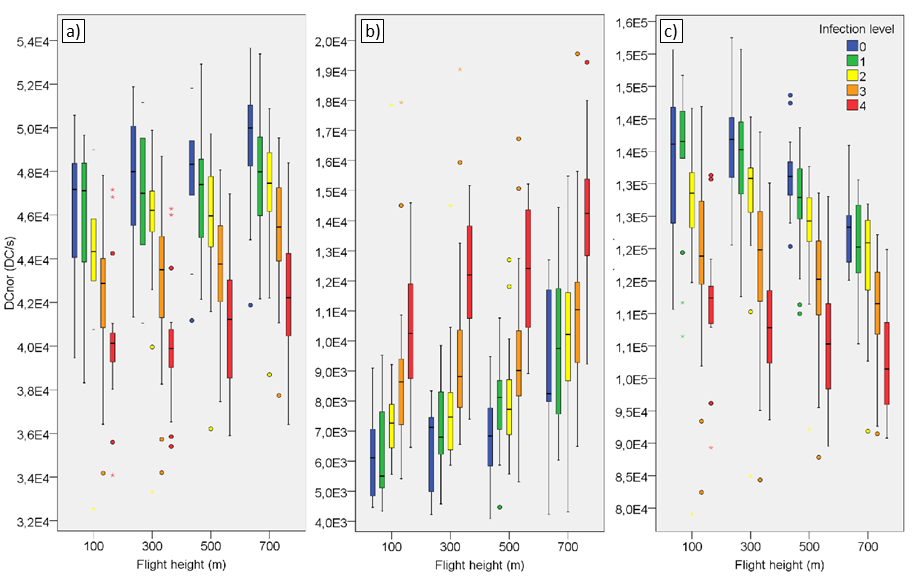
Figure 4. Band-wise DCnor values at different UAV flight heights. (a) green, (b) red, and (c) near infrared
The median differences between successive infection levels are lower at higher classes (3–4, 4–5) than at lower ones (1–2, 2–3) throughout the spectral bands.
Table 2. P-values of the unpaired MW test for the comparison between R. areola infections levels of different flight heights
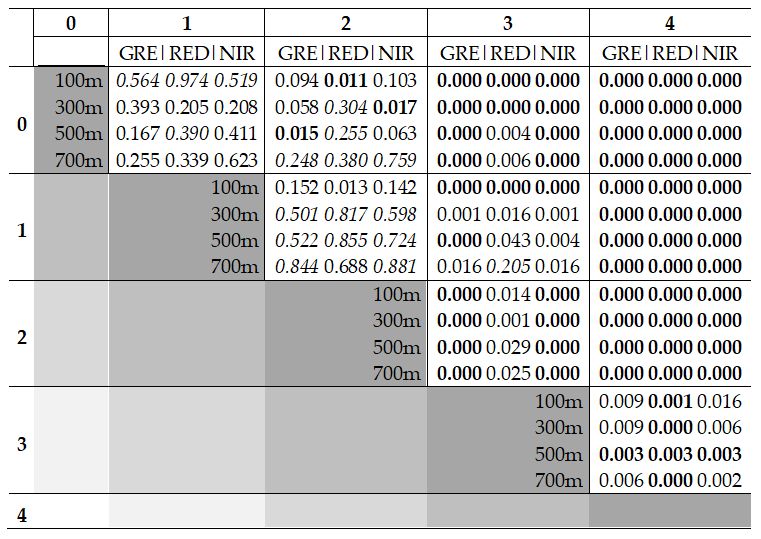
Visual inspections were underpinned by the separability analysis based on the p-values of the unpaired MWT (Table 2). Independently from the flight height and spectral band, the separability between class pairs with more severe infection level (2–4, 3–4, 2–3) is higher than between classes with low infection level (0–1, 1–2). This is directly linked to the classification key applied for Ramularia infection field surveys [54], where affected leaf areas are not scaled linearly in the classes (see Table 1). Parcels without symptoms (class 0) cannot be separated from those of class 1 (affected leaf area < 5%) at any of the flight heights. Even separation from class 2 (affected leaf area < 15%) is almost impossible in the 95% confidence interval for different bands and flight heights. Furthermore, partial leaf loss, which causes a stronger influence of reflection on the underlying soil, only occurs at the most severe level of Ramularia wilt infection (class 5). In general, most pairs with a two-level difference between their classes show a significant difference in all bands and flight heights, however, with better performance for pairs of high (e.g. 2–4) than low infection levels (e.g., 1–3).
Decreasing variability in the signatures partially improves the class differentiation at intermediate flight heights. The cotton signal in the imagery of the 100 m flight height with a nominal spatial resolution of ~5cm is influenced more by reflectance variations due to biotic and abiotic factors such as reflection differences between different plant parts, plant structure causing shadowing, than by symptoms caused by infection (leaf necrosis). The separability was slightly reduced at a height of 700 m.
Because the band-wise separability is not viable, at least between the two lowest infection classes, test classifications were conducted for two keys (Figure 5): i) a four-class key (class 0 and 1 aggregated), ii) a three-class key (class 0 through 2 aggregated) and iii) (classes 0 through 2 and 3 and 4 aggregate).
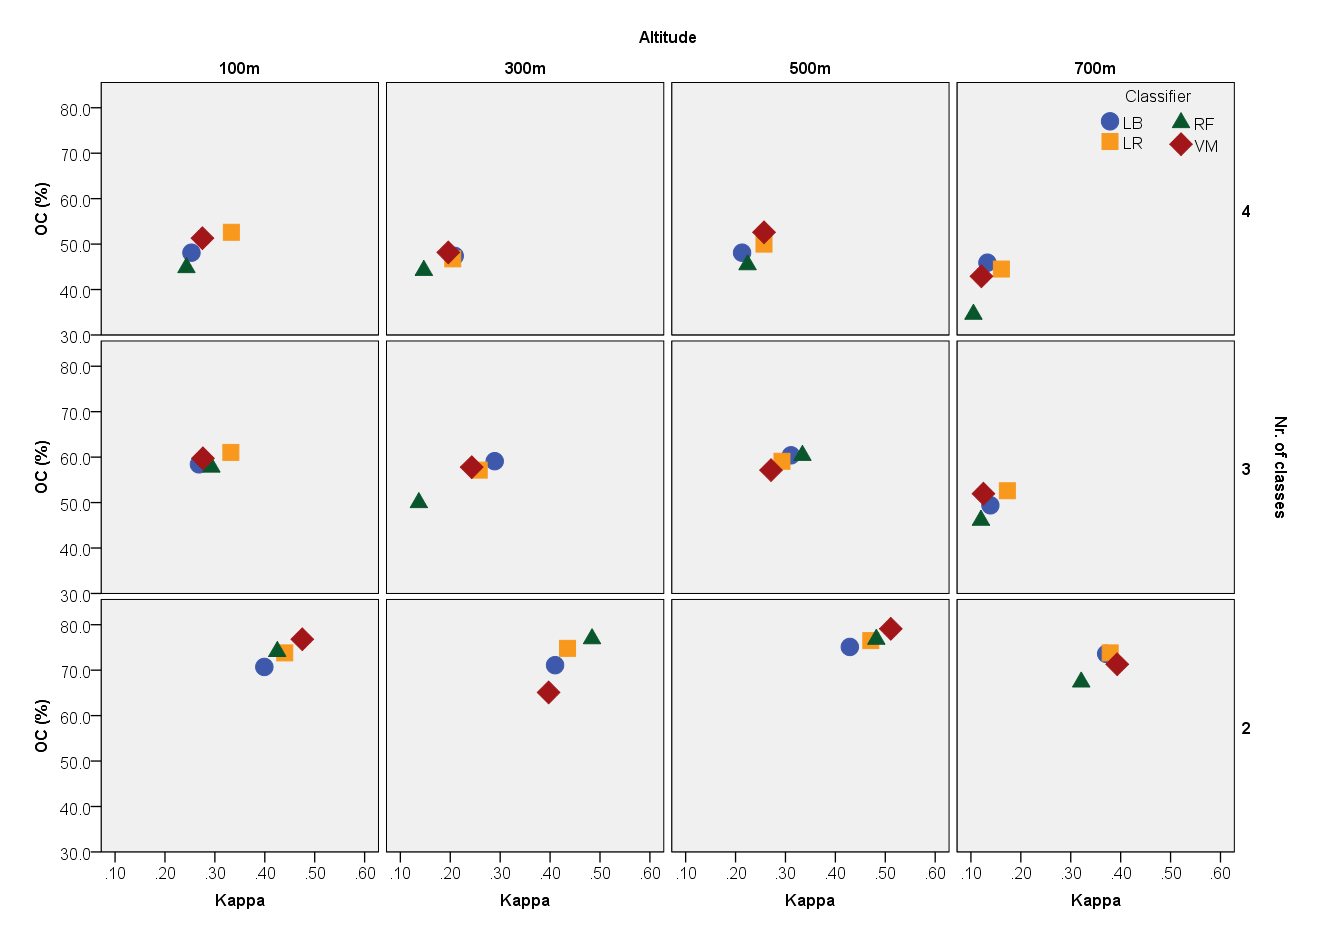
Figure 5. Overall accuracy and kappa index for three-band classifications of four, three and two Ramularia blight infection levels. The cotton pixel DCnor values have been averaged by parcel (median) for the classifications.
The overall classification accuracies range between ~30 % and 79 % and kappa indexes between 0.02 and 0.51, respectively. As expected, the successive reduction from four to three and then to two classes improved both accuracy measures independent of classifier and imaging height. The classifiers perform similarly, with, in average through flight altitudes and the number of differentiated infection levels, a slight advantage of the LR, an inductive linear approach that is known to be less sensitive to smaller amounts of training data. The RF, a machine learning ensemble classifier approach, which tends to overfit, underperforms in the classifications with four infection levels and for the 300 m and 700 m flight heights of the three-level classification key. In the two-class aggregation, the three classifiers with higher demand for training data (LB, RF, VM) perform at least as well as LR. Best single classification performance was obtained for VM, classifying the 500 m flight height imagery in two infection levels.
- Discussion
Multispectral imagery from a vertical flight of a multi-rotor UAV platform was evaluated with respect to the applicability for the identification of Ramularia blight infection levels in cotton. The DC signature separability and classification performance were based on a detailed controlled phytosanitary field experiment in one of the major cotton cropping regions worldwide.
For the comparison of DC values from four flight heights, a relative radiometric adjustment was conducted to normalize different camera exposition times and increasing atmospheric interferences of the imagery. Such a procedure was chosen because the reliable transformation of DC values from UAV-transported moderate costly lightweight CCDs, such as the Tetracam ADC Lite, to reflectance values is not trivial due to the lack of exact information on sensor calibration and viewing geometry caused by platform instability. In fact, no standard tools that do not require ground measurements for the transformation of DC to reflectance values are available [55]. After normalization, the DCnor distributions from the flight heights were not found to be significantly different.
From a practical viewpoint, the applied procedure seems to be much more reliable than extensive and time-demanding radiometric preprocessing and transformation to reflectance values, which would further make it difficult to obtain necessary input data (exact flight geometry, atmosphere parameters, etc.) and may be little viable for operational application by farmers. Nevertheless, future developments for radiometric calibration and correction of UAV-borne imagery and equipment refinement would allow the calculation of comparable vegetation indices throughout the phenologic development. Such indices are known to be important in early disease detection, the differentiation of diseases, better differentiation of disease severity [7,56,57] as well as their upscaling to satellite imagery for large-scale monitoring. More recently released multispectral camera systems such as the Parrot Sequoia+ (Parrot Drones SAS) or the Micasense Rededge MX (MicaSense, Inc.) already allow for absolute reflectance calibration with or without a calibration target.
The classification accuracies were found to be similar to those obtained in vegetation mapping [34] and modest in comparison with results obtained during the assessment of other cotton diseases. In a study on the mapping of cotton root rot from airborne multispectral cameras [23], overall classification accuracies of more than 90% were achieved for the differentiation between infected and non-infected zones. For a binary key, we obtained at the best classification an OC of 79.1% (VM, 500m flight height). Other than Ramularia wilt, which gradually affects the leave canopy, plants infected with root rot die within several days, drastically changing multispectral reflection patterns and improving the differentiation from non-affected crops. The authors further emphasize that the detection is much less effective if plants are newly infected with a small level of damage, while newly infected plants without notable symptoms may not be detectable. Similar findings have been obtained for the detection of leaf diseases of other crops [57]. However, as shown for sugar beet leaves [58] changes in spectral reflectance may occur from impairments in the leaf structure, the chemical composition of the tissue-specific in the pathogenesis of different leaf diseases, or may even be due to abiotic stress [57], aspects not examined in the present study. As shown for example for barley diseased leaves with net blotch, rust, and powdery mildew [57], spectra alterations of diseased leaves are prominent in well-defined wavelengths. Therefore, hyperspectral approaches [59] or at least the utilization of camera systems with additional and/or narrower spectral bands [60] such as from the “red edge” (available for example through the Parrot Sequoia+ or the Micasense Rededge MX sensors) will be imperative to improve detection performance.
Spatial resolution has a known influence on pathogen mapping. In general, improved spatial resolution is expected to improve detection [61]. Leaf disease mapping in other crops, such as the powdery wilt of wheat, showed that the detection by multispectral satellite imagery is not trivial [62]. Using multispectral SPOT 6 data, the authors achieved a dichotomous classification for healthy and infected stands with OC and kappa values of ~77% and 0.55, respectively, similar to those obtained in our study.
Classification performances for the 100 m (SRG = ~5 cm), 300 m (SRG = ~15 cm) and 500 m (SRG = ~25 cm) flight height imagery were found to be almost equivalent, whereas performance decreased for the 700 m flight height (SRG = ~35 cm). As observed in a UAV-based weed seedling mapping from flight heights between 40 m and 100 m [63], best detection performance does not always occur at highest spatial resolution, which can improve with higher altitudes, if plant size is large. They further emphasize that tailored object-based image classification schemes must be elaborated on to take full advantage of very high spatial resolution imagery. The non-equal spacing of the percentages of the affected leaf area in the applied infection level key decreased the performance of class differentiation and classification. The first three of the five classes include plants with only up to 15 % of their total leaf area affected by necrosis (see Figure 2). Because similarly spaced keys are utilized in other farming regions, such as India [64], it should be evaluated if alternative field-scale keys could be developed, which may be better for infection detection using remote sensing methods. In addition, the spatial arrangement of the field experiment was not specifically developed for remote sensing studies. Spatial units with unique infection levels had an unfavorable length-width ratio of ~1:3.9. Principally, this linear design leads to a high percentage of mixed pixels and border effects at higher flight heights than for approximately quadratic parcels.
Furthermore, it must be pointed out, that the applied validation approach, as imperative by the available phytosanitary field survey, tends to underestimate real classification accuracies. Inside the parcels, individual cotton plants or even different leaves of a unique plant show different leaf necrosis levels, which are not expressed by the unique classification given for each parcel. Considering diameters of 60–90 cm of a fully developed cotton crop and given nominal spatial resolutions between 5 cm and 35 cm, one specimen is represented by several pixels and, in the case of the lowest flight heights, one pixel represents a singular leaf. Thus, possible false positives or negatives partially originated from the generalized ground truth.
- Conclusions
The potential of three-band multispectral imagery from a multi-rotor UAV platform for the detection of Ramularia blight from different flight heights was evaluated. Increasing infection levels lead to the progressive degradation of the spectral vegetation signal, however, were not sufficient to differentiate finer-scaled disease severity levels. Findings such as that the separability and classification accuracies did not decrease up to a monitoring height of 500 m and that empirical, relative radiometric adjustment maintains multispectral DC signatures similar to flight heights with almost no atmospheric interference (100 m) have practical relevance. This means that the use of higher flight heights in property scale disease monitoring and precision farming can equilibrate the major limitation of multi-rotor mini UAV with respect to their restricted autonomy and coverage if compared to fixed-wing systems without bias foliar disease detection. Limited classification performances have motivated our ongoing efforts to apply a camera system with a higher spectral resolution (Micasense RedEdge M) and its combined use with a thermal imaging system FLIR 420T (FLIR Commercial Systems). Recent field campaigns include very low altitude imaging (< 100 m) for the acquisition of improved spatial resolution imagery and multitemporal approaches for mapping Ramularia blight and other diseases in cotton.
Author Contributions: conceptualization, T.W.F. Xavier and P. Zeilhofer; data curation, T.W.F. Xavier and E.S. Santos; methodology, T.W.F. Xavier, E.S. Santos, T. Statella and P. Zeilhofer; investigation, T.W.F. Xavier, E.S. Santos, T. Statella and P. Zeilhofer; resources, R. Galbieri, R.N.V Souto, E.S. Santos and G. Suli; project administration, R.N.V. Souto; formal analysis, T.W.F. Xavier and P. Zeilhofer; writing—original draft preparation; validation, P. Zeilhofer and visualization, T.W.F. Xavier and P. Zeilhofer.
Funding: This research was funded by Conselho Nacional de Desenvolvimento Científico e Tecnológico (CNPq), grant number 469363/2014-2, Brazil, and supported by a M.Sc. studentship of the Coordenação de Aperfeiçoamento de Pessoal de Nível Superior (CAPES), grant number 1519921, Brazil.
Acknowledgments: To the Instituto Mato-grossense do Algodão (IMAmt) for partnership in the research through the preparation of the experimental field.
Conflicts of Interest: The authors declare no conflict of interest.
References
- C. Domenikiotis; M. Spiliotopoulos; E. Tsiros; N. R. Dalezios; Early cotton yield assessment by the use of the NOAA/AVHRR derived Vegetation Condition Index (VCI) in Greece. International Journal of Remote Sensing 2004, 25, 2807-2819, 10.1080/01431160310001632729.
- Pablo J. Zarco-Tejada; S. L. Ustin; M. L. Whiting; Temporal and Spatial Relationships between Within-Field Yield Variability in Cotton and High-Spatial Hyperspectral Remote Sensing Imagery. Agronomy Journal 2004, 97, 641, 10.2134/agronj2003.0257.