Your browser does not fully support modern features. Please upgrade for a smoother experience.
Please note this is an old version of this entry, which may differ significantly from the current revision.
Subjects:
Infectious Diseases
This review presents the current knowledge about prevalence and risk factors for colonization by multidrug-resistant organisms (MDRO) in long-term care facilities (LTCF) providing useful references to establish objectives for implementing successful antimicrobial stewardship programs (ASP) that might stop the growing trend of MDRO in this setting.
- multidrug-resistant organism
- long term care facilities
- nursing homes
- prevalence
1. Introduction
Older adults confined to chronic care facilities are known to have an increased risk of acquiring infections, most commonly those of the skin, soft tissues, respiratory and urinary tracts, as well as gastroenteritis [1]. The recent COVID-19 outbreak has underlined the vulnerability of this group around the world [2], and the condition of frailty is gaining international attention. According to the Organization for Economic Co-operation and Development (OECD), it is expected that the population aged from 65 to 79 years will rise from about 10% in 2010 to about 15% in 2050 (https://www.oecd.org/els/health-systems/47884543.pdf; accessed on 14 December 2020). Thus, current trends in the world’s demographic structure indicate increasing requirements in long-term care settings.
The emergence of multidrug-resistant organisms (MDROs) is a major public health concern [3]. Bacteria such as extended-spectrum ß-lactamase (ESBL) Escherichia coli, ESBL Klebsiella pneumoniae, carbapenem-resistant (CR) Enterobacterales, methicillin-resistant Staphylococcus aureus (MRSA), vancomycin-resistant Enterococcus spp. (VRE), and multidrug-resistant (MDR) non-fermenting species such as Pseudomonas aeruginosa and Acinetobacter baumannii are increasing in prevalence [4,5,6,7]. Although it is not an MDRO, Clostridioides difficile represents a worldwide public health concern, as it is one of the major causes of antibiotic-associated infections in healthcare settings, especially among older people living in nursing homes (NH) [8,9].
Polypharmacy and inappropriate prescriptions are well-known risk factors for adverse drug reactions, which commonly cause poor clinical outcomes in older people. Antimicrobial resistance is a major negative event resulting from inappropriate prescriptions of antimicrobials [10].
Antimicrobial stewardship programs (ASPs) have been widely implemented in hospitals, with considerable evidence of their impacts on prescription rates and some evidence that they reduce antibiotic-resistant infections [11]. Elderly care facilities and NH could also benefit from these programs. Knowledge of the epidemiology of MDROs at a local and global level is key to implementing successful antimicrobial stewardship intervention.
2. Studies Included
Initially, 182 references were selected. Among these references, 48 were excluded as follows: (i) studies that did not include MDROs, NH, or LTCF (n = 18); (ii) studies reporting infections by MDROs instead of colonization (n = 17); (iii) limited information about the prevalence of or risk factors for colonization by MDROs (n = 9); and (iv) study population duplicated in included studies (n = 4). Ultimately, 134 references were included (Figure 1). Studies included in this review were published from 1987 to 2020). The most frequent MDRO analyzed was MRSA (n = 88, 65.6%) [1,12,13,14,15,16,17,18,19,20,21,22,23,24,25,26,27,28,29,30,31,32,33,34,35,36,37,38,39,40,41,42,43,44,45,46,47,48,49,50,51,52,53,54,55,56,57,58,59,60,61,62,63,64,65,66,67,68,69,70,71,72,73,74,75,76,77,78,79,80,81,82,83,84,85,86,87,88,89,90,91,92,93,94,95,96,97,98] followed by ESBL Enterobacterales (n = 51, 38.0%) [1,14,16,18,19,20,21,22,23,25,31,33,34,39,57,62,73,75,76,82,83,85,89,97,99,100,101,102,103,104,105,106,107,108,109,110,111,112,113,114,115,116,117,118,119,120,121,122,123,124,125] (E. coli and K. pneumoniae), VRE (n = 36, 26.8%) [1,13,14,18,20,21,22,23,25,28,31,33,34,37,38,39,57,58,59,60,64,65,66,73,74,76,82,83,89,97,106,109,126,127,128,129], CR Enterobacterales (n = 27, 20.1%) [1,13,18,19,20,21,22,34,60,67,73,82,83,97,100,103,104,108,109,110,113,118,130,131,132,133,134], C. difficile (n = 11, 8.2%) [19,37,106,109,131,135,136,137,138,139,140], MDR A. baumannii (n = 11, 8.2%) [13,20,28,37,60,64,67,74,82,85,141], and MDR P. aeruginosa (n = 8, 5.9%) [13,20,34,37,64,67,85,142]. The types of studies were as follows: 99 (73.8%) cross-sectional studies [1,15,16,17,19,26,28,29,30,31,32,34,35,37,39,40,42,43,44,46,47,50,52,54,55,57,59,60,61,62,65,68,69,70,71,72,73,75,77,78,79,80,81,82,83,84,85,87,88,89,91,92,93,96,97,98,99,100,101,102,103,104,105,106,107,108,109,111,113,116,117,118,119,120,121,122,123,124,125,126,128,129,131,132,133,134,135,137,138,140,141,143], 28 (20.9%) observational prospective studies [12,13,14,18,27,33,36,38,41,45,48,51,53,56,58,66,67,76,90,94,95,110,112,115,127,136,139,144], 3 (2.2%) observational retrospective studies [63,64,114], and 4 (2.9%) case-control studies [74,86,130,142]. The MDRO samples were isolated from various sources: nasal (n = 79, 58.9%) [12,14,15,16,18,34,36,38,40,41,42,43,45,46,47,48,49,50,51,52,53,54,55,56,57,58,59,60,61,62,63,64,65,66,67,68,69,70,71,72,73,74,75,77,78,79,80,81,82,83,84,85,86,87,88,90,91,92,93,94,95,96,97,99], perianal (n = 79, 58.9%) [12,14,17,18,19,20,21,22,23,25,28,29,31,32,33,34,38,41,46,47,51,56,57,58,59,60,64,65,66,67,73,74,75,76,78,82,83,85,93,94,99,100,102,103,104,105,106,108,109,110,111,112,113,115,116,117,118,119,120,121,122,124,126,127,128,129,130,131,132,133,134,135,136,137,138,139,140,142,144], skin (n = 33, 24.6%) [12,20,21,22,23,24,28,29,32,33,39,41,43,50,54,60,64,65,66,69,71,72,73,74,79,86,87,92,97,99,105,127,139], oropharynx (n = 24, 17.9%) [15,20,21,24,25,29,30,31,32,33,41,47,57,62,64,65,66,74,83,84,85,93,113,125], ulcers (n = 28, 20.9%) [12,14,23,29,30,31,32,33,36,41,43,47,51,56,57,63,64,65,66,71,74,78,80,81,83,93,102], urine (n = 15, 11.2%) [12,14,16,20,21,22,32,43,80,101,102,104,114,123,124], devices (n = 14, 10.4%) [12,18,23,29,30,33,41,64,65,66,68,80,93,102], and sputum (n = 3, 2.2%) [43,78,141].
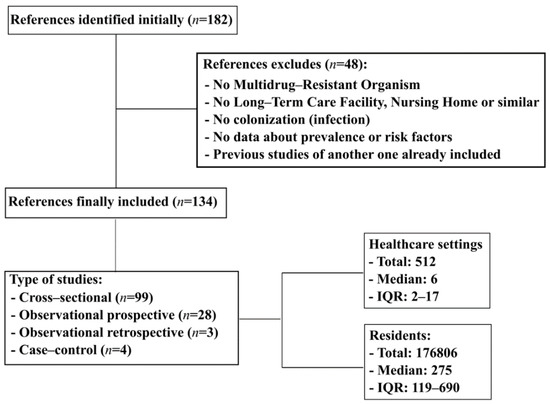
Figure 1. Flowchart search strategy. IQR, interquartile range.
The studies were conducted in several continents, mainly Europe (n = 70, 52.2%) [1,13,15,16,17,18,19,20,21,22,25,30,31,32,34,36,37,39,40,46,47,48,49,50,52,53,55,57,62,63,68,70,71,72,75,76,77,79,80,83,84,85,86,88,91,92,93,98,99,101,103,104,105,107,108,109,110,114,115,116,117,118,119,120,121,123,124,136,140], North America (n = 41, 30.6%) [12,14,23,24,27,29,33,38,41,42,43,44,45,51,58,59,64,65,66,73,74,78,89,90,94,97,102,109,122,127,129,130,131,133,134,137,138,139,141,142,143,144], and Asia (n = 15, 11.2%) [26,28,35,54,60,67,69,87,95,96,100,111,112,126,132]. Seven studies reported data from Oceania (5.2%) [56,81,82,106,113,125,128] and only one from South America (0.7%) [61]. None of the studies were performed in Africa.
3. MDRO Prevalence
The overall prevalence of colonization with MDROs around the world varies between the different pathogens studied. For ESBL Enterobacterales, the median prevalence reported was 11.6%, which increased to 15.0% in the case of ESBL E. coli and decreased to 2.9% for ESBL K. pneumoniae. The overall prevalence of CR Enterobacterales was 0.8%. Among other MDR Gram-negative bacteria, such as P. aeruginosa and A. baumannii, the prevalences reported globally were 1.3% and 5.8%, respectively. In the case of Gram-positive bacteria, MRSA showed the highest prevalence at 13.2%, followed by C. difficile 5.1% and VRE 1.5% (Table 1).
Table 1. Prevalence of multidrug-resistant organisms in long term care facilities.
| Multidrug-Resistant Organism | No. of Articles n = 134 | Percentage of Articles n = 134 (%) | Microorganism Global Prevalence n = 134 (Median, IQR) | Prevalence in Europe n = 70 (Median %, IQR) | Prevalence in North America n = 41 (Median %, IQR) | Prevalence in South America n = 1 (Median %, IQR) | Prevalence in Asia n = 15 (median %, IQR) | Prevalence in Oceania n = 7 (Median %, IQR) | Prevalence in Africa n = 0 (Median %, IQR) |
|---|---|---|---|---|---|---|---|---|---|
| ESBL Enterobacterales | 51 | 38.0 | 11.6 (5.5–24.5) | 12.9 (6.3–21.4) | 9 (3.4–33) | - | 71.6 (46.6–74) | 6.0 (1.4–10.8) | - |
| ESBL Escherichia coli | 33 | 24.6 | 15.0 (7.7–41.4) | 15.3 (7.8–41.2) | 15 (2.9–30.3) | - | 82.7 (50.4–86.1) | 10.4 (5.6–11.2) | - |
| ESBL Klebsiella pneumoniae | 22 | 16.4 | 2.9 (0.4–7.1) | 4.2 (0.6–6.5) | 0.2 (0.0–4.8) | - | 9.1 (8.8–9.4) | 1.7 | - |
| Carbapenem resistant Enterobacterales | 27 | 20.1 | 0.8 (0.0–4.2) | 0.2 (0.0–0.9) | 5.0 (2.0–7.9) | - | 6.9 (1.4–14.6) | 0.4 (0.3–0.5) | - |
| MDR Pseudomonas aeruginosa | 8 | 5.9 | 1.3 (0.2–5.3) | 0.2 (0.08–1.6) | 5.4 (3.2–7.6) | - | 3.9 | - | - |
| MDR Acinetobacter baumannii | 11 | 8.2 | 5.8 (2.2–13.5) | 1.9 (0–4.3) | 15.0 (13.5–16.0) | - | 5.2 (2.9–12.3) | 6.0 | - |
| Meticillin-resistant Staphylococcus aureus | 88 | 65.6 | 13.2 (6.6–25) | 9.1 (4.4–19.6) | 22.0 (12.0–30.0) | 3.7 | 25.6 (13–36.8) | 10 (6.5–13) | - |
| Vancomycin-resistant Enterococcus spp. | 36 | 26.8 | 1.5 (0.06–6.9) | 0.4 (0.0–1.8) | 4.0 (0.9–20.7) | - | 0.0 (0.0–4.8) | 3.1 (2.5–4.5) | - |
| Clostridioides difficile | 11 | 8.2 | 5.1 (1.9–24.8) | 3.7 (1.1–4.9) | 26.1 (16.2–37.5) | - | - | 1.0 | - |
ESBL, extended-spectrum ß-lactamase; MDR, multidrug resistant; IQR, interquartile range.
This prevalence appears to vary between continents. Asia reported the highest prevalence of ESBL Enterobacterales [100,111,112], CR Enterobacterales [60,67,100,132] and MRSA [26,28,35,54,60,67,69,87,95,96]. In contrast, the lowest prevalence of ESBL Enterobacterales, CR Enterobacterales and MRSA have been reported in Oceania [82,106,113,125], Europe [1,13,18,19,20,21,22,34,83,103,104,108,109,110,118] and South America [61]. With respect to MDR P. aeruginosa [64,142], A. baumannii [64,74,141], VRE [14,23,33,38,58,59,64,65,66,73,74,89,97,127,129] and C. difficile [131,137,138,139], North America reported the highest prevalence. However, remarkably, Asia has the lowest prevalence of VRE [28,60,126] (Table 1, Figure 2).
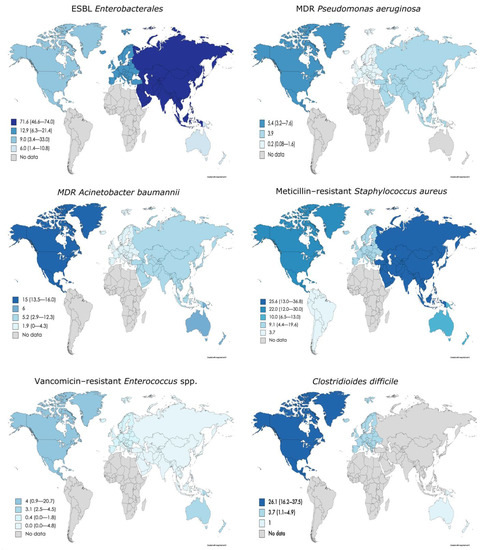
Figure 2. Prevalence of different MDRO in LTCF around the world. Maps were created through the online tool Mapchart.net (https://mapchart.net/world.html, accessed on 23 November 2020). ESBL, extended-spectrum ß-lactamase; MDR, multidrug-resistant.
4. MDRO Co-Colonization
Co-colonization with multiple MDROs seems variable among LTCF. For example, Jans et al. [31] reported a low rate of co-colonization (0.8%) with ESBL Enterobacterales and MRSA among 2791 residents from 60 LTCF. On the other hand, Ludden et al. [18] found that the prevalence of co-colonization with MRSA and ESBL Enterobacterales increased to 39%, although the authors only analyzed one LTCF with 64 residents. Heinze et al. [66] reported that 13.2% of the residents were co-colonized with both MRSA and VRE. When MDROs were considered, the prevalence of co-colonization ranged from 5.5% to 21% for at least two MDROs [57,85,142]. All of these studies suggest that LTCF may act as reservoirs for MDROs, through which transmission may occur via resident–resident interactions or resident–healthcare worker interactions.
5. Changes in MDRO Prevalence Over Time
In the last decade, there has been a remarkable increase in the number of publications on MDR prevalence and LTCF. Figure 3 shows a representation of the median prevalence of MDROs within 5-year periods from 1985 to 2020. In order to be able to observe if there have been changes in the prevalence of MDROs over time, we established a cut-off point in 2015 and compared two time periods (until 2015, including and after 2015). Thus, we had a balanced number of publications on both groups, for each MDRO (Table 2). The ESBL Enterobacterales prevalence increased from 10.5% [14,18,22,23,25,31,33,39,57,75,76,82,85,89,99,101,102,104,106,107,111,112,116,119,121,122,123,124,125,143] to 15.1% [1,16,19,20,21,34,62,73,83,97,100,103,105,108,109,110,113,114,115,117,118,120], but this increase seems to be due to ESBL K. pneumoniae (0.7% vs. 4.2%) rather than ESBL E. coli (18.0% vs. 14.4%). In contrast, the prevalence of CR Enterobacterales decreased from 2015 onward (2.9% vs. 0.8%) [18,22,82,104,132,133] vs. [1,13,19,20,21,34,60,67,73,83,97,100,103,108,109,110,113,118,130,131,134], as did that of MDR A. baumannii, from 10.5% to 5.2% [74,82,85,141] vs. [13,20,28,37,60,64,67]; that of VRE, from 2.8% to 0.6% [14,18,22,23,25,31,33,38,39,57,58,59,65,74,76,82,89,106,126,127,128,129] vs. [1,13,20,21,28,34,37,60,64,66,73,83,97,109] ; that of MRSA, from 16.0% to 9.6% [14,17,18,22,23,25,26,27,29,30,31,32,33,35,36,38,39,40,41,42,43,44,45,46,47,48,50,54,56,57,58,59,63,65,68,69,71,72,75,76,77,78,79,80,81,84,85,86,89,90,91,93,94,95,96,98] vs. [1,13,15,16,19,20,21,24,28,34,37,49,55,60,61,62,64,66,67,70,73,83,87,88,92,97]; and that of C. difficile, from 7.1% to 3.9% [106,137,138,139,140] vs. [19,37,109,131,135,136]. Conversely, the prevalence of MDR P. aeruginosa experienced a slight increase in recent years (0.5% vs. 2.75%) [85,142] vs. [13,20,34,37,64,67] (Table 2). At a more individual level, Kohler et al. [13] analyzed changes in the prevalence of MDROs between 2007 and 2017 in NH from Switzerland. The authors reported an increase from 1.6% to 7.8% in ESBL K. pneumoniae and from 2% to 8% in MDR P. aeruginosa. Furthermore, a decrease from 34.3% to 25.9% was observed in MRSA prevalence. However, in contrast with the global data from this review, ESBL E. coli showed an increase from 5.4% in 2007 to 21.6% in 2017. Min et al. [33], in a one-year period of study, also reported an increase in the prevalence of ESBL-Enterobacterales from 36% to 39% and of VRE, from 10% to 13%. However, in contrast with the previous study, they observed an increase in the prevalence of MRSA, from 23% to 43%.
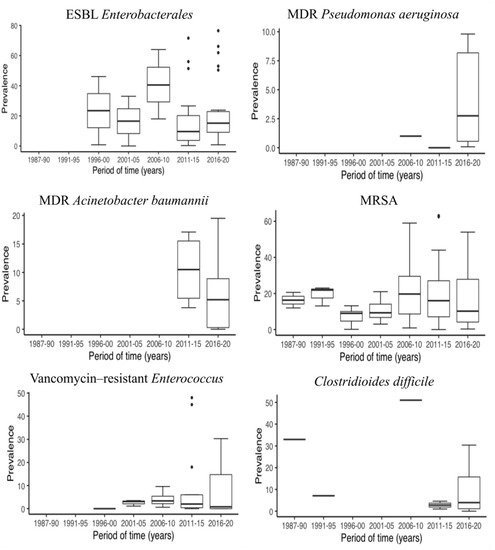
Figure 3. Prevalence of different MDRO in LTCF in 5-year periods. ESBL, extended-spectrum ß-lactamase; MDR, multidrug-resistant; MRSA, methicillin-resistant Staphylococcus aureus.
Table 2. Changes in the prevalence of multidrug-resistant organisms, before and after 2015.
| Multidrug-Resistant Organism | No. of Articles (2015 or Before) n = 90 | No. of Articles (After 2015) n = 44 | Prevalence of MDR (2015 or Before) Median (IQR) | Prevalence of MDR (After 2015) Median (IQR) | Difference (%) |
|---|---|---|---|---|---|
| ESBL Enterobacterales | 30 | 22 | 10.5 (3.5–31.4) | 15.1 (9.1–19.9) | 4.6 |
| ESBL Escherichia coli | 19 | 14 | 18.0 (5.5–40.9) | 14.4 (8.1–41.4) | −3.6 |
| ESBL Klebsiella pneumoniae | 10 | 12 | 0.7 (0.2–9.2) | 4.2 (0.7–6.3) | 3.5 |
| Carbapenem resistant Enterobacterales | 6 | 21 | 2.9 (0.1–7.5) | 0.8 (0–1.9) | −2.1 |
| MDR Pseudomonas aeruginosa | 2 | 6 | 0.5 (0.25–0.75) | 2.75 (0.5–8.2) | 2.25 |
| MDR Acinetobacter baumannii | 4 | 7 | 10.5 (5.4–15.5) | 5.2 (0.3–8.9) | −5.3 |
| Meticillin-resistant Staphylococcus aureus | 61 | 26 | 16.0 (7.8–23.3) | 9.6 (3.9–25.5) | −6.4 |
| Vancomycin-resistant Enterococcus spp. | 22 | 14 | 2.8 (0.5–5.5) | 0.6 (0.001–13.0) | −2.2 |
| Clostridioides difficile | 5 | 6 | 7.1 (4.6–33.0) | 3.9 (1.1–15.7) | −3.2 |
IQR, interquartile range; ESBL, extended-spectrum ß-lactamase; MDR, multidrug resistant.
This entry is adapted from the peer-reviewed paper 10.3390/antibiotics10060680
This entry is offline, you can click here to edit this entry!