1000/1000
Hot
Most Recent
 +1 point
The Finite state Method enables a CPU efficient and reliable analysis of the large scale Markov chains.
The manufacturing industry is of great importance to the national and global economies. Many historical examples, starting with the Industrial Revolution, prove that it is a path towards development and prosperity. More specifically, we have seen many times that national power correlates to control over the global manufacturing industry and means of production, like industry sectors in the US, Japan, Germany, Korea, or China. These examples prove that the growth of the manufacturing output and technological improvement boost long-term economic growth. Additionally, it is estimated that, via the multiplier effect, each manufacturing job supports 5–7 other employments in the economy across the global trade of goods and services [1]. Consequently, an efficient and sustainable economy depends on efficient and sustainable manufacturing. Given that, production system engineering (PSE) stands as a path to rationalization and improvement of the existing production systems through successful production planning and control [2].
PSE relies on production system modeling and analysis using transition system theory at different scales, and particularly on discrete timed models describing steady-state (time-invariant) and transient production system responses. Such models have been predominantly used for the performance evaluation of various serial and assembly production systems focusing on throughput, reliability, sensitivity, lead time, and bottleneck analysis, or other design and optimization problems. In addition, similar applications can be found in fields of molecular biology, evolution, healthcare, city traffic, communication services, computer algorithms, money flow, network structures, etc. [3].
The application of the stochastic modeling in the case of production systems intensified significantly in the last two decades. Currently, significant research efforts are being put into a deeper understanding of the production system behavior in the context of the internet of things [4], still strongly relying on the application of the operation research in the industrial context [5]. Therefore, a systematic approach to production system modeling using stochastic processes has great potential to contribute to current research dealing with Industry 4.0 [6] and advanced production system concepts like digital twinning [7]. In addition to that, stochastic modeling has been successfully applied in cases like tool wear condition monitoring [8], prediction of cutting force during micro-machining [9], or grinding wheel topography modeling [10]. More generally, the importance of the Markovian framework, its background, and broad application cases is proven by a quite significant number of research papers dedicated to that topic [11][12].
Concerning production system modeling, a variety of problems has been addressed in the literature, such as the performance evaluation of serial lines, assembly lines, job shops, flexible manufacturing cells, or other specific types of production. A more detailed review of different modeling approaches, including applications of the Markov processes, semi-Markov processes, queuing networks, stochastic automata networks, Petri nets, performance algebra, and diodic algebraic models, was presented recently by Papandopulos et al. [3]. It was pointed out that the majority of the research body is still dominated by the application of the Markovian framework in cases of serial production lines—“the working horse of production systems”.
The pioneering work on this topic was presented amid the last century by Sevast’yanov [13] who developed an analytical solution to the steady-state response of the Bernoulli serial line composed of two machines and one buffer using the integral equations. In addition, an idea of the approximation method in the case of lines with more than two machines was presented since the integral equations proved to be too complex to obtain a more general solution. The lack of the analytical solution in the case of the general Bernoulli serial line (a line with an arbitrary number of machines and buffers of arbitrary capacity) and the awareness of the “dimensionality curse” related to the large scale transition systems have motivated the researchers to further develop different approximation techniques enabling modeling and performance analysis of production systems. According to Papandopulos [3], two methods prevail, namely the decomposition and the aggregation algorithms. The first approach decomposes a production line into two pseudo-machine and one buffer sublines, while the latter uses a sequential backward–forward aggregation of two neighboring machines until a complete line is condensed into a single machine.
The advantage of the decomposition and aggregation methods is the ability to model and analyze complex production lines at low CPU (central processing unit) costs, while getting some idea of the observed production system and its properties through performance evaluation. Both methods were applied in the manufacturing industry in cases like the automotive industry, the industry of household appliances, furniture factories, etc. However, the major drawback of both methods is a lack of systematic verification against the missing analytical results. In this respect, the analytical solution of the general Bernoulli serial line problem was formulated recently using the generalized transition matrix approach [14]. Unfortunately, its application was limited due to the exponential growth of the problem scale known as the “dimensionality curse”, resulting in extensive CPU requirements and computer memory storage limitations. Consequently, the methods of approximation were verified only in a limited spectrum of problems.
However, the developed analytical solution enabled the formulation of the eigenvector associated with the largest eigenvalue of the respective transition (stochastic) matrix. Such an eigenvector can be considered as the DNA of the transition system under consideration as it is composed of the steady-state probabilities for each state of the system’s state space. This property is exploited further in the present paper in order to formulate a finite state method (FSM) that bypasses the system’s dimensionality issues and approximates the exact results. The essence of the method reflects the internal relationships between the eigenvector components, allowing further systematic verification of the approximation methods as well as research on system improvability within the Markovian framework of the serial Bernoulli production lines. The method is applied in cases of several serial Bernoulli production lines, providing a possibility of extensive verification of the aggregation method.
Validation of the developed FSM is performed in cases of the serial Bernoulli lines L1–L9 with probabilities of the state {up} specified in Table 1. Performance measures were calculated using Equations (12), (15), (18), (19), and (22) for each line using the analytical solution (AN), the aggregation procedure (AGG) and the FSM using ProLab, an in-house software developed by the authors, and PSEToolbox (Production System Engineering Toolbox) [2]. Evaluation of the performance measures was performed for the specified lines as well as for their permutations including even and uneven distribution of the buffer occupancy. However, only selected and the most interesting results are presented here. In addition, to enable a simple graphical presentation of the results, all of the buffer occupancies were selected as fractions or multiplies of the first or the last buffer’s capacity. Nevertheless, the considered approach was valid in case of the arbitrary buffer occupancies. Buffer occupancy was specified separately for each considered case.
As the first step of the FSM validation, a line L1 was considered to check the fundamental accuracy of the method against the well known analytical solution of the line composed of two machines and one buffer. The performance measured in the case of the line L1 and its reverse were evaluated using AN, AGG, and FSM approaches and are compared in Figures 1 and 2. Both AGG and FSM approaches agreed very well with the analytical results in this simplest case, except for some negligible discrepancies due to numerical reasons. An excellent agreement could also be noticed in the asymptotic values approached by the performance curves in all three cases. In addition, a reversibility property of the line was excerpted nicely.
Table 1. List of considered serial Bernoulli production lines with probabilities of the state {up} (authors’ work).
|
Line |
M |
p1 |
p2 |
p3 |
p4 |
p5 |
p6 |
p7 |
p8 |
p9 |
p10 |
|
L1 |
2 |
0.6 |
0.9 |
|
|
|
|
|
|
|
|
|
L1R |
2 |
0.9 |
0.6 |
|
|
|
|
|
|
|
|
|
L2 |
3 |
0.6 |
0.75 |
0.9 |
|
|
|
|
|
|
|
|
L2′ |
3 |
0.6 |
0.75 |
0.9 |
|
|
|
|
|
|
|
|
L2′R |
3 |
0.9 |
0.75 |
0.6 |
|
|
|
|
|
|
|
|
L3A |
4 |
0.6 |
0.7 |
0.8 |
0.9 |
|
|
|
|
|
|
|
L3B |
4 |
0.7 |
0.6 |
0.8 |
0.9 |
|
|
|
|
|
|
|
L3C |
4 |
0.9 |
0.7 |
0.6 |
0.8 |
|
|
|
|
|
|
|
L4 |
5 |
0.6 |
0.675 |
0.75 |
0.825 |
0.9 |
|
|
|
|
|
|
L5 |
6 |
0.6 |
0.66 |
0.72 |
0.78 |
0.84 |
0.9 |
|
|
|
|
|
L6 |
7 |
0.6 |
0.65 |
0.7 |
0.75 |
0.8 |
0.85 |
0.9 |
|
|
|
|
L7 |
8 |
0.6 |
0.643 |
0.686 |
0.729 |
0.772 |
0.815 |
0.858 |
0.9 |
|
|
|
L8 |
9 |
0.6 |
0.637 |
0.674 |
0.711 |
0.75 |
0.787 |
0.824 |
0.862 |
0.9 |
|
|
L9 |
10 |
0.6 |
0.633 |
0.666 |
0.699 |
0.732 |
0.765 |
0.798 |
0.831 |
0.864 |
0.9 |
The performance measures of the line with three machines were evaluated in several cases. The first case, L2, took into account the original arrangement of machines (see Table 1) and even buffer capacity distribution along the line. Figure 3 presents the distribution of the performance measures as a function of buffer capacity. A good agreement of both AGG and FSM with the analytical results was evident, except for slight discrepancies in PR and ST3 between AN and FSM solution for the lowest level of buffers’ capacity.
Uneven distribution of the buffer capacity and perturbed arrangement of the machines were evaluated in the case of the line labeled as L2′. The third case, L2′R, considered a reverse of the L2′ line. The performance measures obtained using AN, AGG, and FSM approaches are presented in Figures 4 and 5 as functions of the buffer capacity. It can be seen that generally, all three methods agreed well, particularly in asymptotic values of the performance measures. It can also be noticed that the reversibility property held for lines L2′ and L2′R.
Performance measures of the line with four machines were evaluated in three cases of different machine arrangements including the uneven distribution of the buffer capacity. A comparison between the obtained results is presented in Figures 6–8 in cases of lines L3A, L3B, and L3C. Again, the discrepancies were related to the smallest state spaces of buffers with small capacity. As the state space increased, the methods approached the same asymptotic values. It is interesting to notice a relationship between the position of the worst machine, WIP, BL, and ST. In a case when the worst machine was in position i = 2, 3, …, M, WIPi-1 altered from the asymptotic function to an almost linear curve, while BLi-1 and STi altered pertaining asymptotes.
The above examples proved a quite good agreement between the aggregation procedure, the finite state method, and the analytical solution. Therefore, the analytical solution could be omitted from further evaluations of lines L4–L9 as it would require considerably more CPU time as compared to the AGG and FSM algorithms. Further, to avoid the presentation of extensive data generated by the evaluation, only asymptotic values of the performance measures of lines L4–L9 are presented in Figures 9 and 10. The machine arrangement is presented in Table 1, while the buffer occupancy is considered to be even along the lines. The obtained asymptotic value of the production rate was, as expected, the same for both lines and was equal to 0.6. The probability of machine blockage was also equal to 0 since the first machine was also the worst one. The asymptotic values of the work-in-process for each buffer of lines L4–L9 are presented in Figure 9. It can be seen that both methods yielded almost the same values. Additionally, the asymptotic values of the probability of starvation for each machine of the considered lines are presented in Figure 10. A nice agreement between the results can be noticed.
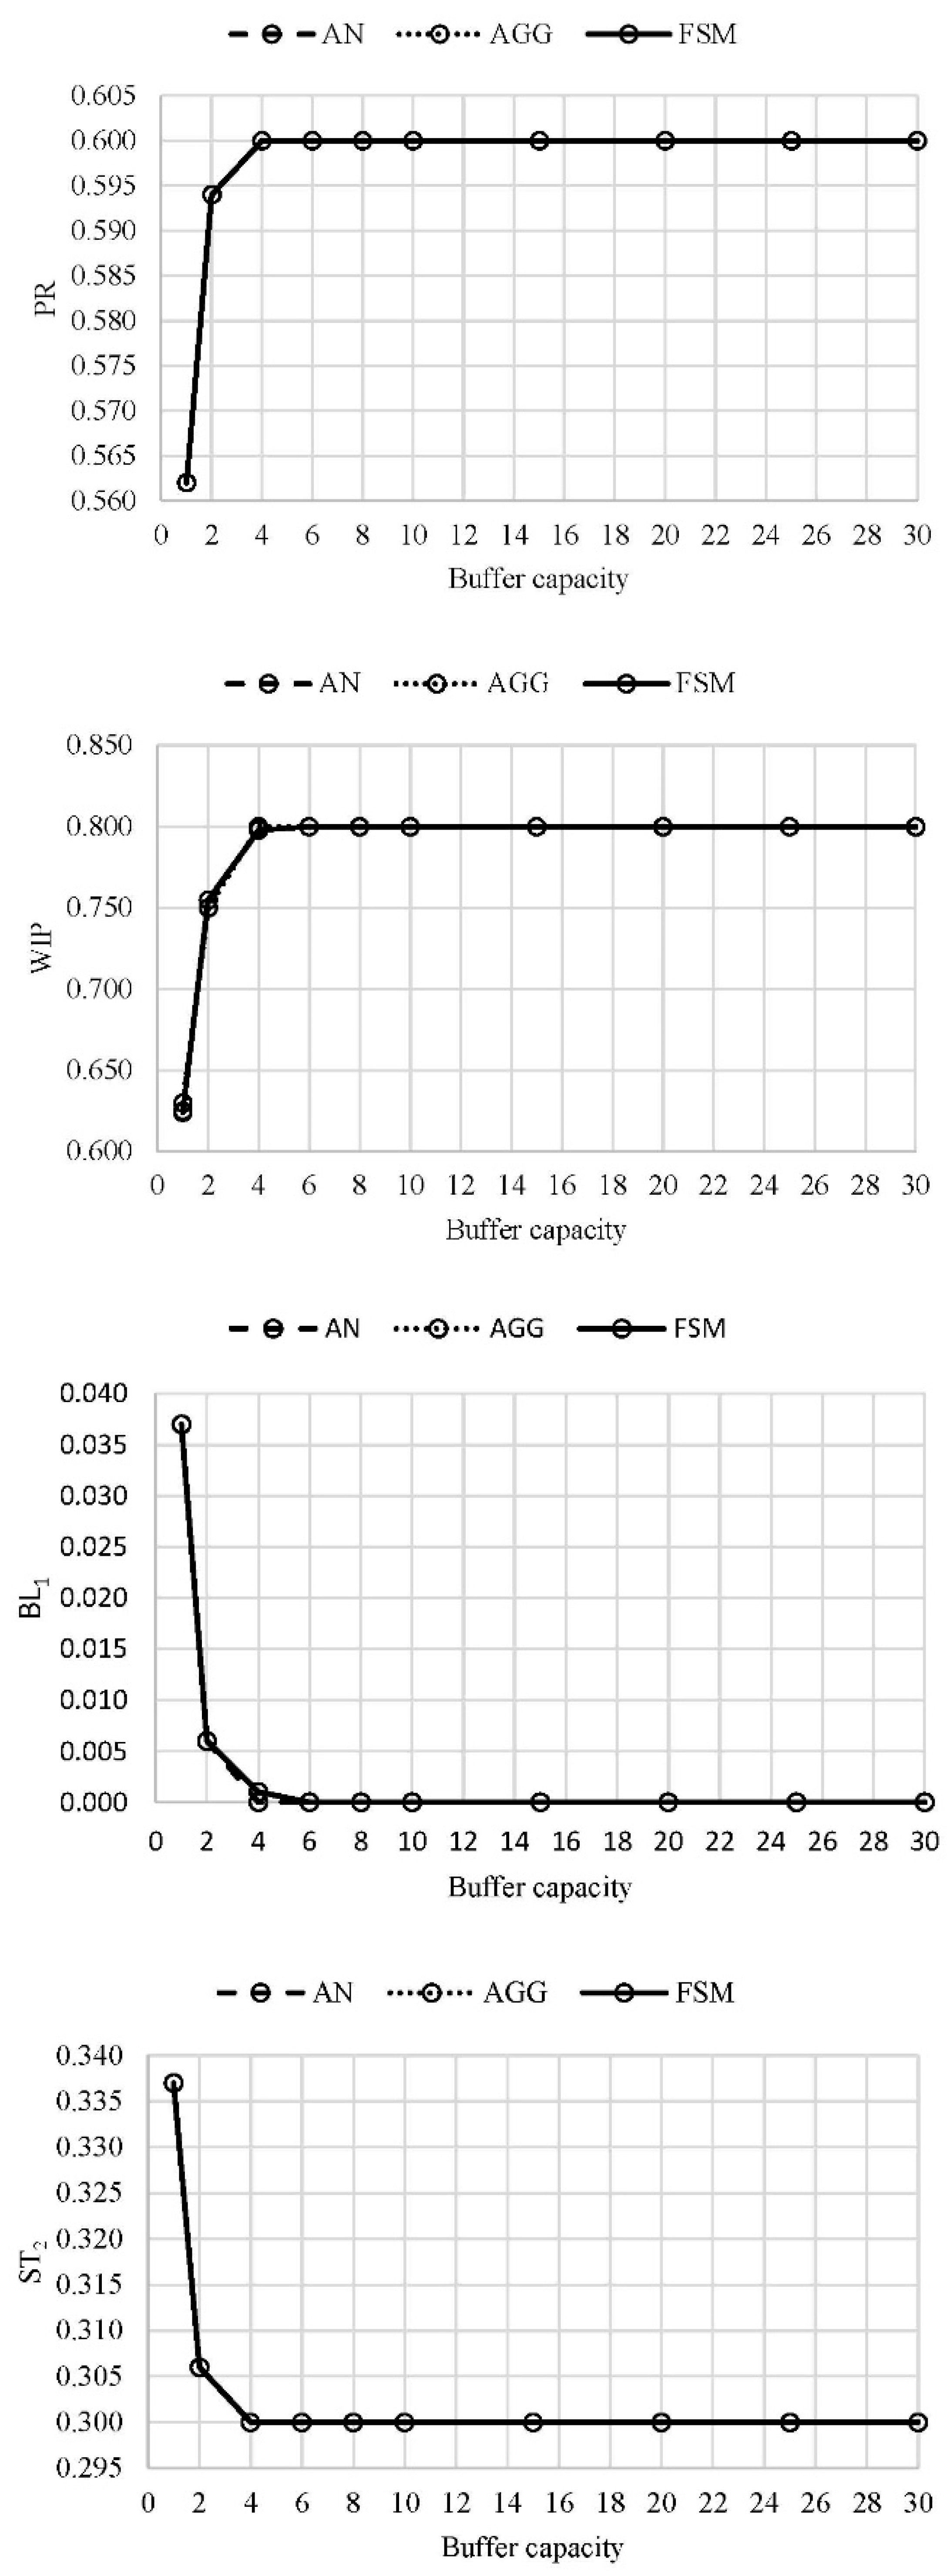
Figure 1. PR, WIP, BL1, and ST2 in case of the line L1 (authors’ work).
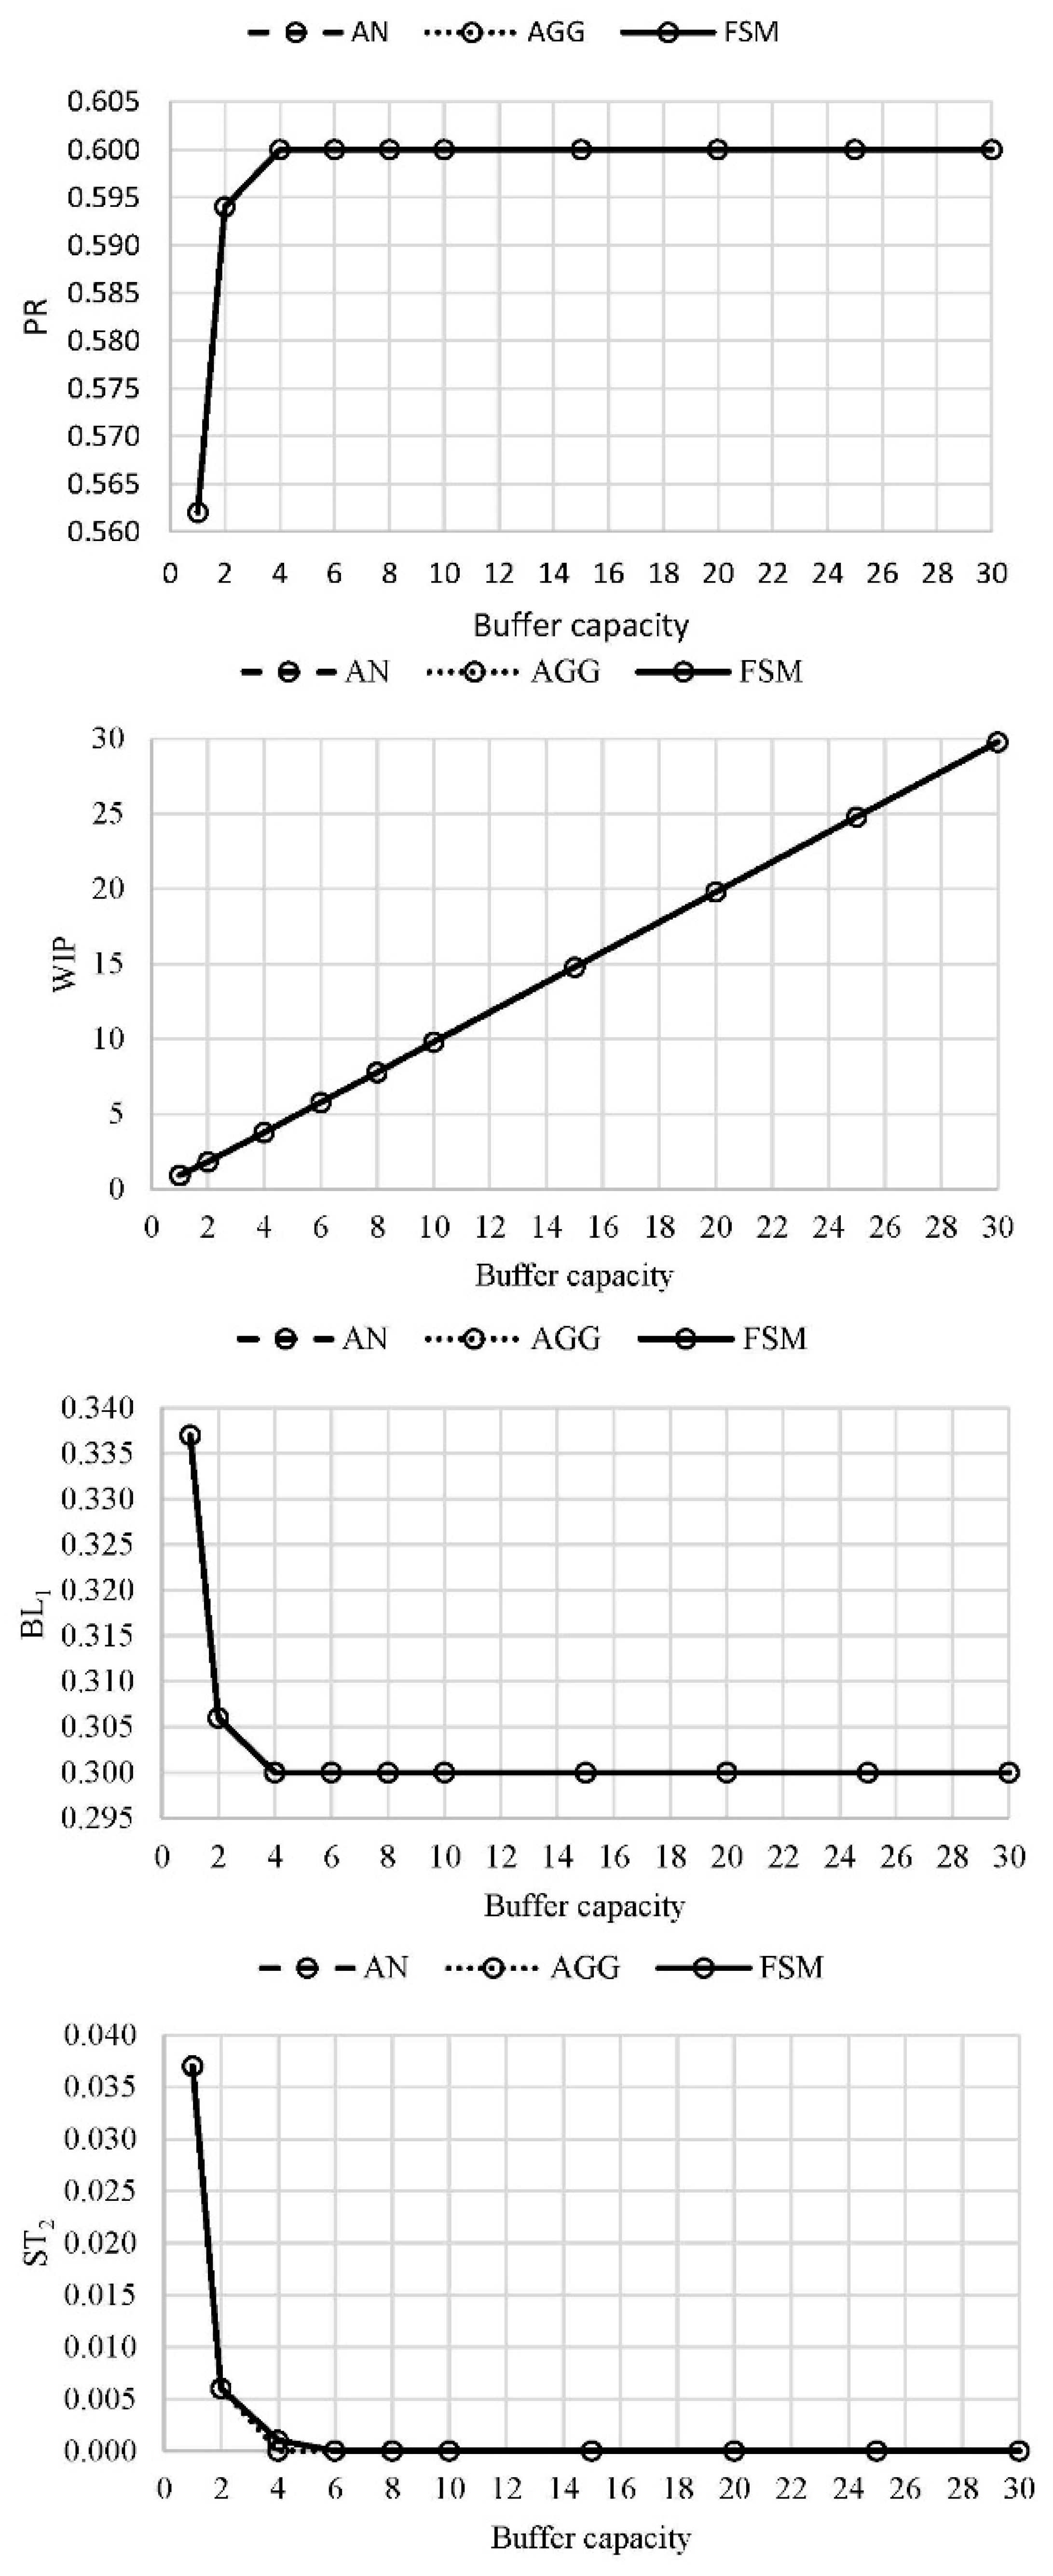
Figure 2. PR, WIP, BL1, and ST2 in case of the line L1R (authors’ work).
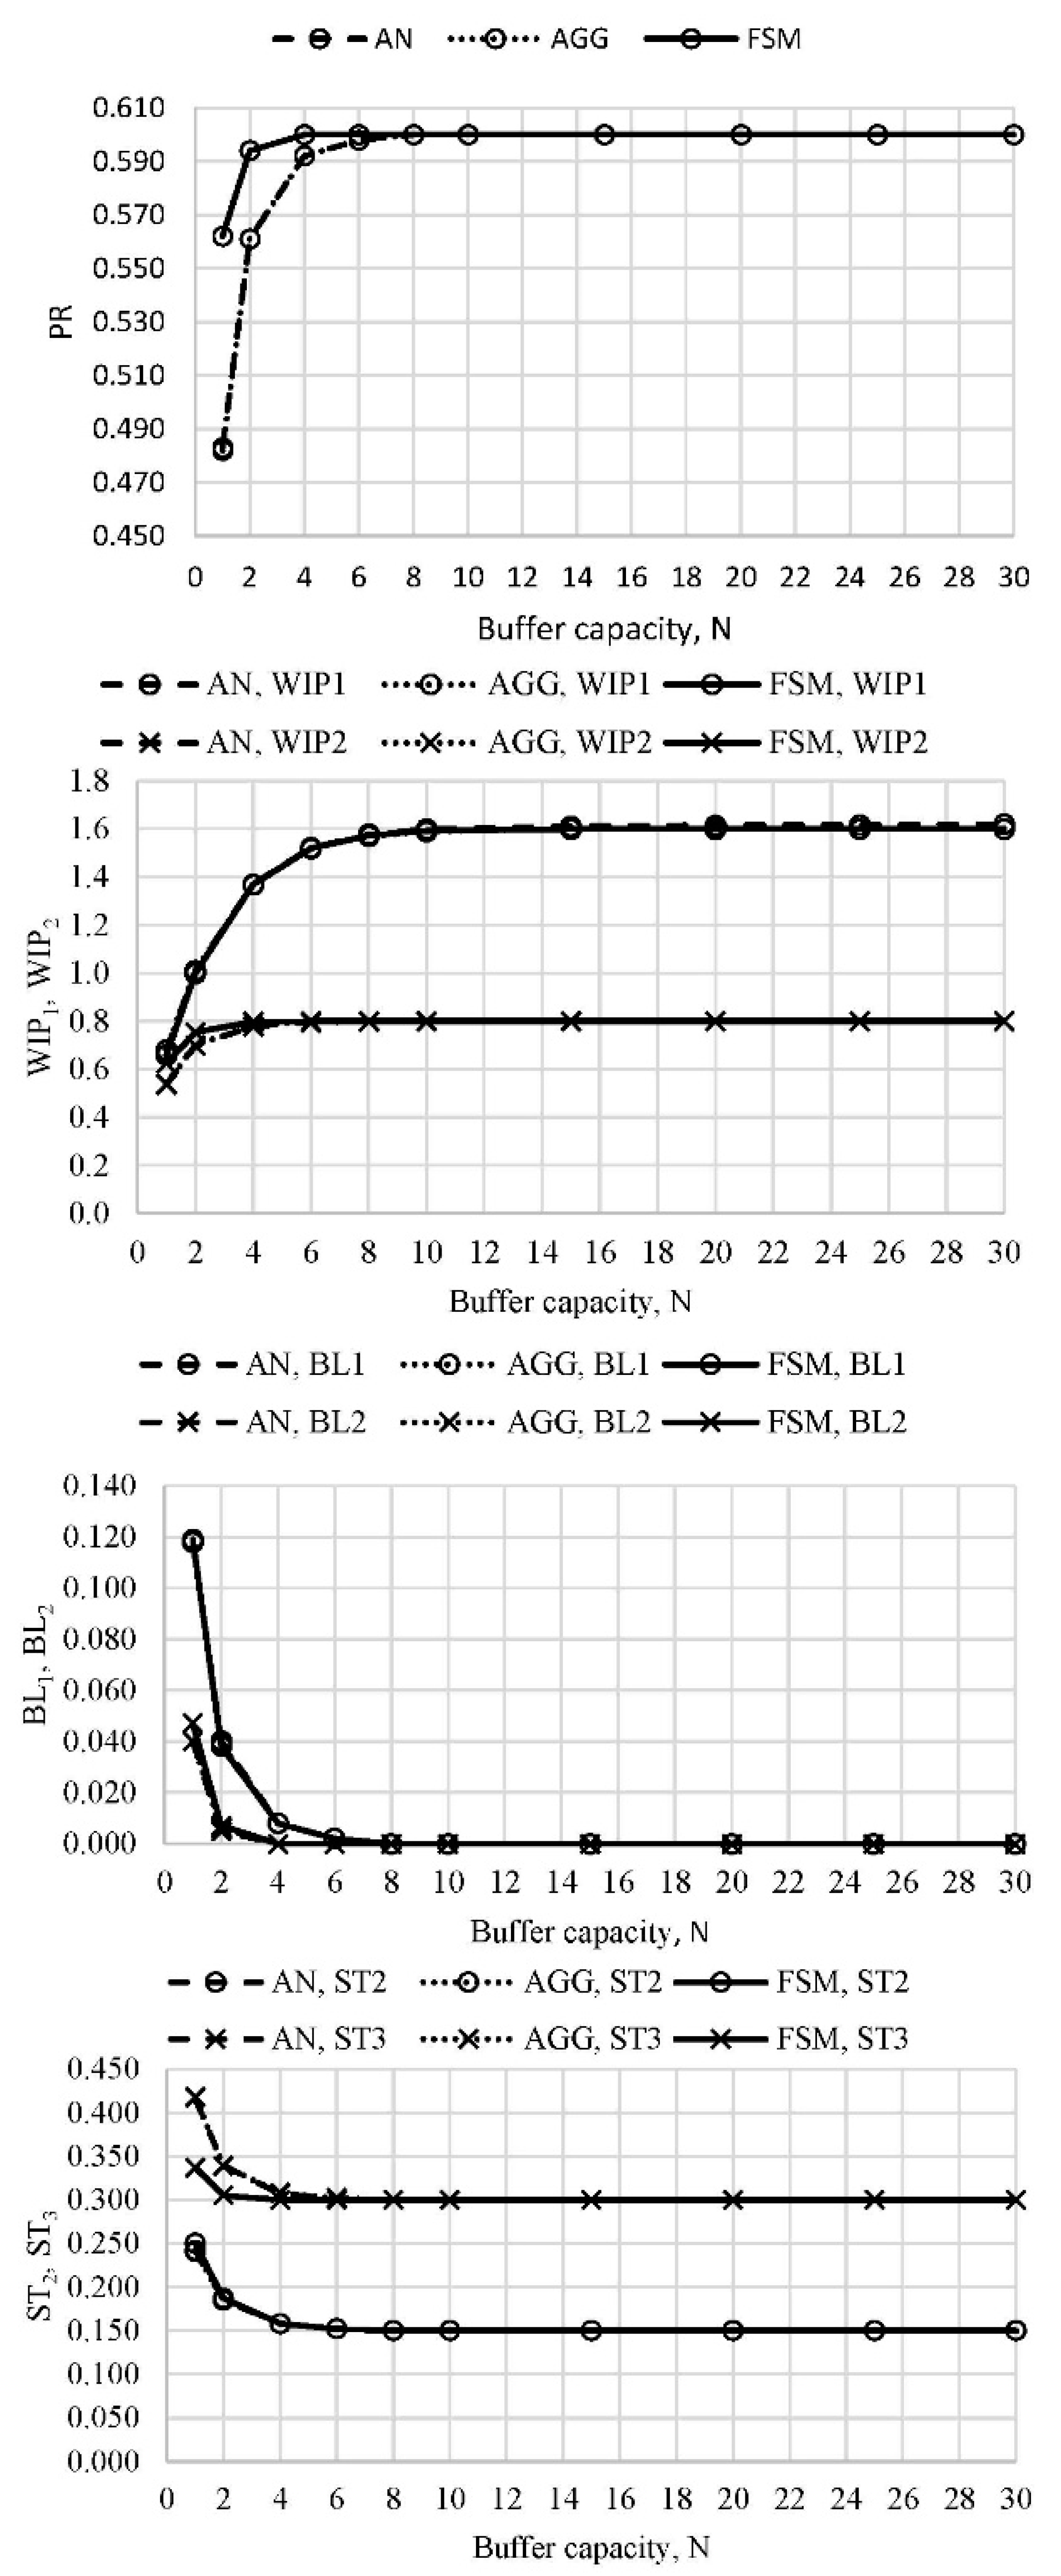
Figure 3. PR, WIP1, WIP2, BL1, BL2, ST2, and ST3 in case of the line L2, N1 = N2 = N (authors’ work).
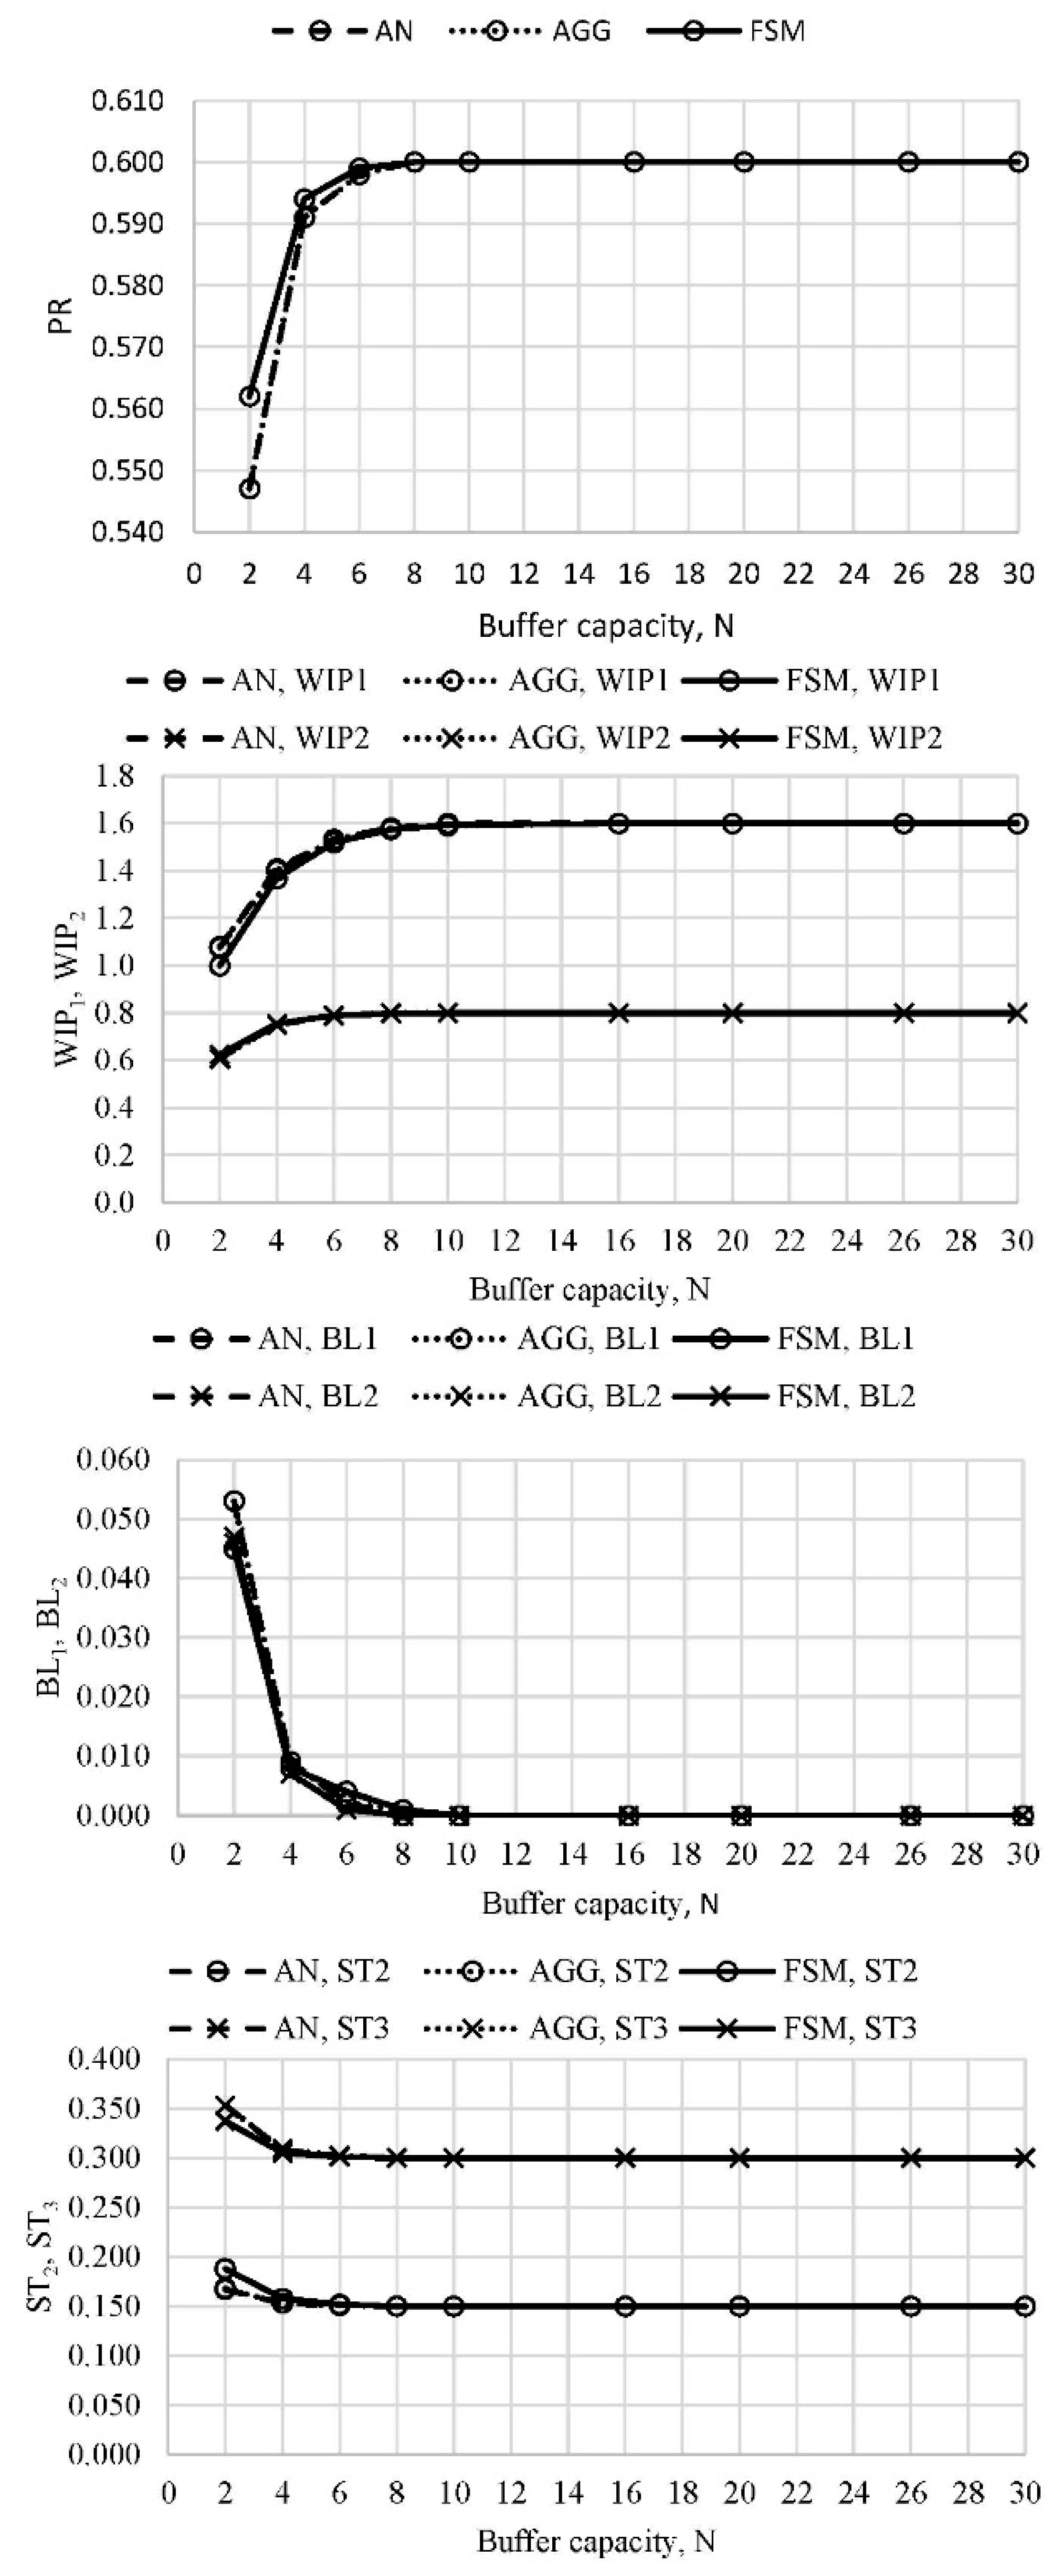
Figure 4. Performance measures of the perturbed line L2′ (N1 = N, N2 = ½N1) (authors’ work).
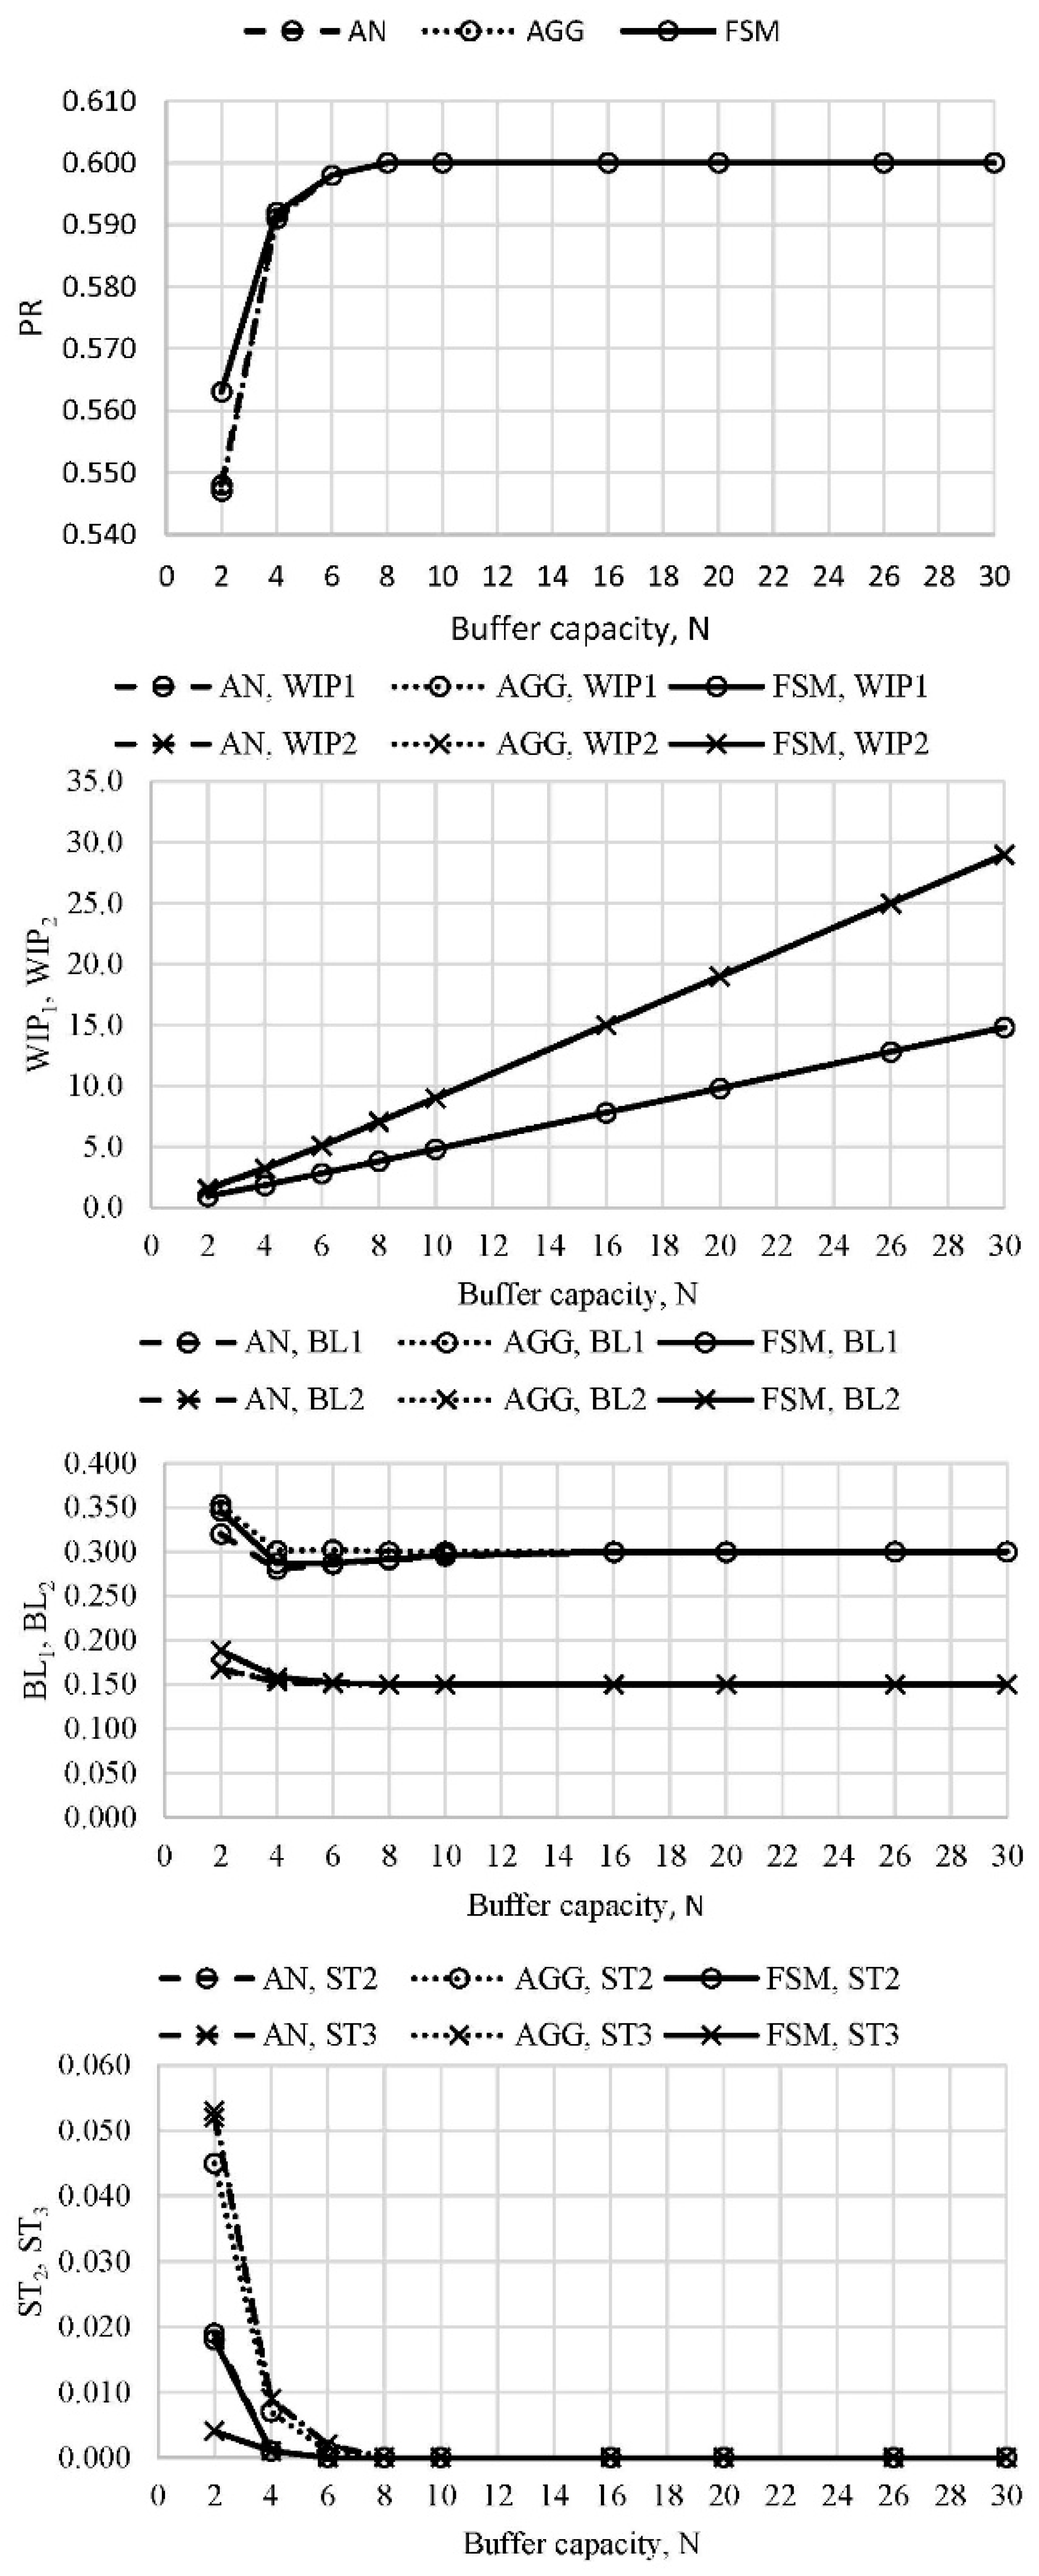
Figure 5. Performance measures of the perturbed line L2′R (N1 = ½N2, N2 = N) (authors’ work).
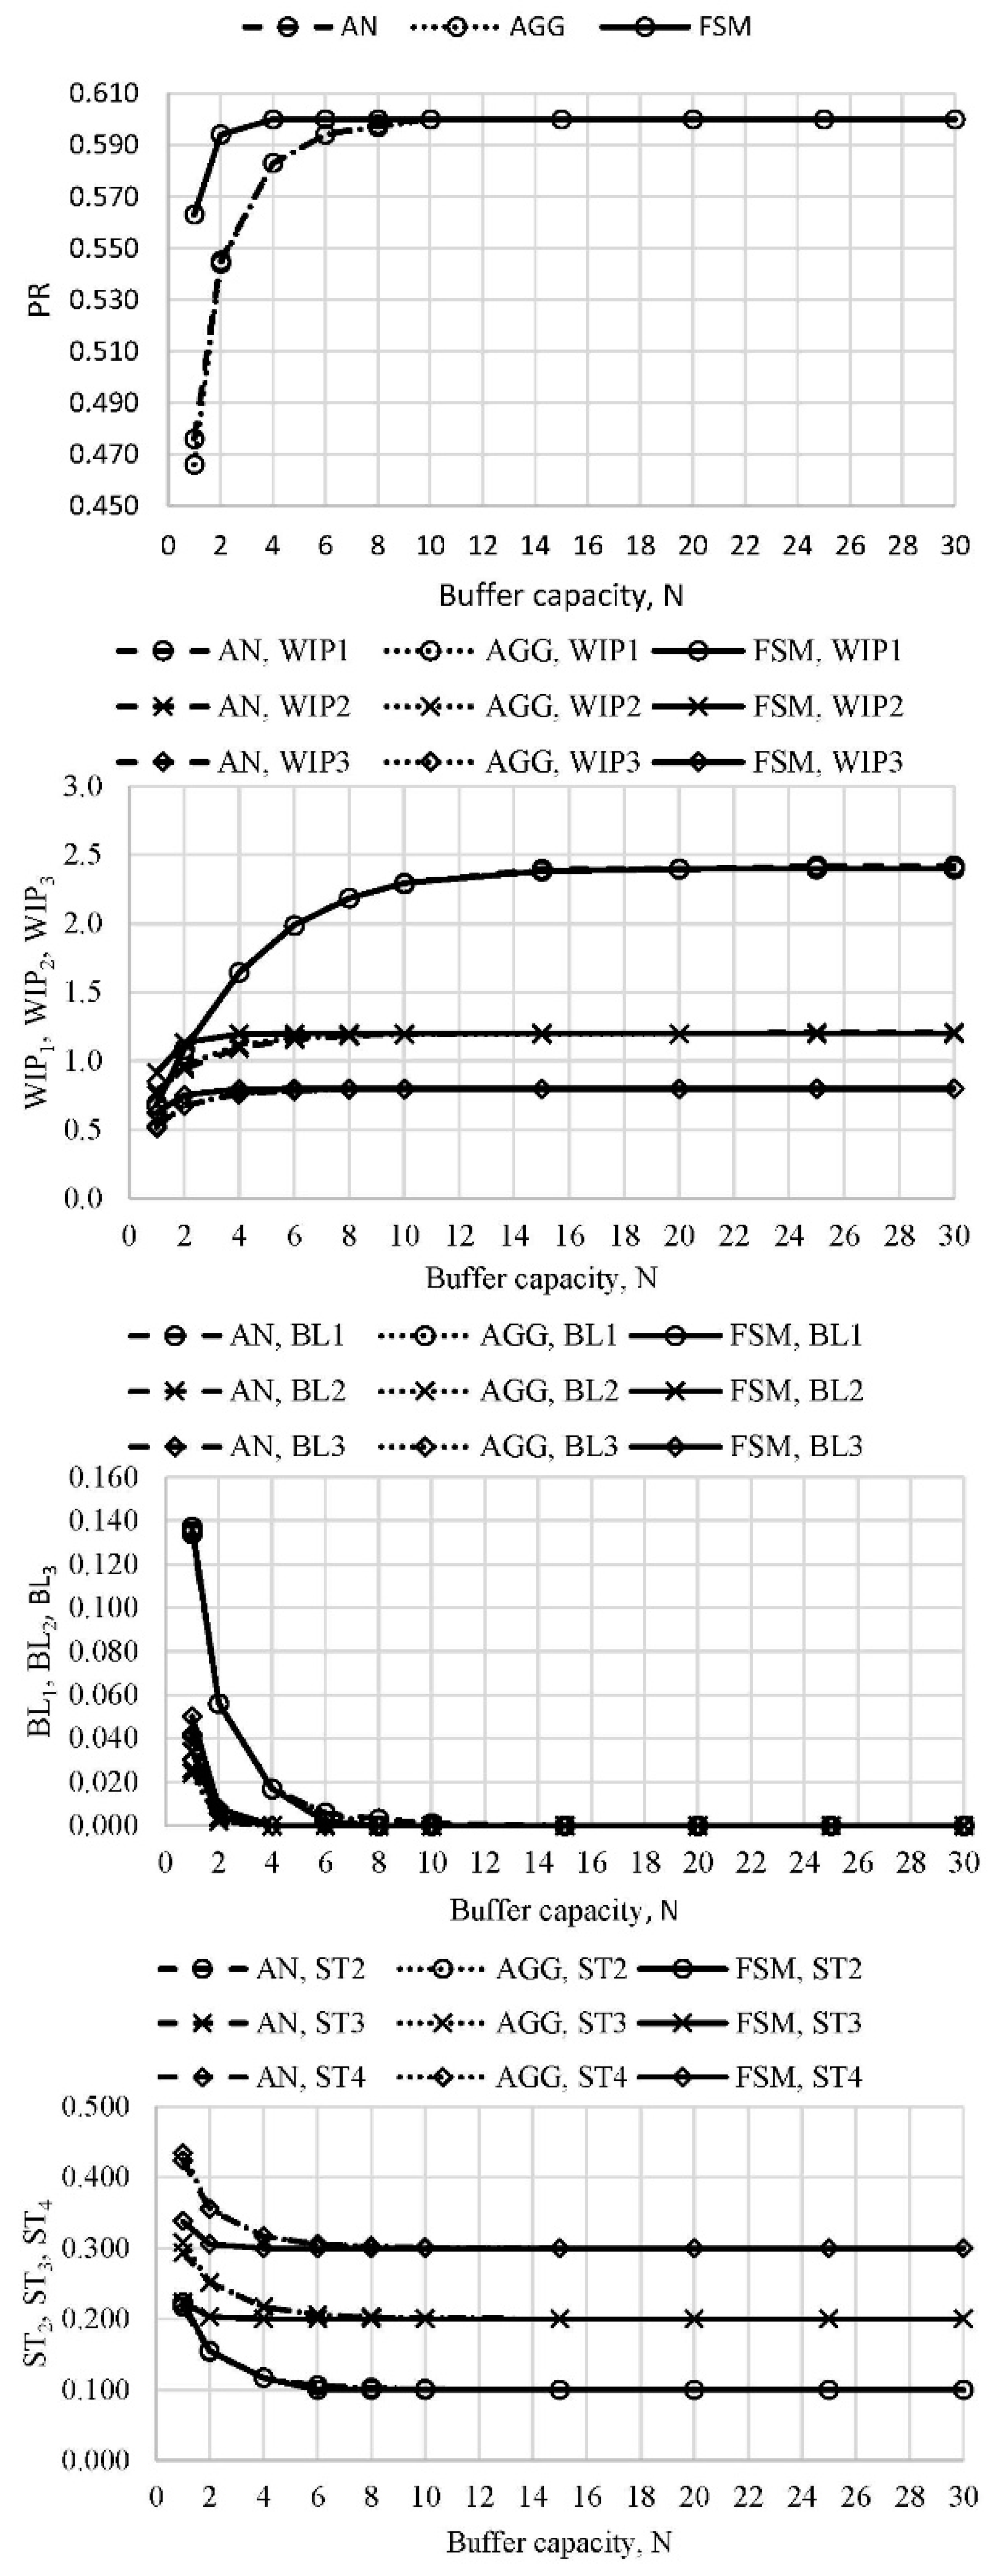
Figure 6. Performance measures of the line L3A (N1 = N, N2 = 2N, N3 = N) (authors’ work).
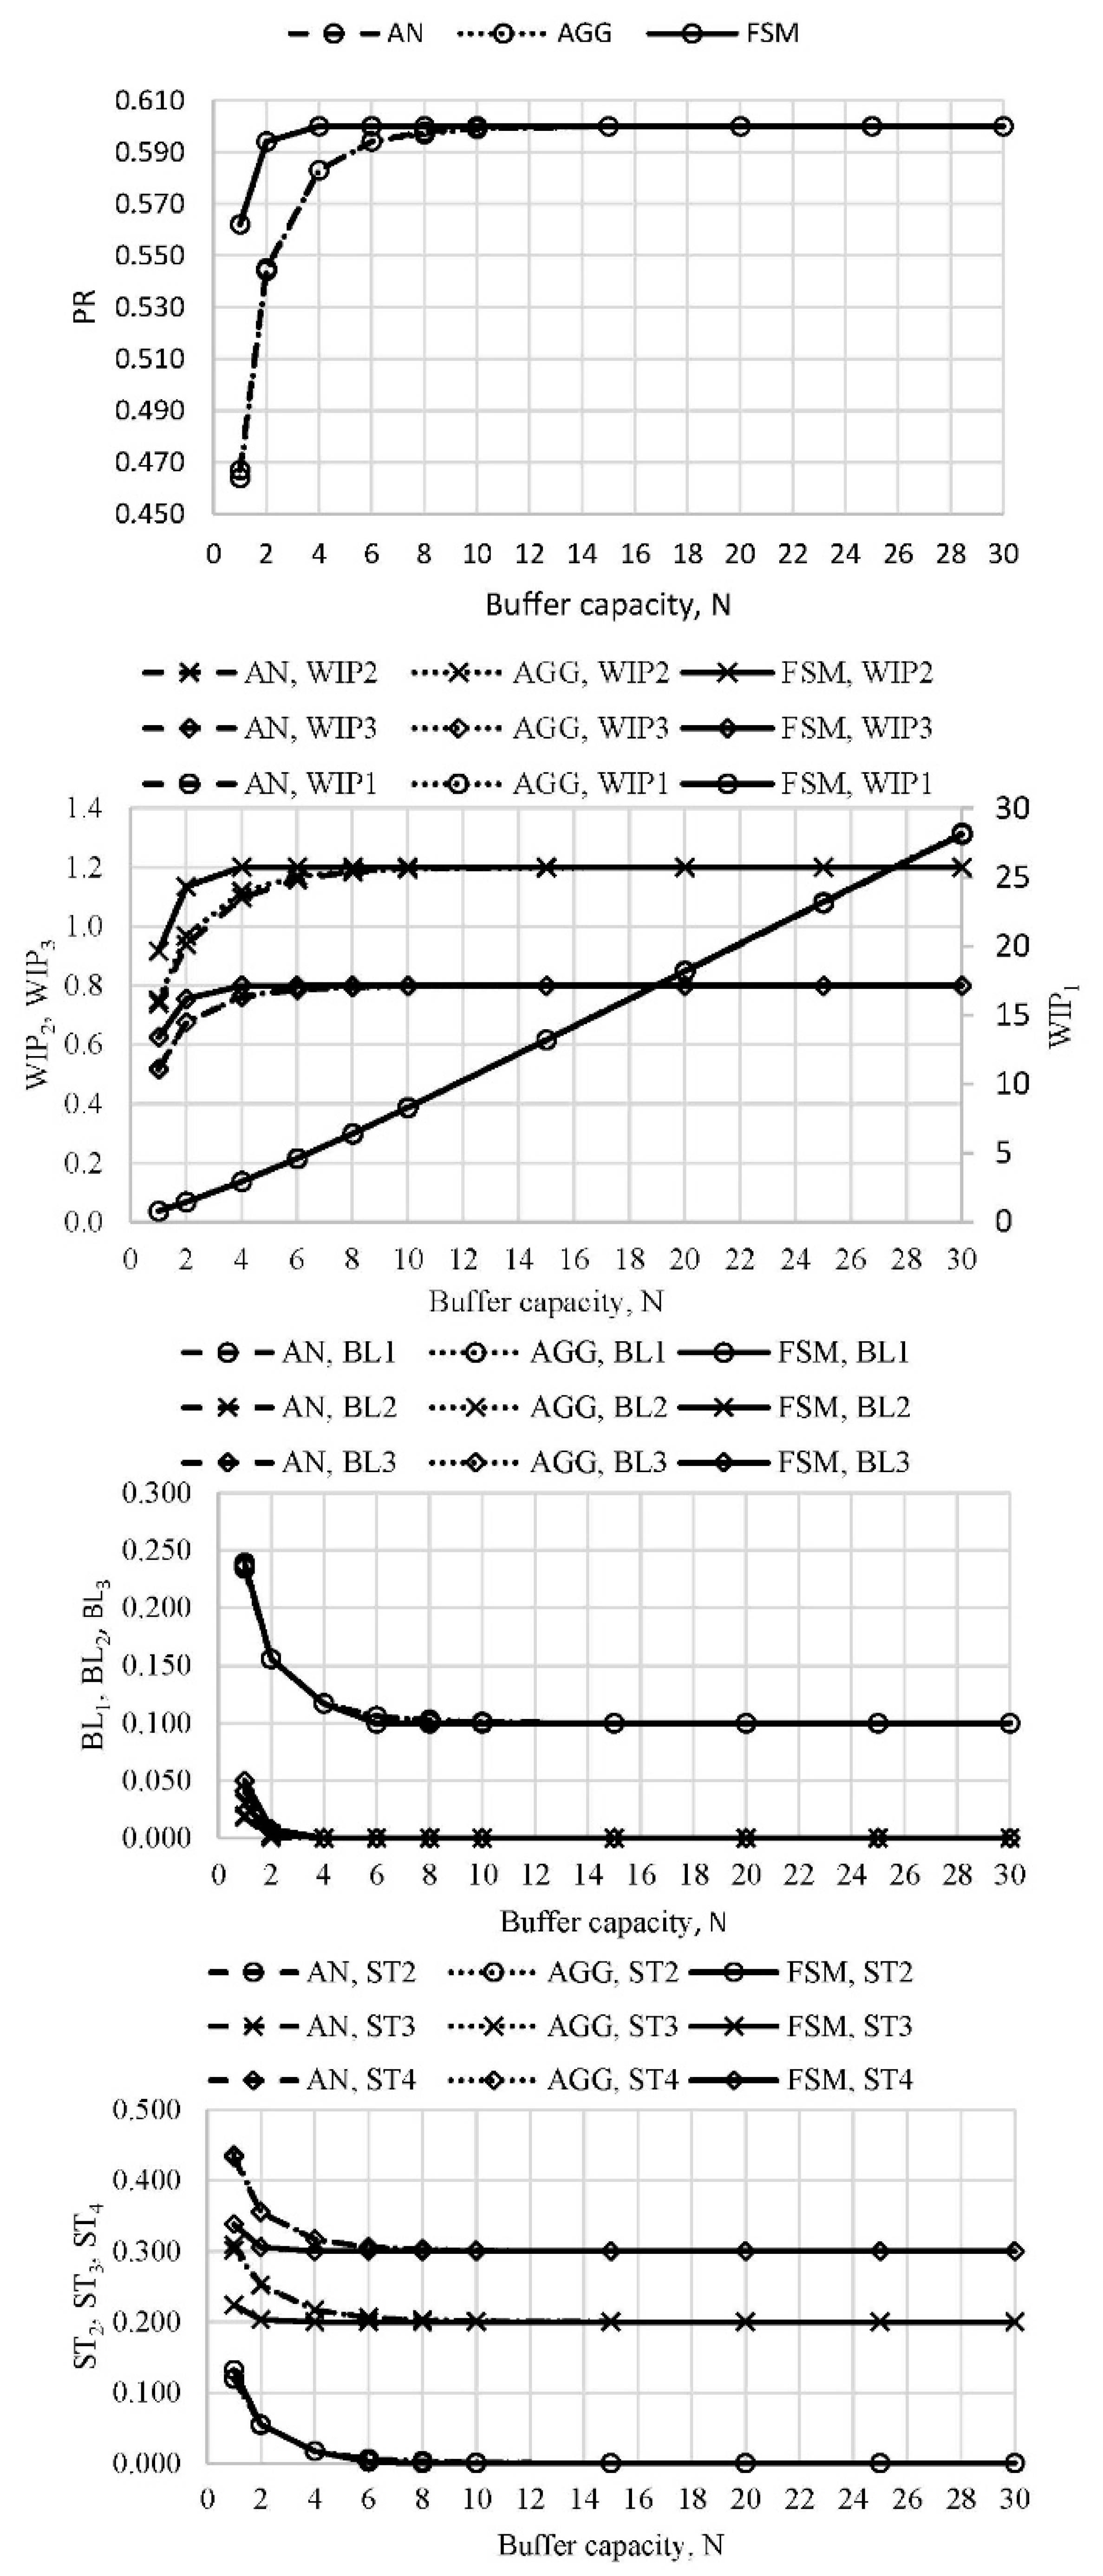
Figure 7. Performance measures of the line L3B (N1 = N, N2 = 2N, N3 = N) (authors’ work).
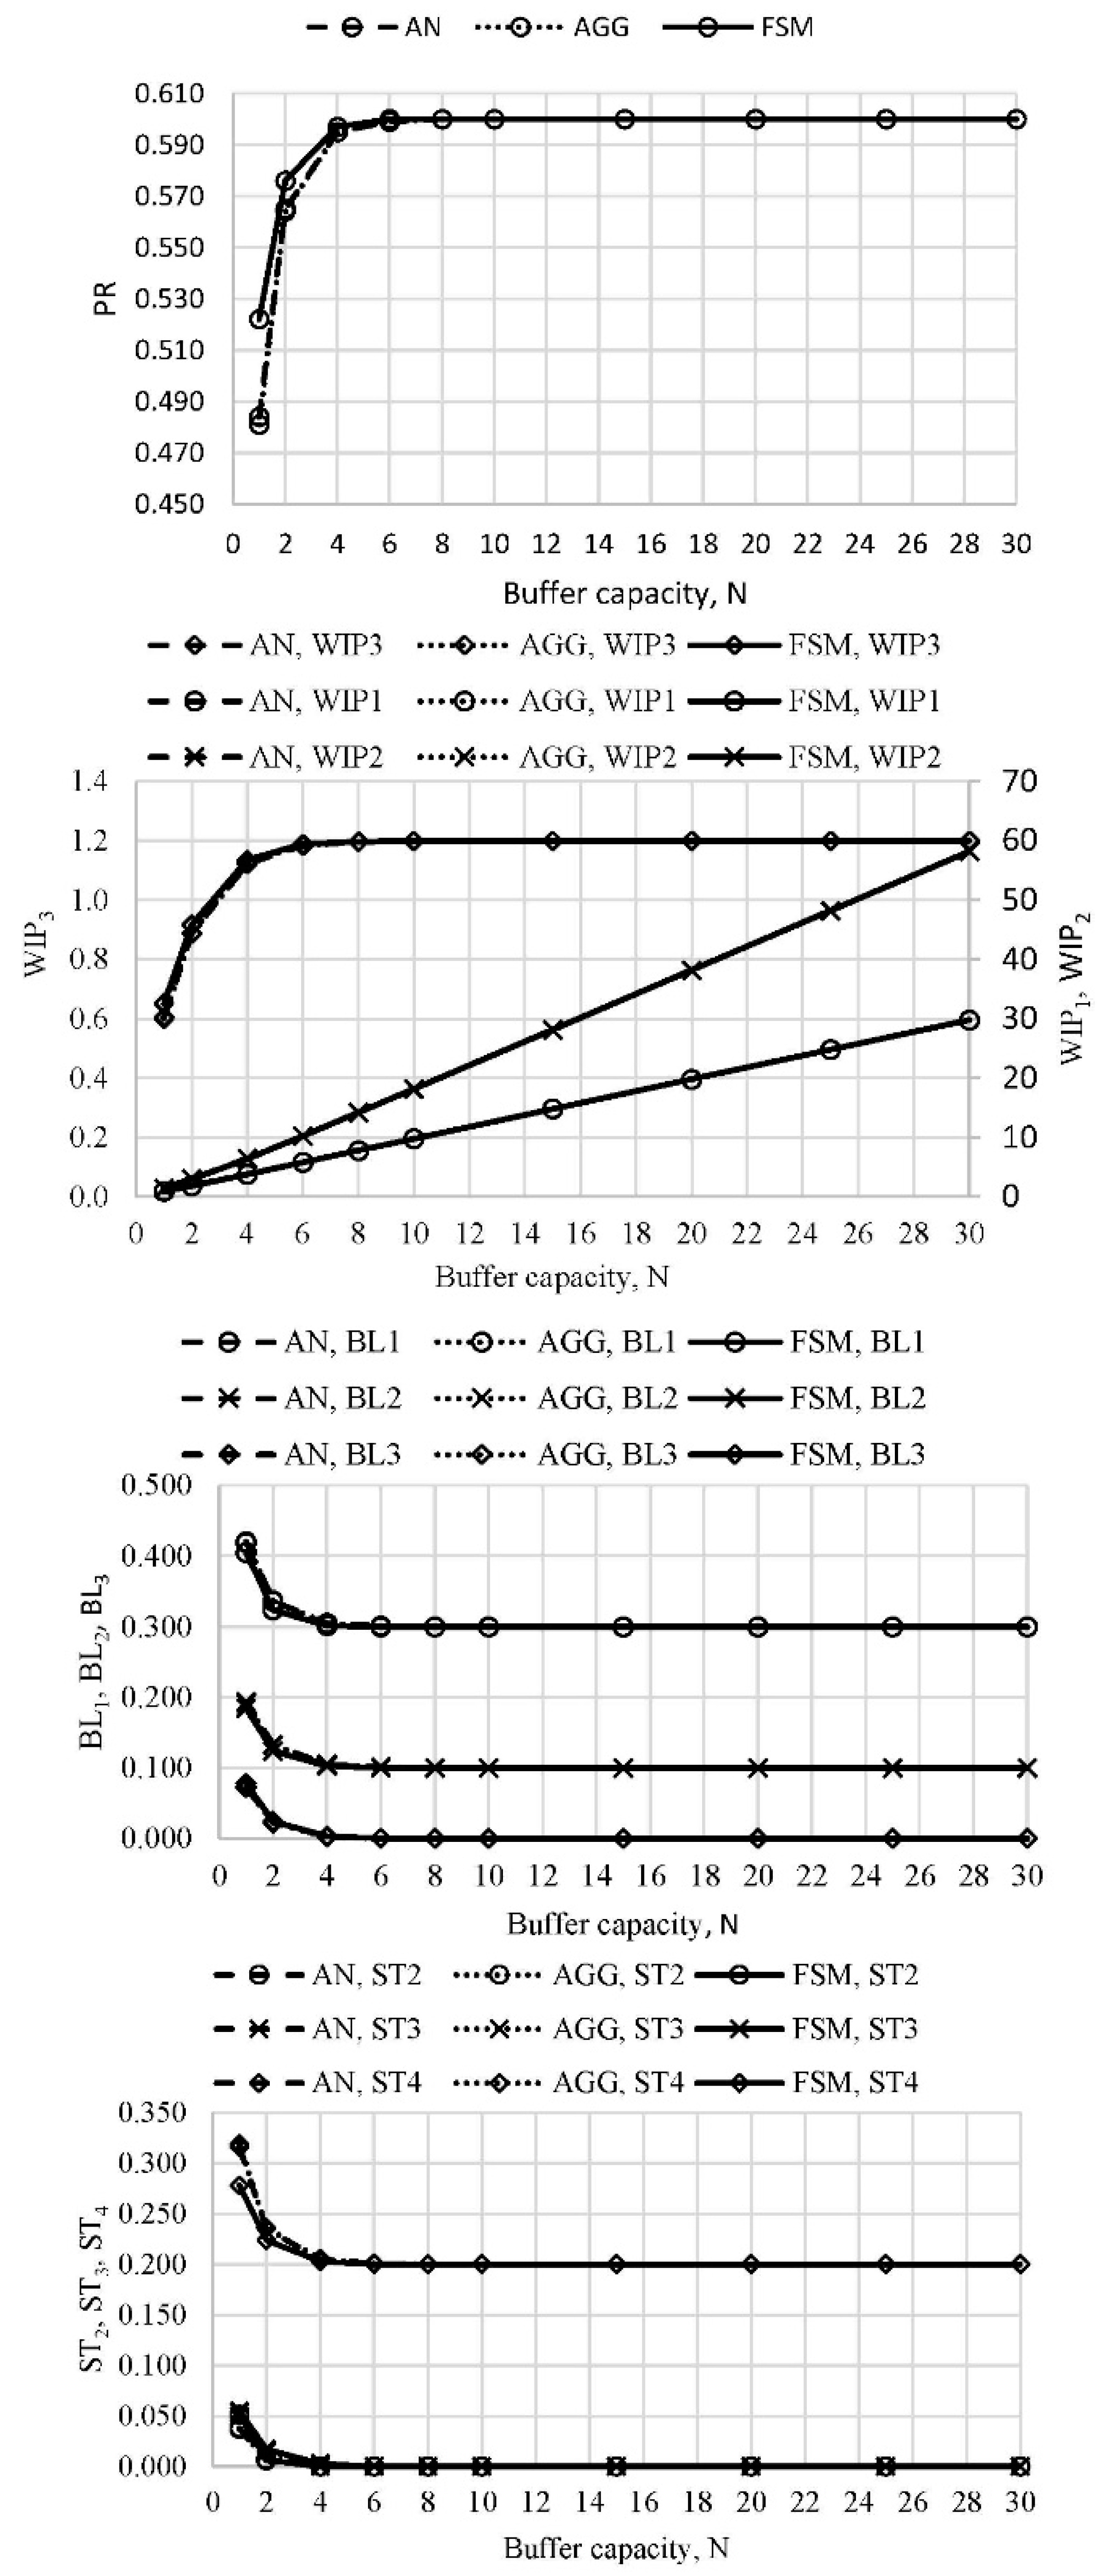
Figure 8. Performance measures of the line L3C (N1 = N, N2 = 2N, N3 = N) (authors’ work).

Figure 9. Asymptotic occupancies of buffers, lines L4–L9 (authors’ work).
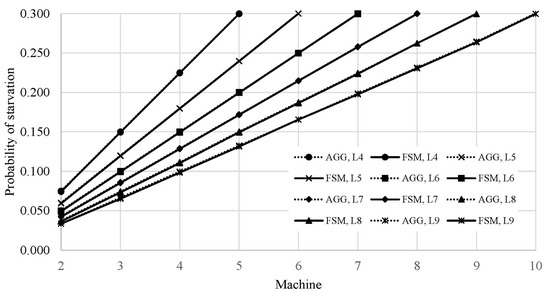
Figure 10. Asymptotic probability of the starvation, lines L4–L9 (authors’ work).
Manufacturing is of great importance for the global economy and society. It is, therefore, of great significance to master the analysis and design of various production systems. In that respect, research on the performance measures evaluation of the Bernoulli serial production lines was presented in this paper. Several important aspects of the modeling and analysis using transition systems within the Markovian framework were addressed, including analytical and approximation methods. The “dimensionality curse” problems of the large scale and dense transition systems in the PSE field were pointed out as one of the main research and development obstacles.
Given that, a new analytically-based FSM approach was developed based on the proportionality property of the stationary probability distribution across the systems’ state space. An analytical solution of the two machine-one buffer line was exploited to formulate finite state elements used to model a complete Bernoulli serial production line. Simple and differentiable expressions for the performance measures including the production rate, the work-in-process, and the probabilities of machine blockage and starvation were developed. The FSM accuracy and applicability were successfully validated by comparing the obtained results against the rigorous analytical solution. In addition to that, a thorough validation of the aggregation method was provided, proving its accuracy and applicability. Currently, the FSM is limited to the evaluation of the single product lines as the cycle time was assumed to be equal at each machine along the line. Other limitations are related to the assumption of a Bernoulli reliability model of each machine along the line as well as to the assumption of occurrence of the machine breakdowns and repairs at the beginning of each cycle which may not be in complete agreement with the real production system.
Further research in the PSE field, as well as further development and application of the FSM, should focus on the analytical formulation of problems like improvability analysis, design of lean production lines, closed Bernoulli lines, Bernoulli lines with rework, assembly systems, the steady-state and transient behavior of transition systems, etc. Additionally, further effort should be put into FSM modeling of the production lines involving multiple products of different processing times. Such research will make it possible to model complex stochastic relationships in cases of systems like ship production or other job shop production systems. A significant impact on the PSE research body would also be accomplished in case of validation of the evaluation methods against the factory floor data. Last but not the least, it would be interesting to research a possibility to apply the FSM approach in cases of other large scale transition systems typically encountered in fields of physics, biology, chemistry, ecology, etc.


