1000/1000
Hot
Most Recent
 +1 point
The localized surface plasmon resonance (LSPR) phenomenon is known to be responsible for the unique colour effects observed in the ancient Roman Lycurgus Cup and at the windows of the medieval cathedrals. In both cases, the optical effects result from the interaction of the visible light (scattering and absorption) with the conduction band electrons of noble metal nanoparticles (gold, silver, and gold–silver alloys). These nanoparticles are dispersed in a dielectric matrix with a relatively high refractive index in order to push the resonance to the visible spectral range. At the same time, they have to be located at the surface to make LSPR sensitive to changes in the local dielectric environment, the property that is very attractive for sensing applications.
The human olfactory system (Figure 1) is used to evaluate the quality of food, drinks, perfumes, cosmetics, and chemical products. Unfortunately, the nose is capable of sensing only a small part of the available chemical species in air. Furthermore, the sensation, perception, and detection limit depend upon each person’s anatomy, experience, and memory. For these reasons, and in order to find reliable alternatives to the nonportable gas chromatography and mass spectrometry analytical techniques, portable gas sensors, also known as electronic-nose (e-nose) systems, have been the focus of several research projects [1]. These e-nose systems found their inspiration on the human olfactory system, as compared in Table 1. It consists of (i) a system to feed the gas (to mimic the nose), (ii) a sensor array (to mimic primary neurons in the cribriform plate), (iii) data preprocessing (to mimic secondary neurons), and (iv) the analysis and pattern recognition system (mimicking the brain). The e-nose is thus a collection of different individual gas sensors that work together to give an overall signal that will allow for a pattern recognition, which is a characteristic of the chemical species of interest.
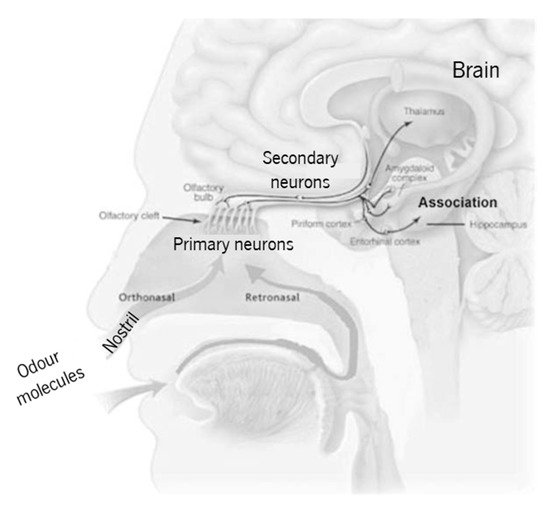
Figure 1. Simplified schematics of the human olfactory system (adapted from Lafreniere and Mann [2], copyright 2009 Elsevier).
Table 1. Odour molecules’ ordered pathway comparison in the olfactory and electronic nose systems.
| Olfactory System | Electronic Nose System |
|---|---|
| i. Nostril | i. Sampler |
| ii. Primary neurons | ii. Sensor array |
| iii. Secondary neurons | iii. Signal conditioning and processing |
| iv. Brain | iv. Pattern recognition |
The first demonstration that a semiconductor (germanium, Ge) modifies its resistance depending on the surrounding atmosphere was made by Brattain and Bardeen in 1953 [3]. Their experimental schematics and monitoring example with oxygen are represented in Figure 2a-i,a-ii. In 1954, Heiland [4] described that metal oxides such as zinc oxide (ZnO) modify their semiconducting properties with a change in the partial pressure of oxygen in the surrounding atmosphere. The first gas sensing system was reported in 1964 by Wilkens and Hartman [5], which electronically mimicked the olfactory process (e-nose) using oxidation–reduction reactions of several odorants on distinct microelectrodes Figure 2b. In 1971, Taguchi patented the first gas sensing device, using tin dioxide (SnO2) as the sensitive material [6].
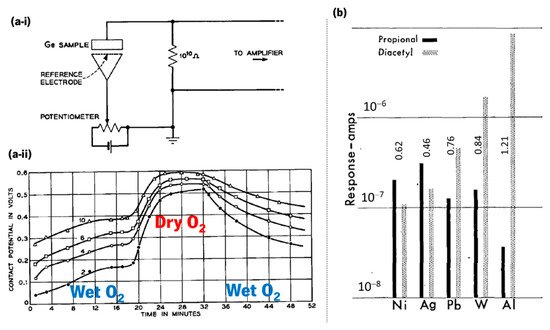
Figure 2. (a-i) Schematics of the experimental circuit used by Brattain and Bardeen in 1953 that used germanium and a platinum reference electrode to demonstrate a resistance-dependence on the surrounding atmosphere, and (a-ii) contact potential measured in a monitoring cycle when germanium is exposed to wet O2 and dry O2 (reused with permission of Nokia Corporation and AT&T Archives, from Brattain and Bardeen [3]). (b) Effect of electrode metal on response amplitude at polarization current of 6 × 10⁻⁷ A (adapted with permission from Wilkens and Hartman [5], copyright 2006 John Wiley and Sons).
In the 1980s, the field of semiconductor sensors underwent a significant expansion [7] that led to the appearance of dedicated international peer reviewed journals such as Sensor Review, in 1981 (Emerald Group Publishing Ltd.) and Sensors and Actuators, in 1989 (Elsevier). However, the study of portable gas sensing systems only made its rapid progress since the publication in 1994 of a review on the e-nose, by Gardner and Bartlett [8].
Molecules interact with thin film sensors by adsorption (physisorption or chemisorption) or chemical reaction. These processes lead to a physical change in the film (sensor) that can be detected by variations in conductivity [8][9], mass [10], work function [11], or an optical property [12][13][14][15][16][17][18][19][20][21].
Most of the researched and established sensors use the conductivity change (Figure 3) of a given material as a signal, but they have low specificity, are susceptible to electrical noise, and the wiring needed complicates their implementation in some harsh environments. With the development of new technologies for the production of high quality optoelectronic components, optical sensors have undergone a large development over the past decades [22]. Optical sensors show excellent characteristics of sensitivity, selectivity, long lifetime, and fast response [6]. Therefore, they have attracted a great deal of attention for analytical applications, such as environment, industrial, and health monitoring. Furthermore, they have a straightforward working principle and simple hardware configuration, consisting of the sensing platform, a light source, optical fibres, a light detector, a processing unit, and pattern recognition software [22][23], following the same scheme of Figure 1b. The sensing mechanism is based on detecting a change in the light beam (frequency or wavelength, polarization, phase, or intensity) when the gas molecules interact with the sensing platform.
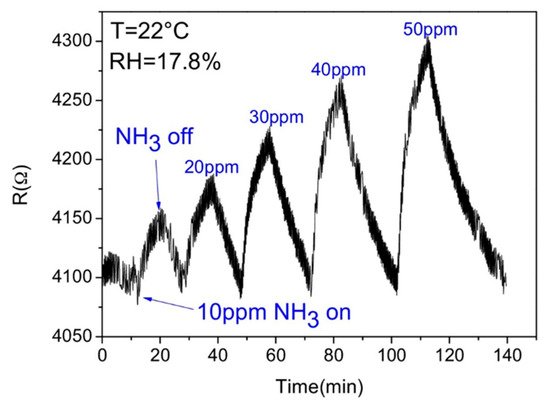
Figure 3. Response of a reduced graphene oxide-based gas sensor (adapted from Li et al. [8], copyright 2016 Elsevier).
Nanomaterial-based sensors are a hot topic currently, especially for massive volume applications in the industrial, healthcare, consumer, and motor vehicle sectors, since they substantially reduce the size of the devices, with high-sensitivity, shorter response time, and real-time monitoring capabilities [24]. The world market for chemical sensors is projected to reach EUR 36,100 million by the year 2024 [25], with a growing demand that will be fuelled by new applications for established sensor products, product innovation, and falling cost of high-performance sensors. In particular, gas sensors are expected to reach 1400 million by the year 2024 (of which EUR 360 million in Europe) [26], powered by automotive, smart cities, building automation, medical, and other industrial applications (summary in Table 2). The main objective of these sensors is the detection of species that are “odourless” for humans, which can be harmful when their concentration is critical (such as carbon monoxide, CO [27][28]); below a certain limit (such as oxygen, O2 [29]); or dangerous when they are both volatile and inflammable (such as ethanol, C2H6O, or others [30]).
Table 2. World market projection for sensors, 2024.
Noble metals such as gold (Au) and silver (Ag) have been used since antiquity for decorative applications, and currently inspired several other practical uses in different scientific and technological areas [31]. Among several examples where noble metal-based colours can be found, the most ancient and fascinating one is the famous fourth century AD Lycurgus Cup displayed in the British Museum, London (Figure 4a).
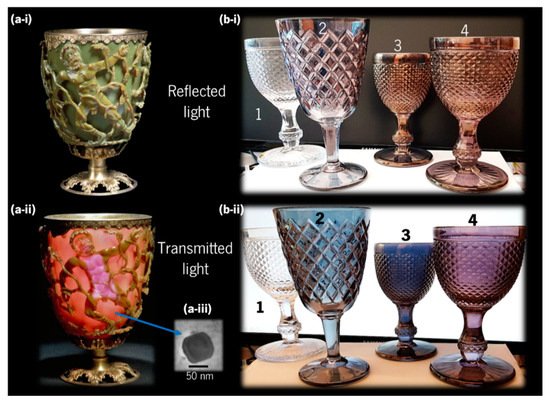
Figure 4. (a) Lycurgus Cup, a Roman glass from the fourth century AD, depicting a mythological scene, with King Lycurgus being entangled by Ambrosia, which was transformed into a vine-shoot by Dionysus (the Greek god of wine), currently held at the British Museum, London; it looks (a-i) “opaque pea-green” with reflected light, and (a-ii) “deep wine-red” with transmitted light (copyright 2021 The Trustees of the British Museum), due to (a-iii) Ag-Au alloy nanoparticles (adapted from Barber and Freestone [32], copyright 2007 John Wiley and Sons). (b) Glass cups coated at CF-UM-UP, University of Minho, with different nanocomposite thin films (1–uncoated glass; 2–Au-TiO2 with low gold concentration; 3–Au-TiO2 with higher gold concentration; and 4–Au-Al2O3) showing different colours with (b-i) reflected light and (b-ii) transmitted light.
In the 1960s, several chemical analyses were conducted on pieces of this Roman cup that revealed very small concentrations of gold (0.004 at.%) and silver (0.03 at.%) [32]. Later in the 1990s, with the advances in transmission electron microscopy (TEM) and energy dispersive X-ray spectroscopy (EDX), Barber and Freestone were able to explain the unusual optical properties such as a dichroic effect, i.e., the ability to change colour when illuminated from the outside or from within, looking as “opaque pea-green” in reflected light, and “deep wine-red” in transmitted light [32]. They found that Ag–Au alloy nanoparticles (Figure 4a-iii) with traces of copper (Cu) (Ag 66.2 at.%, Au 31.2 at.%, Cu 2.6 at.%) were responsible for the red transmission colour, while larger Ag nanoparticles were generating the green reflection colour [32]. Similar colours were demonstrated experimentally by Dekker et al. using solutions of Au and Ag nanoparticles [33]. Regarding the manufacture of the Lycurgus Cup, it is believed that it was made from a 15 mm-thick blown glass blank (a thick piece of glass with the overall shape of the final piece that undergoes additional decorations), and that the figures were cut, ground, and pressed to their actual shape [34]. Although the Roman glass industry was mature since the first century AD, the production method of the glass blank itself is still unclear. Modern methods of preparing colloidal noble metals were only developed after the 12th century and reported in the 17th century, so some theories speculate about successive grinding and melting of the glass, with several metals and metallic oxides added, in several steps. However, the existence of only six other broken pieces worldwide, from the same period, showing a similar but fainter dichroic effect has led some researchers to believe that the achievement of such an optical effect was most probably occasional, rather than the intentional work of a skilful craftsman [34][35].
With the advancements in nanotechnology, these optical effects can now be easily reproduced using thin film coatings deposited (e.g., by sputtering) directly on common glass, as exemplified in Figure 4b. In this case, the glasses were coated with a nanomaterial containing Au nanoparticles, embedded in an oxide matrix that protects them from mechanical abrasion, allowing to mimic the dichroic effect seen in ancient stained-glass. Cup number 1 is the uncoated reference, cup 2 and 3 were coated with Au nanoparticles embedded in titanium dioxide, TiO2, (cup 3 has a higher gold amount than cup 2), and cup 4 was coated with Au embedded in aluminium oxide (Al2O3). More details about the preparation of these thin films can be found elsewhere [36].
Another remarkable ancient use of gold and silver for decorative purposes is the stained-glass windows of medieval cathedrals. For example, in the “rose windows” of the gothic Notre-Dame Cathedral (Figure 5a) from the 13th century, in Paris, the presence of noble metal nanoparticles with different sizes and geometries embedded in the glass [31] yields magnificent colours that can be observed from inside the cathedral (transmitted light), Figure 5b-i,b-ii, while outside (reflected light) these colours appear very different, Figure 5c-i,c-ii.
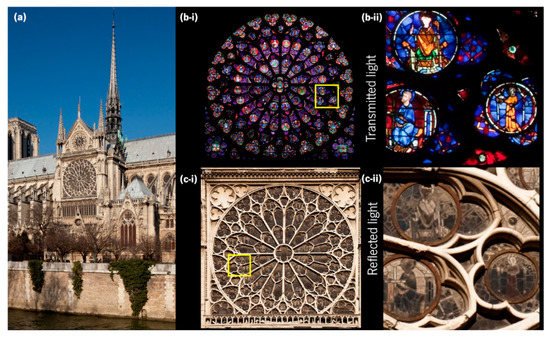
Figure 5. (a) Notre-Dame Cathedral, Paris showing the south facade, and the southern rose window, photographed from (b-i) inside and (c-i) outside. A detail of the southern rose window photographed from (b-ii) inside and (c-ii) outside (mirrored) (adapted with permission from Pascal Lemaitre Photographe, copyright 2021).
Although the aforementioned colour effects have been used for several centuries, their physical interpretation only started to gain relevance by the end of the 19th century and beginning of the 20th [37]. Particularly interesting was the theory proposed by Gustav Mie in 1908, who worked out a solution of Maxwell’s equations to calculate the extinction spectrum of a spherical particle illuminated by a time-harmonic electromagnetic field. The solution is an infinite series expansion with different terms corresponding to the n-th order multipoles of the sphere. The coefficients of this expansion are expressed in terms of the Riccatti–Bessel functions of the order n and the argument called the size parameter, x=2πnsa/λ0 (ns=√ϵs and a are the refractive index and the radius of the sphere, respectively, and λ0 is the wavelength in vacuum). If x≪1, i.e., the particle is much smaller than the wavelength of the incident electromagnetic wave, only dipolar response may be considered, that is, the particle acts as an electrical dipole induced by the incident field (Figure 6a), p→=ϵmαE0−→, where ϵm is the permittivity of the surrounding medium and α is particle’s polarizability,
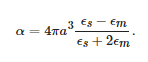
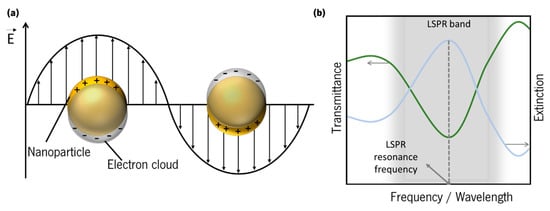
Figure 6. (a) Schematics of localized surface plasmons of a metal sphere. (b) Schematics of a typical LSPR band, measured in transmittance mode, and extinction spectrum.
If the sphere is metallic, the permittivity, \( \epsilon _s \), is a complex function of the wavelength, so is the polarizability, and the particle both scatters and absorbs light. The extinction cross-section is a measure of both processes together, although the absorption dominates for small particles (\( x\ll 1 \)) and it is given by [38]:
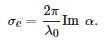
The extinction depends on the dielectric functions of both the metal and host matrix, and the particle volume, v=4πa3/3.
This expression for the polarizability can be extended to the case of an ellipsoid, where α is a tensor with the principal components given by similar formulae,
where ηi are geometrical factors known as the depolarization coefficients [38][39]. They have the following property: ∑iηi = 1. These formulae are commonly used to describe elongated nanoparticles, for instance, metallic nanorods.
Even though the classical treatment of Mie and its extensions to ellipsoids continue to be used to describe individual nanoparticles, it is not appropriate for more complex systems, where it is necessary to consider electromagnetic interactions between different parts of the system (e.g., different nanoparticles). Such systems, e.g., plasmonic nanostars [40] have more complex absorption and scattering spectra, which, in principle, can be understood by considering a set of interacting dipoles that can support collective electromagnetic modes. Such modes also can be excited by incident light.
In the 1950s R. H. Ritchie, who studied the characteristic energy losses of accelerated electron beams passing through thin films, triggered new developments on the subject at the experimental level, culminating in the demonstration, by Powell and Swan, of the existence of self-sustained collective excitations at metal surfaces, named thereafter as surface plasmons by Stern and Ferrell [41]. Using a similar experiment Ritchie, Otto, and Raether-Kretschmann demonstrated, independently, that propagating surface plasmons on a metal surface can also be excited by light [37]. It should be remembered that the propagating surface plasmons are characterized by a well-defined wavevector component along the surface, which is larger than any propagating photon of the same energy could have. The problem of wavevector matching can be bypassed by using a prism (so called Kretschmann and Otto configurations) or using surfaces with modulated conductivity [42]. It does not exist for confined geometries (e.g., for a spherical particle) because the wavevector is not well defined and its conservation in plasmon–light interaction is relaxed.
About two decades later, in 1974, Fleischmann, Hendra, and McQuillan reported, for the first time, the phenomenon of surface-enhanced Raman scattering (SERS) occurring on structured metallic surfaces and thus made a decisive contribution to the general interest in surface plasmons [43]. Since then, there have been significant advances in both theoretical and experimental research on surface plasmons, which led to the development of new simulation methods to calculate the optical properties of plasmonic systems [37][44][45][46], and has delivered a relevant number of important applications [47][48].
Noble metals (e.g., Au, Ag) are excellent electrical conductors due to the typically long mean free path of the electrons in the s-type conduction band. A quantum of their collective oscillations is called a plasmon. The term is also used to loosely refer to these kinds of elementary excitation, which are oscillations of the electron density accompanied by an electromagnetic field. Plasmons can arise in bulk materials (volume plasmons), or at the interface between two materials (surface plasmons–SPs) [49]. The excitation of SPs occurs when they interact with an incident electromagnetic field of frequency close to their natural oscillation frequency. SPs are divided into two main fundamental excitations: (i) surface plasmon polaritons (SPPs), which are evanescent electromagnetic waves coupled to the electron plasma of a metal and propagating along its surface [41][49][50]; and (ii) localized surface plasmons (LSPs), Figure 6a, which are nonpropagating excitations of the conduction band electrons in subwavelength metallic nanostructures, coupled to a confined electromagnetic field [49][51][52][53].
To comply with energy and momentum conservation laws, SPPs cannot be excited directly by a propagating photon in air, since their momenta do not match [54], while LSPs have the advantage of coupling directly to photons. These frequency dependent coupling processes are commonly known as surface plasmon resonance (SPR) and localized surface plasmon resonance (LSPR), whether they occur, respectively, in a metal surface/dielectric interface, or in a metal nanoparticle or nanostructure. The LSPR band can be detected in an optical transmittance spectrum by a depression zone, and the LSPR resonance frequency corresponds to the maximum of the extinction (absorption + scattering) (Figure 6b). Thus, optical transmittance-LSPR (T-LSPR) is a simple technique by which the LSPs can be excited by the traversing light.
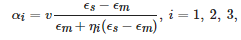
Different-order LSPRs are predicted by the Mie theory for a metallic sphere. The dipole resonance is determined by the pole of the particle polarizability, ϵs+2ϵm=0. Noteworthy is the dependence of the LSPR frequencies on the dielectric constant of the surrounding medium, which is the basis for the sensing applications of plasmonic nanoparticles. For a spheroidal nanoparticle, LSPRs can be split into two frequencies, corresponding to the poles of two unequal components of the polarizability tensor, αi [55]. Taking the noble metal permittivity within the simplest Drude model, the LSPR frequencies are given by:
where ωp is the plasma frequency of the bulk metal and η|| and η⊥ are the corresponding depolarization coefficients. The two resonances correspond to the electric field directed along or perpendicular to the longer axis of the spheroid, respectively. The separation in frequency between them can be very large for elongated nanoparticles.
The plasmonic resonances are broadened because of several natural reasons, which include shape and size dispersion in nanoparticle ensembles, and the electron scattering in each individual particle. Bulk plasmons are damped mostly because of the electron–phonon interaction and in small particles there is an additional source of damping called surface scattering, for which it has been shown that it increases linearly with the inverse of the radius in the small size regime (less than 25 nm) [56]. All these factors result in a broadened LSPR band. Thus, the curvature of the band depends basically on the nature of the nanoparticles and their distribution, and on the surrounding dielectric function [51].
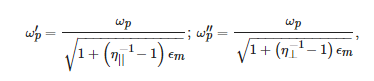
Although it may be counterintuitive, the awareness of the resonant properties of plasmonic metal nanoparticles is readily apparent to the naked eye. Since the nanoparticles absorb and scatter visible light, they can generate a wide palette of colours, depending on their concentration, geometries, and dimensions, and on their surroundings [57][58][59][60]. As can be seen in Figure 7a, by increasing the size of the Au nanoparticles (observed using scanning electron microscopy—SEM), the LSPR band shape changes smoothly, thus altering the colour [61]. On the other hand, if the “same” nanoparticles are embedded in different materials, the LSPR band resonance will be shifted to higher or lower wavelengths, whether the surrounding refractive index is higher or lower, thus changing the colour of the material. An example of this colour change is shown in Figure 7b when only the material surrounding the Au nanoparticles is changed, from a refractive index of 1.33 (water) to 1.7 (poly(vinyl alcohol), PVA) [62]. Moreover, by changing the shape of gold nanoparticles (Figure 7c) [58], from nanospheres to nanorods or nanostars (the shape is observed in the transmission electron microscopy, TEM, images), the LSPR band on the optical absorption spectra also changes, and hence the colour, from deep-red to sky-blue. Furthermore, the adjustment of the aspect ratio (AR) of gold nanoparticles from 1.1 to 2.8 [59] (Figure 7d) redshifts appreciably the longitudinal LSPR band (ω′p), thus changing considerably the colour.
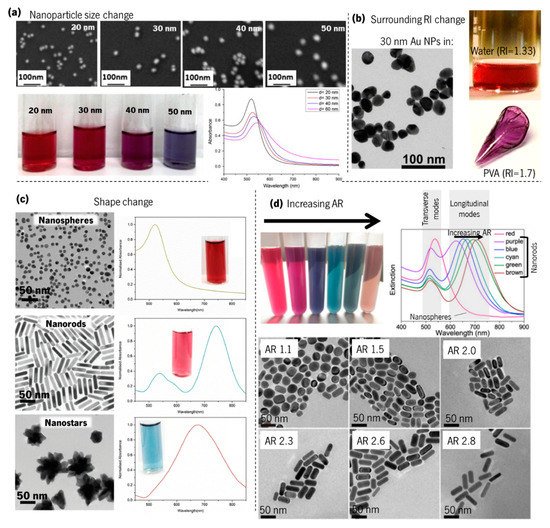
Figure 7. Influence of Au nanoparticles size, shape, and surrounding dielectrics on the LSPR band curvature and colour. (a) SEM images of colloidal Au nanoparticles with increasing size, corresponding colours, and LSPR band by UV–Vis spectroscopy (adapted from Notarianni et al. [61], copyright 2014 Elsevier); (b) TEM images of 30 nm Au nanoparticles, and photographs of the same Au nanoparticles immersed in water and poly(vinyl alcohol) (PVA) (adapted from Pluchery et al. [62]. copyright 2013 Springer); (c) TEM images of Au nanospheres, nanorods, and nanostars, with the corresponding LSPR observed by UV–Vis spectroscopy and colour (adapted from Adnan et al. [58], copyright 2016 The Royal Society of Chemistry). (d) Colloidal gold nanorods solutions with six different colours and their corresponding UV–Vis extinction spectra, and TEM images showing the nanorods with different aspect ratios (AR) (adapted with permission from Zhang et al. [59], copyright 2016 The Optical Society).
Beyond the already mentioned decorative field, several other applications based on the LSPR phenomenon have shown very promising impacts. As a matter of fact, due to their high sensitivity to the surrounding dielectric environment, plasmonic metal nanoparticles have received considerable attention over the past decade for sensing applications. Among them are the detection of biomolecules by plasmonic sensing [63][64][65][66][67][68][69][70] using several methods, as depicted in Figure 8a,b. To analyse the LSPR band curvature changes in sensing experiments, Rodrigues et al. [71] developed a software that calculates several parameters of the LSPR band, such as the (i) wavelength and transmittance coordinates of the optical transmittance spectrum minimum, (ii) several transmittance values at discrete wavelengths, and (iii) the (statistic) first central moments of the normalized spectral distribution.
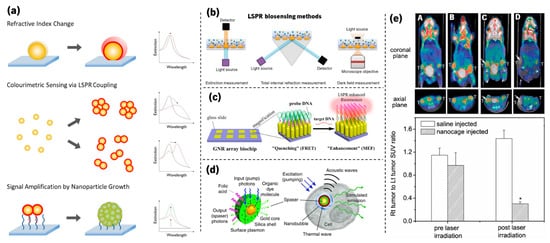
Figure 8. (a) Illustration of strategies used to develop plasmonic nanosensors (adapted from Guo et al. [64], copyright 2015 Elsevier). (b) Schemes for LSPR biosensors through extinction measurement, total internal reflection measurement, and darkfield measurement microscopy (adapted from Lopez et al. [70], copyright 2016 De Gruyter). (c) Schematic of an ordered gold nanorod array chip for plasmon-enhanced fluorescence (PEF) DNA detection based on a molecular beacon (adapted from Mei and Tang [72], copyright 2017 American Chemical Society). (d) Schematic of a localized surface plasmon amplification by stimulated emission of radiation (spaser) as a multimodal cellular nanoprobe (adapted from Ekaterina et al. [73], copyright 2017 Springer Nature). (e) PET/CT coregistered images of mice intravenously administrated with either saline or Au nanocages, followed by laser treatment. A—saline-injected mouse prior to laser irradiation; B—nanocage-injected mouse prior to laser irradiation; C—saline-injected mouse after laser irradiation; and D—nanocage-injected mouse after laser irradiation. (adapted from Chen et al. [74], copyright 2010 John Wiley and Sons).
Other examples that are still related to biomolecular detection are plasmon-enhanced fluorescence (PEF, Figure 8c) [72][75] and SERS [76][77][78]. Furthermore, plasmonic nanoparticles are currently used in several other fields, from the enhancement of absorbed light in solar cells [79][80][81][82] to biological imaging (Figure 8d) [83][84][73][85] and phototherapy of tumours (Figure 8e) [84][86][74].


