Submitted Successfully!
To reward your contribution, here is a gift for you: A free trial for our video production service.
Thank you for your contribution! You can also upload a video entry or images related to this topic.
Version Summary Created by Modification Content Size Created at Operation
1 + 4452 word(s) 4452 2021-06-29 11:49:50 |
2 format correct + 2735 word(s) 7187 2021-07-22 04:03:00 |

Video Upload Options

Do you have a full video?

Confirm

Are you sure to Delete?
Cite
If you have any further questions, please contact Encyclopedia Editorial Office.
Choi, D. Process Analytical Technology. Encyclopedia. Available online: https://encyclopedia.pub/entry/12278 (accessed on 16 April 2024).
Choi D. Process Analytical Technology. Encyclopedia. Available at: https://encyclopedia.pub/entry/12278. Accessed April 16, 2024.
Choi, Duhyung. "Process Analytical Technology" Encyclopedia, https://encyclopedia.pub/entry/12278 (accessed April 16, 2024).
Choi, D. (2021, July 21). Process Analytical Technology. In Encyclopedia. https://encyclopedia.pub/entry/12278
Choi, Duhyung. "Process Analytical Technology." Encyclopedia. Web. 21 July, 2021.
Process Analytical Technology
Edit

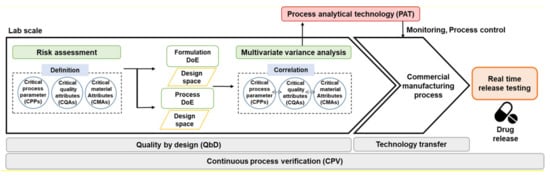
Various frameworks and methods, such as quality by design (QbD), real time release test (RTRT), and continuous process verification (CPV), have been introduced to improve drug product quality in the pharmaceutical industry. The methods recognize that an appropriate combination of process controls and predefined material attributes and intermediate quality attributes (IQAs) during processing may provide greater assurance of product quality than end-product testing. The efficient analysis method to monitor the relationship between process and quality should be used. Process analytical technology (PAT) was introduced to analyze IQAs during the process of establishing regulatory specifications and facilitating continuous manufacturing improvement. Although PAT was introduced in the pharmaceutical industry in the early 21st century, new PAT tools have been introduced during the last 20 years.

process analytical technology continuous process verification quality by design control strategy quality attributes critical process parameters

1. Introduction

Quality control in the pharmaceutical industry has traditionally depended on statistical process control (SPC) [1][2][3][4], which is used to understand the process and desired specification limits and to ensure a stable process by eliminating the allocable sources of variation. Statistical methods, including control charts and run charts, are used to inspect the quality of the post-manufacturing finished product and determine the performance suitability of unit operations in the pharmaceutical manufacturing process [1]. Moreover, most offline analyses and monitoring are conducted to evaluate the quality of the intermediate and finished products during the production batch process. For example, it is common to use control charts for monitoring general production processes, thereby ensuring that various aspects of the production process are controlled [5][6]. This traditional process verification is designed to perform process verification on finished batches under predesigned process conditions. Therefore, a disadvantage of this method is that the quality characteristics of intermediate products cannot be confirmed during the manufacturing process. Hence, identifying and solving problems that arise during the process requires a lot of time and results in relatively more high-quality defects. Moreover, there is no assurance that the entire lot conforms to the required specifications, and the method cannot be applied generally as a solution to all quality defects.
The International Council for Harmonisation (ICH) launched continuous process verification (CPV) to overcome SPC limitations, ensure process control, and improve the understanding of processes and product quality. Furthermore, ICH described CPV as an alternative approach to process validation, in which manufacturing process performance is continuously monitored and evaluated. In addition, CPV provides more information about variability and control, providing higher statistical confidence, improving the assessment of pharmaceutical manufacturing processes and higher assurance of continuous control status.
Another strategy introduced by the pharmaceutical industry to improve the understanding of the process and quality control is quality by design (QbD). QbD is defined in ICH Q8 guidelines as “a systematic approach to development that begins with predefined objectives and emphasizes product and process understanding and process control, based on sound science and quality risk management.” The development of a QbD-based pharmaceutical process involves a scientific risk-based systematic method to correlate critical process parameters (CPPs), input-materials attributes, and critical-quality attributes (CQAs) [3]. In general, QbD tools, including design of experiments (DoE), empirical modeling, and response surface analysis can develop a design space and reveal process variability during the pharmaceutical manufacturing process [7][8][9]. Unlike the existing quality by testing (QbT) system, in which the quality test of the finished product is mainly used, the QbD approach enables drug-quality management to enhance the quality of drugs based on science- and risk-based technology.
The US Food and Drug Administration (FDA)’s Center for Drug Evaluation and Research (CDER) discussed the need for FDA guidance to facilitate PAT implementation, and the FDA published the PAT guidance for innovative pharmaceutical manufacturing and quality in September 2004 [10]. It is recognized as an important paradigm shift in inspecting and approving processes for the continuous process verification of pharmaceutical production processes. This initiative is also implemented by the EMA, and the Ministry of Health, Labor, and Welfare (MHLW) in Japan adopted it immediately [11]. Interfacing manufacturing processes with analytical techniques is essential in PAT, as it facilitates process development according to QbD principles and enables real-time release testing (RTRT) [12]. PAT is applied to each unit operation in the manufacturing process; CPPs, which have a significant influence on CQAs, are controlled to present a high-quality product in the market [13][14][15].
PAT in CPV ensures product quality throughout the manufacturing process and enables the automation of transportation between product processes [16][17]. Furthermore, PAT is used as a control strategy for monitoring processes in real time, improving the understanding of the process, and RTRT [11][18][19]. The vast amount of information obtained by PAT enables rapid problem resolution, optimization, and defect detection. In addition, in the event of unexpected process changes, PAT can be applied to identify the root causes of undesired drug product-quality issues. Therefore, appropriate PAT enables the timely adjustment of process parameters, ensures good and stable product quality, and shortens the overall manufacturing time. These frameworks provide advantages that enable process control quickly and easily and are a trend that has been gradually adopted and introduced because it contributes significantly to establishing the control technology [18][19][20][21]. Furthermore, several studies have applied the QbD approach and PAT in pharmaceutical manufacturing processes [12][14][16][17][18].

2. Control Strategy for PAT Application

Appropriate control strategies should be applied during the manufacturing process to control variables affecting product quality. A control strategy comes from the understanding of products and processes and risk management. There are various approaches, such as in-process testing, RTRT, and finished product testing [11][14][15]. Traditional control strategies mostly rely on off-line analysis of finished-product testing. In addition, process verification has been performed on batches produced under predesigned process conditions. However, because it is difficult to predict the effect of process parameters during processing on finished-product quality, there is a limit to effectively controlling the process. It cannot be determined that all produced lots comply with the requirements. In addition, it is not easy to establish the feasibility of controlling the process variables of each unit process. Therefore, real-time process control is impossible and inefficient in terms of time and cost. The QbD approach has been introduced to overcome this and to improve understanding of product performance, identify critical process parameters (CPPs) during quality risk assessment of the product manufacturing process, and establish appropriate control strategies for each variable [13][22]. The QbD approach is applied for the accurate and reliable prediction of product-quality characteristics within the design space established, using each variable, manufacturing environment, and other conditions [12]. As this improves the understanding of products and processes, control strategies are applied to produce products of consistent quality that meet the desired quality attributes [23][24]. Introducing process control strategies to minimize the variability of the finished-product quality can justify an approach to quality assurance with an improved level of quality compared to finished-product testing using existing compendial standards.

2.1. The Effect of the Manufacturing Process on Intermediates during Processing

As described above, CPV was introduced in the pharmaceutical industry to produce high-quality drugs through quality control and quality assurance throughout the drug lifecycle. Therefore, in CPV, the quality control and process monitoring of intermediate products are recommended by using QbD to identify the quality of intermediate products that may affect the quality of finished products and by adjusting process parameters during the manufacturing process using the PAT framework. [12][13][22]Table 1 presents the process parameters and quality of intermediate products that need to be adjusted in the manufacturing process, including blending, granulation, drying, coating, and tableting of solid dosage form based on the risk assessment using the QbD approach. Since the proposed process parameters and quality of the intermediate can greatly influence the quality attribute of the finished product, they should be adjusted by conducting appropriate process monitoring through a PAT framework during the manufacturing process [23][24].
Table 1. Effect of critical process parameters (CPPs) on intermediate quality attributes (IQAs) for the solid dosage form.
Process Critical
Process Parameter
Intermediate
Quality Attributes
Justification Ref
Blending Blending time
-
Drug content
-
Blending uniformity
If the blending time is long, separation may occur depending on the particle characteristics, which may affect the content and content uniformity of the mixture. [25][26]
Blending speed
-
Blending uniformity
When blending above the optimum blending speed, the particles adhere to the wall of the blender by centrifugal force, which may affect the uniformity of the content of the mixture. [25][26][27][28][29]
Order of input
-
Drug content
-
Blending uniformity
The order of input of additives has little effect on content and content uniformity because of the blending process in the blender. However, the effect of the input of the lubricant may affect the content and content uniformity. [26]
Environment
-
Moisture content
-
Drug content
If temperature and humidity are not controlled, it may affect the moisture content of the mixture, and the content and content uniformity may be affected depending on the moisture and thermal stability of the drug. [26]
Filling level
-
Drug content
Since the charging rate affects the movement of the particles, it can cause blending non-uniformity. This can affect the content and content uniformity of the mixture. [25][26][27]
Granulation High-shear granulation Binder solvent amount
-
Granule-size distribution
-
Granule strength
-
Flowability
When the amount of liquid increases, the powder is completely wetted, which impedes the particle flow in the granulator, which can affect the particle-size distribution of the granules by increasing the residence time and torque value. When the amount of liquid is insufficient, weak granules are formed. [30][31]
Binder solvent concentration
-
Bulk/apparent/true density
-
Granule-size distribution
The concentration of the binding liquid has a direct relationship with the binding force and can affect the density and particle-size distribution of the granules. [32][33][34]
Binder solvent spray rate
-
Drug content
-
Granule size
-
Granule strength
The binder solvent spray rate is directly connected to the size of the granules. If it is too slow, the process time is lengthened, and it is difficult to form granules; if it is too fast, a mass may be formed. Therefore, it can affect the granule-size distribution and density. [35][36][37][38]
Filling level
-
Drug content
The filling level affects the movement of particles in the granulator ball, so that fine granules may be generated due to an increase in the number of collisions between the granules and an increase in strength. This can affect the content and uniformity of the granules. [39][40]
Impeller speed
-
Granule density
-
Flowability
-
Granule strength
-
Bulk/apparent/true density
-
Granule-size distribution
The speed of the impeller determines the state of the granules. Accordingly, the porosity and density of the granules may be affected, and the particle-size distribution and flowability of the granules may be affected. In addition, as the impeller speed increases, it may affect the granule growth due to coalescence, so it may affect the granule size. [30][35][41][42][43][44][45]
Chopper speed
-
Granule-size distribution
-
Bulk/apparent/true density
-
Flowability
Since the chopper speed plays a role in breaking the mass of granules, it can affect the density of the granules, the particle-size distribution, and the flowability of the granules. [30][37][41][46]
Massing time
-
Granule-size distribution
-
Granule strength
-
Drug content uniformity
-
Bulk/apparent/true density
-
Flowability
The massing time is a factor that determines the main physical properties of the granules. Depending on the massing time, the strength of the granules and the density of the granules can be affected, and thus, the flowability and particle-size distribution can also be affected. Excessive massing time can result in granule growth by coalescence, which can affect granule size. Accordingly, it may affect the content uniformity of the granules, which may affect formation of granules. [31][36][41][47][48][49]
Mill screen size
-
Granule-size distribution
-
Flowability
-
Bulk/apparent/true density
The mill screen size can affect the physical properties of the granules, such as the density and flowability of the granules, due to a large correlation with the particle-size distribution of the granules. [35]
Nozzle type
-
Granule size
-
Granule-size distribution
-
Flowability
The nozzle position affects the spray angle of the binder solvent, which can affect the agglomeration and growth of the granules, but the effect is negligible. In addition, the size of the nozzle hole affects the distribution of the binder solution. However, this has little effect when adjusted with other process variables. [39][50]
Fluidized-bed granulation Binder amount
-
Granule-size distribution
-
Flowability
When the amount of liquid increases, the powder is completely wetted, which impedes the particle flow in the granulator, which can affect the particle-size distribution of the granules by increasing the residence time and torque value. When the amount of liquid is insufficient, weak granules are formed. [51]
Binder concentration
-
Bulk/apparent/true density
-
Granule-size distribution
The concentration of the binding liquid has a direct relationship with the binding force and can affect the density and particle-size distribution of the granules. [52][53][54][55][56][57]
Binder spray rate
-
Bulk/apparent/true density
-
Granule size
-
Granule-size distribution
The binder solvent spray rate is directly connected to the size of the granules. If it is too slow, the process time is lengthened and it is difficult to form granules; if it is too fast, a mass may be formed. Therefore, it can affect the granule-size distribution and density. [53][54][55][56][57][58][59][60]
Air volume/temperature/humidity
-
Bulk/apparent/true density
-
Granule-size distribution
-
Flowability
Higher temperature increases fineness due to rapid drying, and lower temperature causes granules to agglomerate, resulting in harder and larger granules. This can affect the density, flowability and particle-size distribution of the granules. The flow of particles is determined according to the air-supply flow rate, and if it is too high, the degree of blending due to process loss may be lowered, which may affect the density, flowability, and particle-size distribution of the granules. The air-supply humidity determines the size of the granules, which can affect the particle-size distribution of the granules. [52][53][59][61]
Nozzle position
-
Granule size
-
Granule-size distribution
The position of the nozzle affects the spray angle of the binder solvent, which can affect the agglomeration and growth of the granules, but the effect is negligible. [54]
Nozzle type
-
Bulk/apparent/true density
-
Granule-size distribution
The nozzle type affects the way the binder is sprayed into the fluidized-bed of the particles, which can affect the particle-size distribution or density of the granules. [54][62]
Drying temperature/time
-
Granule-size distribution
-
Flowability
-
Granule density
-
Moisture content
It can be determined according to the heat and moisture stability of the drug. If the drying time is short or the granules are not sufficiently dried due to the low drying temperature, the moisture content of the granules may be affected. If it is too high, fines may occur due to over-drying, which may affect the flowability and density of the particles. [59][61]
Environment
-
Moisture content
-
Drug content
If the temperature and humidity are not managed, it may affect the moisture content of the granules, and the moisture and thermal stability of the drug may affect the content and content uniformity of the granules. [59][63]
Twin-screw granulation Binder viscosity
-
Granule-size distribution
When the binder solvent viscosity is high, there is a risk of granule mass, which may affect the size and particle-size distribution of the granules. [64]
Liquid to solid ratio
-
Granule-size distribution
-
Flowability
If the amount of liquid inside the granulator increases, the powder may become excessively moistened and impede the flow of the inside. This increases the residence time and can thus affect the size and particle-size distribution of the granules. [65][66][67][68][69]
Feeder rate
-
Bulk/apparent/true density
-
Granule-size distribution
-
Flowability
The feed rate of the powder affects the residence time, and due to the low feed rate, the inside of the granulator is not completely filled, and the residence time may be lengthened. This can affect granule properties, such as the particle-size distribution, density and flowability of the granules. [65][66][67][70]
Screw speed
-
Density
-
Granule-size distribution
-
Ribbon uniformity
The screw speed can affect the residence time and, accordingly, the particle-size distribution and density of the granules. [63][65][66][67][71][72][73][74]
Screw type
-
Density
-
Granule-size distribution
The type of screw is affected by the shape and angle of the screw to be engaged or the kneading pattern of the kneader part. This affects the amount of filling inside the granulator and can directly affect the compression and crushing of agglomerated particles and the distribution of the granules. [65][66][69][75]
Filling level
-
Granule-size distribution
-
Bulk/apparent/true density
The feeder amount is directly related to the residence time and can affect the particle-size distribution and density of the granules. [65][71]
Residence time
-
Granule size
-
Granule-size distribution
The residence time of the powder can affect the size and particle-size distribution of the granules. [66][72][75]
Roller compaction Roller compactor type
-
Ribbon density
-
Granule-size distribution
-
Flowability
Depending on the type of roller compactor, the principle of operation is different, which can affect the properties of the ribbon and the powdery properties of granules (roller width, roller diameter). The larger the diameter of the roller, the larger the compression area, so it may affect the characteristics of the ribbon, but, in general, the diameter of the roller is used as a fixed factor, so the effect on the intermediate product is insignificant. [76]
Roller pressure
-
Drug content
-
Granule-size distribution
-
Flowability
Since the roller pressure determines the bonding force of the powder, it is judged to be directly related to the density of the ribbon. This may affect granule particle-size distribution, flowability and content uniformity after mill screening. [35][76][77][78][79][80]
Roller speed
-
Ribbon density
-
Drug content
-
Granule-size distribution
-
Flowability
The roller speed is controlled by the screw speed, and it is judged that it has a direct relationship with the density of the ribbon as well as controlling the speed of the process. This affects the powder properties of the granules, which can affect the particle-size distribution and flowability of the granules. [35][78][80][81][82][83][84]
Roller gap
-
Ribbon density
-
Granule density
-
Granule-size distribution
The roller gap affects the bonding force of the powder fed into the feeder, and may affect the ribbon density. This affects the powder properties of the granules after mill screening, which may affect the particle-size distribution and flowability of the granules. As the width of the roller changes, it is directly related to the maximum pressure of the roller, which can affect the density of the ribbon and thus the density and particle-size distribution of the granules. [35][76][78][79][81][83]
Feeder rate
-
Ribbon Density
-
Granule-size distribution
-
Flowability
Input speed is directly related to roller pressure or roller spacing, which can affect the ribbon density, particle-size distribution and flowability of the granules. [79][82]
Feed screw speed
-
Ribbon uniformity
Feed screw speed is a variable that is affected by roller pressure and roller spacing, and the effect is negligible. [80]
Residence time
-
Ribbon uniformity
The residence time of the powder can affect the size and particle-size distribution of the granules. [85][86][87]
Mill screen size
-
Granule-size distribution
-
Flowability
The size of the granulator can affect the physical properties of the granules, such as the density and flowability of the granules, due to a large correlation with the particle-size distribution of the granules. [76][78][88]
Mill speed
-
Granule-size distribution
-
Flowability
The speed of the granulator can affect the powdery properties of the granules, but the effect is insignificant.
Drying
process
Drying time
-
Particle size
-
Particle distribution
-
Drug polymorphic form
-
Moisture content
-
Bulk/apparent/true density
If the drying time is short, and the result is not fully dried, the moisture content may be affected. If the drying takes too long, fine powder may be generated due to over-drying, which may affect the flowability and distribution of the particles. [89][90][91]
Drying temperature If the drying temperature is low, and the result is not fully dried, the moisture content may be affected. If the drying temperature is too high, fine powder may be generated due to over-drying, which may affect the flowability and particle distribution of the particles.
Inlet air temperature
-
Moisture content
The thermal charge of the inlet drying gas reflects its capacity to dry the humid atomized droplets, and, therefore, higher inlet temperatures enable higher solvent evaporation rates. [92]
Air flow rate
-
Particle distribution
-
Bulk/apparent/true density
-
Moisture content
The flow of particles is determined according to the air-supply flow-rate, and the air-supply flow-rate determines the size of the granules. This can affect the density and particle-size distribution. In addition, an increase in the air flow rate causes a higher evaporation rate. [89][93]
Coating process Rotation speed
-
Coating uniformity
As the speed increases, the tablets apparently tumble through the spray zone rather than sliding flat, so the end exposure is more frequent, and the coating becomes more uniform. [94][95][96]
Nozzle diameter
-
Coating thickness
-
Weight gain
-
Moisture content
The size of the sprayed droplet varies depending on the nozzle diameter. Therefore, since the amount of the coating liquid to be sprayed varies, this affects the moisture content and residual solvent. [97][98]
Inlet air temperature
-
Coating uniformity
-
Moisture content
If the inlet air temperature is high, the tablets are excessively dried, and the surface becomes rough. If the inlet air temperature is low, the tablets stick together, and the moisture content of the tablets increases. Moisture content and coating uniformity are highly dependent on the incoming air temperature. [99]
Air flow rate
-
Coating efficacy
The air flow rate prevents the sprayed coating solution from reaching the tablet. The faster the air flow, the lower the velocity of the sprayed droplet and the smaller the droplet size. Therefore, it affects the coating efficiency. [100]
Air volume
-
Coating efficacy
An improper air layer due to worn or uneven drying may cause agglomeration between particles. An increase in air volume causes a decrease in spray density because the spray area increases as the droplet size decreases at the center of the spray. [101]
Coating solution composition
-
Coated drug appearance
-
Coating uniformity
-
Hardness
-
Moisture content
In the case of functional coatings, the coating solution must contain an appropriate composition to deliver the desired effect of the drug, which affects the efficacy of the finished product. In addition, if the ratio of solids constituting the coating solution is high, efficient spraying becomes difficult, thus affecting the coating efficiency. [102][103]
Spray rate
-
Coating uniformity
Too high a spray rate cause inadequate drying, twining, and sticking. Therefore, spray rate will have a significant impact on surface roughness and weight gain, thus affecting the coating uniformity. [96][99]
Atomizing air pressure
-
Coating efficiency
Too high a spray pressure can lead to spray drying, and too low can cause agglomeration, which can have a significant impact on coating uniformity. [104][105][106]
Curing temperature/
time
-
Coating efficiency
-
Moisture content
-
Hardness
The incorrect setting of the curing temperature and curing time will result in incomplete film formation. Thus, full film formation occurs when exposed to a certain curing temperature. The proper setting of curing time is necessary to achieve complete film adhesion. [107][108][109]
Tableting process Feeder speed
-
Tablet porosity/density/solid fraction
-
Drug content
-
Weight variation
Low feeder speeds can lead to improper die filling, which can lead to weight changes and changes in hardness and thickness. Fast feeder speeds can overfill the die cavity and lead to weight variations and hardness and thickness variations. [110]
Rotary speed
-
Drug content
-
Hardness
-
Weight variation
Rotary speed affects compressibility and even affects weight variation, which can affect drug content. A high rotary speed causes a much wider distribution of lubrication extent compared to the results from a low rotary speed. This may induce greater variability in hardness between tablets. [111]
Precompression force
-
Tablet appearance
-
Thickness/dimensions
-
Tablet porosity/density/solid fraction
-
Hardness
Increasing compression force causes difficult particle rearrangement, deformation and fragmentation. Compression force affect tablet porosity, hardness, and density. In addition, depending on the tablet porosity, the degree to which moisture permeates into the tablet varies. [112][113][114][115][116]
Main compression
force
Dwell time
-
Weight variation
If the pressure holding time is too long, it deviates from the feeder speed, and inconsistent granules are filled into the die, which may cause weight fluctuations and affect the bonding force of the granules. [110][111][117][118][119]
Ejection force
-
Tablet defects
The optimal compression force must be determined to obtain the desired tablet hardness [120]

2.2. Workflow of PAT Framework for the Pharmaceutical Manufacturing Process

Before applying PAT to the process, first, it is necessary to understand the process and materials and consider the characteristics of the PAT tool. The most appropriate PAT tool is selected and applied to the PAT process. In this process, factors such as the location of the PAT tool and the measurement method should be considered. The measurement methods of PAT during the process are classified into at-line, on-line, and in-line. The at-line method is a measurement method that collects, separates, and analyzes a sample from a place very close to the process. On-line is a measurement method in which a sample is measured in the manufacturing process, suitability is determined, and the sample is returned to the process or discarded. In-line is a real time monitoring method using software without collecting a sample from the process flow [121]. After that, process monitoring is performed, and the collected data is analyzed and evaluated with statistical methods. The statistical methods could be divided into preprocessing technologies, chemometric modeling, and data evaluation. Standard normal variate (SNV), multiplicative scatter correction (MSC), and derivatives to reduce data interference and correct data are used in the preprocessing step [60][122][123][124][125]. The chemometric modeling includes partial least square (PLS), principal component analysis (PCA), multiple linear regression (MLR), etc., to confirm the correlation between CQAs, critical material attributes (CMAs), and CPPs [16][20]. Data evaluation is to measure and enhance data predictability using the root mean square error of the calibration (RMSEC), root mean square error of the prediction (RMSEP), etc. [126][127][128]. Various literature presented use PAT in this way. It is suggested that process control and quality control can be performed by measuring the quality of intermediate and finished products in RTRT using PAT during the process.

2.3. The Role of PAT Framework on QbD, CPV, and RTRT

As shown Figure 1, PAT is important for CPV and QbD approaches to the production of high-quality drug products. In lab-scale drug development, CMAs, CPPs, and CQAs in the formulation and process are identified through QTPP and risk assessment, an optimal design space is derived through DoE, and correlations with CQAs, CPPs, and IQAs are identified through multivariate analysis (MVA) based on QbD [35]. Based on the correlation between CQAs, CPPs, and IQAs, process and quality control are possible by checking process variability in real-time through PAT during the commercial-/pilot-scale manufacturing process. Therefore, the introduction of PAT in the QbD approach in the pharmaceutical manufacturing process is used as a control strategy for RTRT by improving process understanding through monitoring the process in real-time and enabling rapid identification and response [11][129][130][131][132][133]. In other words, performing RTRT using PAT application in real time to manage the correlation identified based on the QbD approach enables CPV through the production of high-quality drug products with guaranteed product qualification throughout the manufacturing process.
Figure 1. Framework of process analytical technology (PAT) application in quality by design (QbD) approach.

3. PAT Tools for the Pharmaceutical Manufacturing Process

3.1. Near-Infrared Spectroscopy (NIRS)

After discovery by Herschel in the 1800s, NIRS has been applied as a useful spectral analysis technology in many studies. NIRS is a qualitative and quantitative analysis based on the transmittance and reflectance generated by molecular vibrational motion using light in the near-infrared range of 780–2800 nm. It is most often used in the pharmaceutical industry as a real-time process-monitoring tool for product quality control and quality assurance during processing [11][19][20][21][22][23][24]. The NIRS is connected to a fiber optic probe, and the QA of the product in the process is non-destructively measured by the transmission and reflection of the NIRS by the sample, and quality control through real-time monitoring is possible [19]. The inside of the probe is composed of an optical fiber, a lens, mirror, and signal channel, and the outside of the probe is made of a corrosion-resistant material. It is connected through a sapphire window, so it can be effectively used even in poor process conditions. When the probe is connected to the NIR spectrometer, the light emitted from the light source is focused by the focusing lens. The light reflected by the mirror located at the tip of the probe is transmitted to the NIR spectrum by reflecting a sample. The transmitted signal forms a spectrum through computer software connected to the NIR spectrometer. However, a disadvantage of NIRS is that it is more difficult to interpret a signal than by using conventional analysis methods, such as chromatography, ultraviolet/visible (UV-VIS) light, and others, because the absorption bands overlap due to spectral complexity. In addition, because this is a relative approach, it is necessary to form and verify an accurate correction model using a reference method to utilize it effectively [20]. Nevertheless, NIRS can non-destructively measure the IQAs of a product in a short time during the process, and it can be used as a tool for RTRT in the pharmaceutical industry by enabling the process control and quality assurance of finished products through real-time monitoring [7][21][72][134][135][136][137][138][139][140][141][142][143][144][145][146][147][148][149][150][151][152][153][154][155][156]. Some literature, which shows that PAT is highly applicable to CPV through RTRT, conducted to monitor and evaluate product quality by applying NIRS as a PAT tool, are presented below in various pharmaceutical industries.

3.2. Raman Spectroscopy

Similar to NIRS, Raman spectroscopy is a noncontact analysis technology that uses optical fibers [157]. Raman spectroscopy is a type of vibration spectroscopy. Various Raman laser sources offer a range of wavelengths (generally 785 nm), from the UV-VIS to near-infrared regions; the most common are visible light lasers [158]. In general, vibrations occur in chemical bonds that are not rigid, and materials can be characterized based on their molecular-vibration frequencies. Raman spectroscopy is widely used in pharmaceutical manufacturing because it enables the rapid characterization of the chemical composition and structure of a solid, liquid, gas, gel, or powder sample by providing the detailed characteristics of their vibrational transitions [1]. Raman spectroscopy is used to determine the molecule in the sample, and their intensity enables the calculation of the drug content of a particular sample. One of the main reasons for using PAT is to build and qualitatively analyze the specificity library of the raw material spectrum, including impurities in the sample [158]. Raman spectroscopy is ideally suited for PAT systems because it has the flexibility to operate on-line or in-line. Moreover, it provides both quantitative and qualitative data, enabling accurate and consistent monitoring and control during real-time processes. Depending on the compound, the Raman spectrum for a specific molecule differs for each movement of the scattered photon energy, and because it has a unique fingerprint, it enables the monitoring of qualitative information [8][159]. Furthermore, it can be used for analyzing liquid products without moisture interference, similar to Fourier-transform infrared spectroscopy (FTIR) or NIRS, and has a high measurement speed.
Similar to other spectroscopy methods, Raman spectroscopy is commonly used as a real-time monitoring tool for CPV in various pharmaceutical unit processes, including blending, granulation, coating, and tableting. It can analyze the IQAs and CQAs of drug content [160][161][162] during the blending process, moisture content [8][9] during the drying and granulation process, and coating thickness and content [157][163][164] during the coating process, as well as enable polymorph identification in API preparation [165][166][167], granule-formulation analysis [8], blending uniformity [27][168], particle-size analysis [16][159][169], and others.

3.3. Hyperspectral Imaging (HSI)

HSI is well known for chemical or spectral imaging. It is a nondestructive PAT tool that can extract both spatial and spectral information from an object by integrating existing imaging and spectroscopy techniques. HSI can be applied to various wavelength ranges, including visual, near-infrared, and short-wave infrared (1000–2500 nm). Each pixel of the image acquired by the HSI tool, which contains a spectrum of a specific location, comprises hundreds of consecutive wavelength bands in each space. This generates a large amount of information because the spectrum is constantly acquired from a wide range. Similar to other spectroscopy methods, the preprocessing of the acquired data cube must be performed on qualitative and quantitative images by extracting information in an easy-to-understand image format [170]. HSI provides dependable chemical and spatial imaging data on the content and distribution of API and excipients during the processes of blending, granulation, and tableting [170]. The acquired images are combined and processed in three dimensions (3D) to form the data cube. The x and y dimensions of the formed cube are shown as the two space dimensions, whereas λ is the spectral dimension. There are four basic techniques (spatial scanning, spectral scanning, nonscan, and spatiotemporal scanning) for acquiring 3D (x, y, λ) data in a hyperspectral cube, and the choice of technology depends on the specific application. HIS as an on-line PAT tool has been used to monitor blending uniformity and analyze tablet variability [171]. Moreover, it can analyze the sample to be measured faster than spectroscopy, and it is also used for package monitoring to ensure products are correctly placed in the package, identify defective tablets, or detect empty slots in a package [172]. Kandpal et al. studied an in-line HIS system for monitoring drug content in microtablets’ surface. The collected multivariate data were evaluated by applying the PLSR and PCR chemometric model. The authors showed a high predictive ability and proposed a quick in-line determination of product quality using HIS.

3.4. Terahertz Pulse Imaging (TPI)

TPI, a widely used PAT tool for real-time imaging, is applied for monitoring tablet surface and coating analysis [173]. The terahertz absorption spectrum is related to the 3D arrangement and covers the spectral range of 0.1–4.0 THz, which corresponds to the range between the infrared and microwave frequencies. For this reason, the terahertz region is known as far-infrared radiation. Compared with infrared radiation, it has the advantage of causing little scattering because of its longer wavelength, and lower radiation energy interacting with drugs is less likely to damage the sample [173]. Furthermore, TPI is widely used as a noninvasive method because it uses nonionizing radiation and is safe to use. As mentioned previously, TPI is mainly used in the pharmaceutical coating process. In particular, it is used for predicting the degree of coating thickness in sustained-release tablets, in which the coating thickness is directly related to drug release [164][174][175][176]. If drug release is via the coating instead of through the dissolution of the tablet, then it can be predicted by analyzing the coating formulation using TPI.

3.5. Mass Spectrometry (MS)

MS is an extremely useful PAT tool for the qualitative analysis of drug, compound, and related substances. Because it has a high resolution and mass accuracy, it is also used in the qualitative analysis of small molecules and is often selected and used in biological processes, such as in analyzing heterogeneous biomolecules [177][178][179]. In addition, it provides quick analysis when high throughput sample preparation and automated data processing are possible [8]. The mass spectrum is commonly employed to obtain the identity of two compounds or to establish the structure of a new compound and provides the accurate molecular weight or molecular formula to indicate the existence of a specific structural unit in a molecule. The main advantage of MS is its ability to measure several types of compounds with excellent discrimination over a very short analysis time. Moreover, it is used to quantitatively analyze known substances or identify unknown compounds in a sample and to reveal the structure and chemical properties of other molecules. To perform MS, a vacuum must be maintained, and the sample needs to be vaporized and ionized. Thus, the disadvantage of MS is that a sample cannot be analyzed if it cannot be decomposed and evaporated. The typical applications of MS include the real-time control of the drying process, particularly the monitoring of the trace amounts of organic solvents used in the production of intermediate and finished products.

3.6. Acoustic Resonance Spectrometry (ARS)

ARS as a PAT tool detects and analyzes the sound generated during the pharmaceutical process. The sound detected by ARS is much higher than the frequencies detectable by the human ear [180][181]. It is usually applied to processes that cause acoustic emission and is applied to the chemical reaction checking or blending, pulverization, and fluidized-bed granulation of the drugs. For example, during the granulation process, particles emit various sounds when they collide with each other and cause friction in the equipment. As with most PAT tools, ARS is noninvasive, does not require sample preparation, and has the advantage of being an inexpensive and convenient application method. Using acoustic emission, quantitative information, such as particle characteristics and moisture content, can be obtained. Changes in the physical properties of the powder, such as compression characteristics and distribution characteristics, can be monitored. Tsujimoto et al. used ARS to monitor and characterize particle motion due to friction occurring during the fluidized-bed granulation process; they also monitored the behavior of particles via the correlation between ARS and particle motion. ARS was installed at the bottom of the fluidized-bed granulator, and the collected sound was amplified and the sensitivity optimized to analyze the frequency. The impact of particles hitting the chamber wall increased with the increasing rotational speed of the fluidized-bed granulator, resulting in the subsequent increase of the AE amplitude. In addition, the instability due to the increased amount of spray solution, i.e., increased moisture content, could be detected during the fluidized-bed granulation process by ARS [180].

3.7. Spatial Filter Velocimetry (SFV)

Similar to FBRM, SFV is a technique that measures the chord length of a moving particle in real time. Therefore, it is used as a PAT tool for the real-time monitoring of particle size, size distribution, and shape in various solid dosage manufacturing processes, including fluidized-bed granulation/coating, grinding, and spray-drying [147][153][182][183][184]. However, unlike FBRM, which uses backscattered laser light, SFV applies a shadow to calculate the particle code length. When the particles pass through a parallel laser beam, a shadow is created in the linear fiber-optic array, and a secondary pulse signal is generated by a single fiber. Hence, it is possible to measure the size and velocity of individual particles simultaneously and calculate the chord length of the particle by using the time of the pulse signal and velocity of the moving particle [77]. Therefore, monitoring using SFV allows quality control to be performed by evaluating the properties of intermediate and finished products in a non-invasive method without special sampling procedures. Due to these characteristics, SFV can be used as a monitoring tool in CPV through RTRT.

3.8. Focused Beam Reflectance Measurement (FBRM)

FBRM is a technique that provides information on the code length distribution of a population of dispersed particles based on the backscattering of laser light. In the pharmaceutical industry, it is suitable for studying particle properties in suspension [185][186][187][188], emulsion [189][190][191][192], and crystallization [193][194]. Therefore, FBRM is used as a tool to evaluate IQAs including particle size, size distribution, shape, and particle-growth behavior in granulation and crystallization processes, which can have a great influence on the quality of the finished product due to particle properties, and to perform real time monitoring [195]. In the case of FBRM, a laser beam connected to the probe via a fiber is inserted into the process equipment through a sapphire window at the end of the probe. At this time, some of the light scattering generated by the laser beam crossing the particles by high-speed rotational motion is transmitted to the detector to generate the code length. Thousands of code lengths are measured simultaneously, and based on this, a code-length distribution can be generated to measure particle properties such as particle size and size distribution in real-time [92][93][95].

3.9. X-ray Fluorescence (XRF)

XRF is an atomic analysis technique used to determine the component of a variety of sample types, including solids, liquids, slurries, and powders, similar to inductively coupled plasma light atomic emission spectroscopy (ICP-AES) and atomic absorption spectroscopy (AAS). AAS and ICP-AES are widely used in the pharmaceutical industry for atomic high-sensitivity analysis because they can measure >70 different elements. However, only a specific analyte can be measured by the cathode lamp, and sample preparation takes longer because of the acid-decomposition procedure. Moreover, there are obvious disadvantages because of the large space requirement and high maintenance cost. As an alternative, XRF was developed [196]. XRF is a chemical analysis method based on the transfer of internal electrons and the interaction of X-ray radiation and atoms. High-energy X-rays attack electrons in high-energy atoms, leading to their release [16]. Hence, a vacancy is created in the inner shell, and electrons in the outer orbit are moved to cover the vacancy, thereby generating fluorescent X-rays because of the energy difference between the two orbits. Because each element has an electron of its own energy level, elemental analysis is possible as a result of the unique energy difference resulting from the characteristic X-ray irradiation [197]. Therefore, XRF has the advantage of high selectivity, a small number of collected spectra, and a lack of overlap [198]. The obtained spectrum of XRF indicates the properties of each element, and the intensity of the spectrum indicates the content of the element present in the sample [196]. XRF is unaffected by the matrix effect because it reduces the absorption and scattering of the X-ray beam between the sample and the matrix. Moreover, the sample preparation time is short, and the method is relatively simple because of its high sensitivity [199]. XRF is highly applicable to CPV in the pharmaceutical industry as it allows simpler data analysis because of its lesser influence on the non-overlapping spectrum and matrix effect, as well as its ability to nondestructively quantify multiple elements at the same time. This is explained through research cases in which the quality evaluation of intermediate and finished products was performed through the real-time monitoring of various manufacturing processes in the pharmaceutical industry.

3.10. Other PAT Tools

OCT (optical coherence tomography) is a high-resolution imaging method that can non-destructively measure the depth of translucent or cloudy materials. In the pharmaceutical industry, it is used to measure coating thickness and uniformity during the coating process by applying the same principles as TPI. OCT can compensate for the shortcomings of TPI’s low resolution and long measurement time and enables high resolution due to its relatively short wavelength [200][201]. However, imaging the thickness of the coating can be difficult due to strong scattering that limits the depth of penetration into the coating matrix and does not produce a clear refractive index difference. Nevertheless, it can measure not only the coating thickness but also the coating homogeneity within the tablet and has the advantage of being less affected by probe contamination and measurement location during the process compared to NIRS or Raman spectroscopy. Therefore, in the pharmaceutical industry, OCT is widely used as a real-time monitoring tool for the quality control of intermediate and finished products, and several studies have applied this tool to RTRT to prove the possibility of CPV [200]. Eyecon is a direct imaging analyzer of particle size. It does not require sampling and automatically captures data regarding the particle size and shape of the powder or variations to analyze the process. Another PAT tool is microwave resonance technology (MRT). MRT can measure moisture during the granulation process by noting the interaction between water molecules and the changing electromagnetic field. Unlike spectroscopy, such as NIRS and Raman spectroscopy, MRT does not require any mathematical preprocessing of the collected data.

References

  1. Kourti, T. The process analytical technology initiative and multivariate process analysis, monitoring and control. Anal. Bioanal. Chem. 2006, 384, 1043–1048.
  2. De Leersnyder, F.; Peeters, E.; Djalabi, H.; Vanhoorne, V.; Van Snick, B.; Hong, K.; Hammond, S.; Liu, A.Y.; Ziemons, E.; Vervaet, C. Development and validation of an in-line NIR spectroscopic method for continuous blend potency determination in the feed frame of a tablet press. J. Pharm. Biomed. Anal. 2018, 151, 274–283.
  3. Gendre, C.; Genty, M.; Boiret, M.; Julien, M.; Meunier, L.; Lecoq, O.; Baron, M.; Chaminade, P.; Péan, J.M. Development of a process analytical technology (PAT) for in-line monitoring of film thickness and mass of coating materials during a pan coating operation. J. Pharm. Sci. 2011, 43, 244–250.
  4. Næs, T.; Martens, H. Principal component regression in NIR analysis: Viewpoints, background details and selection of components. J. Chemom. 1988, 2, 155–167.
  5. Lopes, J.A.; Costa, P.F.; Alves, T.P.; Menezes, J.C. Chemometrics in bioprocess engineering: Process analytical technology (PAT) applications. Chemom. Intell. Lab. Syst. 2004, 74, 269–275.
  6. Brülls, M.; Folestad, S.; Sparén, A.; Rasmuson, A. In-situ near-infrared spectroscopy monitoring of the lyophilization process. Pharm. Res. 2003, 20, 494–499.
  7. Kamat, M.S.; Lodder, R.A.; DeLuca, P.P. Near-infrared spectroscopic determination of residual moisture in lyophilized sucrose through intact glass vials. Pharm. Res. 1989, 6, 961–965.
  8. Reddy, J.P.; Jones, J.W.; Wray, P.S.; Dennis, A.B.; Brown, J.; Timmins, P. Monitoring of multiple solvent induced form changes during high shear wet granulation and drying processes using online Raman spectroscopy. Int. J. Pharm. 2018, 541, 253–260.
  9. Harting, J.; Kleinebudde, P. Optimisation of an in-line Raman spectroscopic method for continuous API quantification during twin-screw wet granulation and its application for process characterisation. Eur. J. Pharm. Biopharm. 2019, 137, 77–85.
  10. Gnoth, S.; Jenzsch, M.; Simutis, R.; Lübbert, A. Process Analytical Technology (PAT): Batch-to-batch reproducibility of fermentation processes by robust process operational design and control. J. Biotechnol. 2007, 132, 180–186.
  11. Goodwin, D.J.; van den Ban, S.; Denham, M.; Barylski, I. Real time release testing of tablet content and content uniformity. Int. J. Pharm. 2018, 537, 183–192.
  12. Panzitta, M.; Calamassi, N.; Sabatini, C.; Grassi, M.; Spagnoli, C.; Vizzini, V.; Ricchiuto, E.; Venturini, A.; Brogi, A.; Font, J.B. Spectrophotometry and pharmaceutical PAT/RTRT: Practical challenges and regulatory landscape from development to product lifecycle. Int. J. Pharm. 2021, 601, 120551.
  13. Araújo, A.S.; Andrade, D.F.; Babos, D.V.; Pricylla, J.; Castro, J.A.G.; Sperança, M.A.; Gamela, R.R.; Machado, R.C.; Costa, V.C.; Guedes, W.N. Key Information Related to Quality by Design (QbD) Applications in Analytical Methods Development. Braz. J. Anal. Chem. 2021, 8, 14–28.
  14. Dasu, M.; Naresh, J.R. Real Time Release Testing-A New Quality Paradigm for Pharmaceutical Development. Int. J. Pharm. Sci. Rev. Res. 2013, 19, 80–84.
  15. Devi, N.G.; Chandramouli, R. Real Time Release Testing-A Review. J. Pharm. Res. 2018, 16, 314–318.
  16. Panchuk, V.; Yaroshenko, I.; Legin, A.; Semenov, V.; Kirsanov, D. Application of chemometric methods to XRF-data–A tutorial review. Anal. Chim. Acta 2018, 1040, 19–32.
  17. Jolliffe, I.T.; Cadima, J. Principal component analysis: A review and recent developments. Philos. Trans. R. Soc. A 2016, 374, 20150202.
  18. Genin, N.; Rene, F.; Corrieu, G. A method for on-line determination of residual water content and sublimation end-point during freeze-drying. Chem. Eng. Process. 1996, 35, 255–263.
  19. Reich, G. Near-infrared spectroscopy and imaging: Basic principles and pharmaceutical applications. Adv. Drug Deliv. Rev. 2005, 57, 1109–1143.
  20. Blanco, M.; Villarroya, I. NIR spectroscopy: A rapid-response analytical tool. Trends Analyt. Chem. 2002, 21, 240–250.
  21. Vanarase, A.U.; Alcalà, M.; Rozo, J.I.J.; Muzzio, F.J.; Romañach, R.J. Real-time monitoring of drug concentration in a continuous powder mixing process using NIR spectroscopy. Chem. Eng. Sci. 2010, 65, 5728–5733.
  22. Patil, A.S.; Pethe, A.M. Quality by Design (QbD): A new concept for development of quality pharmaceuticals. Int. J. Pharm. Qual. Assur. 2013, 4, 13–19.
  23. Puchert, T.; Holzhauer, C.-V.; Menezes, J.; Lochmann, D.; Reich, G. A new PAT/QbD approach for the determination of blend homogeneity: Combination of on-line NIRS analysis with PC Scores Distance Analysis (PC-SDA). Eur. J. Pharm. Biopharm. 2011, 78, 173–182.
  24. Jain, S. Quality by design (QBD): A comprehensive understanding of implementation and challenges in pharmaceuticals development. Int. J. Pharm. Pharm. Sci. 2014, 6, 29–35.
  25. Yeom, S.B.; Choi, D.H. Scale-up strategy in quality by design approach for pharmaceutical blending process with discrete element method simulation. Pharmaceutics 2019, 11, 264.
  26. Adam, S.; Suzzi, D.; Radeke, C.; Khinast, J.G. An integrated Quality by Design (QbD) approach towards design space definition of a blending unit operation by Discrete Element Method (DEM) simulation. Eur. J. Pharm. Sci. 2011, 42, 106–115.
  27. De Beer, T.; Bodson, C.; Dejaegher, B.; Walczak, B.; Vercruysse, P.; Burggraeve, A.; Lemos, A.; Delattre, L.; Vander Heyden, Y.; Remon, J.P. Raman spectroscopy as a process analytical technology (PAT) tool for the in-line monitoring and understanding of a powder blending process. J. Pharm. Biomed. Anal. 2008, 48, 772–779.
  28. Vergote, G.; De Beer, T.; Vervaet, C.; Remon, J.P.; Baeyens, W.; Diericx, N.; Verpoort, F.J.E.J.o.P.S. In-line monitoring of a pharmaceutical blending process using FT-Raman spectroscopy. Eur. J. Pharm. Sci. 2004, 21, 479–485.
  29. Wu, Z.; Tao, O.; Dai, X.; Du, M.; Shi, X.; Qiao, Y. Monitoring of a pharmaceutical blending process using near infrared chemical imaging. Vib. Spectrosc. 2012, 63, 371–379.
  30. Zhang, Y.; Cheng, B.C.-Y.; Zhou, W.; Xu, B.; Gao, X.; Qiao, Y.; Luo, G. Improved understanding of the high shear wet granulation process under the paradigm of quality by design using Salvia miltiorrhiza granules. Pharmaceutics 2019, 11, 519.
  31. Huang, J.; Kaul, G.; Utz, J.; Hernandez, P.; Wong, V.; Bradley, D.; Nagi, A.; O’Grady, D. A PAT approach to improve process understanding of high shear wet granulation through in-line particle measurement using FBRM C35. J. Pharm. Sci. 2010, 99, 3205–3212.
  32. Tamrakar, A.; Chen, S.-W.; Ramachandran, R. A dem model-based study to quantitatively compare the effect of wet and dry binder addition in high-shear wet granulation processes. Chem. Eng. Res. Des. 2019, 142, 307–326.
  33. Knight, P.; Johansen, A.; Kristensen, H.; Schaefer, T.; Seville, J. An investigation of the effects on agglomeration of changing the speed of a mechanical mixer. Powder Technol. 2000, 110, 204–209.
  34. Keningley, S.; Knight, P.; Marson, A. An investigation into the effects of binder viscosity on agglomeration behaviour. Powder Technol. 1997, 91, 95–103.
  35. Kim, J.Y.; Chun, M.H.; Choi, D.H. Control Strategy for Process Development of High-Shear Wet Granulation and Roller Compaction to Prepare a Combination Drug Using Integrated Quality by Design. Pharmaceutics 2021, 13, 80.
  36. Badawy, S.I.; Narang, A.S.; LaMarche, K.R.; Subramanian, G.A.; Varia, S.A. Mechanistic basis for the effects of process parameters on quality attributes in high shear wet granulation. In Handbook of Pharmaceutical Wet Granulation; Elsevier: Amsterdam, The Netherlands, 2019; pp. 89–118.
  37. Chitu, T.M.; Oulahna, D.; Hemati, M. Wet granulation in laboratory-scale high shear mixers: Effect of chopper presence, design and impeller speed. Powder Technol. 2011, 206, 34–43.
  38. Benali, M.; Gerbaud, V.; Hemati, M. Effect of operating conditions and physico–chemical properties on the wet granulation kinetics in high shear mixer. Powder Technol. 2009, 190, 160–169.
  39. Mangwandi, C.; Adams, M.J.; Hounslow, M.J.; Salman, A.D. Effect of batch size on mechanical properties of granules in high shear granulation. Powder Technol. 2011, 206, 44–52.
  40. Heng, P.; Chan, L.; Zhu, L. Effects of process variables and their interactions on melt pelletization in a high shear mixer. STP Pharm. Sci. 2000, 10, 165–172.
  41. Han, J.K.; Shin, B.S.; Choi, D.H. Comprehensive study of intermediate and critical quality attributes for process control of high-shear wet granulation using multivariate analysis and the quality by design approach. Pharmaceutics 2019, 11, 252.
  42. Kayrak-Talay, D.; Litster, J.D. A priori performance prediction in pharmaceutical wet granulation: Testing the applicability of the nucleation regime map to a formulation with a broad size distribution and dry binder addition. Int. J. Pharm. 2011, 418, 254–264.
  43. Oulahna, D.; Cordier, F.; Galet, L.; Dodds, J.A. Wet granulation: The effect of shear on granule properties. Powder Technol. 2003, 130, 238–246.
  44. Sáska, Z.; Dredán, J.; Luhn, O.; Balogh, E.; Shafir, G.; Antal, I. Evaluation of the impact of mixing speed on the compressibility and compactibility of paracetamol-isomalt containing granules with factorial design. Powder Technol. 2011, 213, 132–140.
  45. Cavinato, M.; Andreato, E.; Bresciani, M.; Pignatone, I.; Bellazzi, G.; Franceschinis, E.; Realdon, N.; Canu, P.; Santomaso, A.C. Combining formulation and process aspects for optimizing the high-shear wet granulation of common drugs. Int. J. Pharm. 2011, 416, 229–241.
  46. Bock, T.K.; Kraas, U. Experience with the Diosna mini-granulator and assessment of process scalability. Eur. J. Pharm. Biopharm. 2001, 52, 297–303.
  47. Shi, L.; Feng, Y.; Sun, C.C. Massing in high shear wet granulation can simultaneously improve powder flow and deteriorate powder compaction: A double-edged sword. Eur. J. Pharm. Sci. 2011, 43, 50–56.
  48. Ohno, I.; Hasegawa, S.; Yada, S.; Kusai, A.; Moribe, K.; Yamamoto, K. Importance of evaluating the consolidation of granules manufactured by high shear mixer. Int. J. Pharm. 2007, 338, 79–86.
  49. Mackaplow, M.B.; Rosen, L.A.; Michaels, J.N. Effect of primary particle size on granule growth and endpoint determination in high-shear wet granulation. Powder Technol. 2000, 108, 32–45.
  50. Veronica, N.; Goh, H.P.; Kang, C.Y.X.; Liew, C.V.; Heng, P.W.S. Influence of spray nozzle aperture during high shear wet granulation on granule properties and its compression attributes. Int. J. Pharm. 2018, 553, 474–482.
  51. Alkan, M.; Yuksel, A. Granulation in a fluidized bed II Effect of binder amount on the final granules. Drug Dev. Ind. Pharm. 1986, 12, 1529–1543.
  52. Bouffard, J.; Kaster, M.; Dumont, H. Influence of process variable and physicochemical properties on the granulation mechanism of mannitol in a fluid bed top spray granulator. Drug Dev. Ind. Pharm. 2005, 31, 923–933.
  53. Loh, Z.H.; Er, D.Z.; Chan, L.W.; Liew, C.V.; Heng, P.W. Spray granulation for drug formulation. Expert Opin. Drug Deliv. 2011, 8, 1645–1661.
  54. Parikh, D.M.; Mogavero, M. Batch fluid bed granulation. In Handbook of Pharmaceutical Granulation Technology; CRC Press: Boca Raton, FL, USA, 2005; pp. 275–338.
  55. Parikh, D.M. Batch size increase in fluid-bed granulation. In Pharmaceutical Process Scale-Up; CRC Press: Boca Raton, FL, USA, 2005; pp. 301–358.
  56. Srivastava, S.; Mishra, G.J.; Research, D. Fluid bed technology: Overview and parameters for process selection. Int. J. Pharm. Sci. Drug Res. 2010, 2, 236–246.
  57. Hemati, M.; Cherif, R.; Saleh, K.; Pont, V.J.P.T. Fluidized bed coating and granulation: Influence of process-related variables and physicochemical properties on the growth kinetics. Powder Technol. 2003, 130, 18–34.
  58. Jager, K.; Bauer, K. Polymer blends from PVP as a means to optimize properties of fluidized bed granulates and tablets. Acta Pharm. Technol. 1984, 30, 85–92.
  59. Lourenço, V.; Lochmann, D.; Reich, G.; Menezes, J.C.; Herdling, T.; Schewitz, J. A quality by design study applied to an industrial pharmaceutical fluid bed granulation. Eur. J. Pharm. Biopharm. 2012, 81, 438–447.
  60. Reimers, T.; Thies, J.; Stöckel, P.; Dietrich, S.; Pein-Hackelbusch, M.; Quodbach, J. Implementation of real-time and in-line feedback control for a fluid bed granulation process. Int. J. Pharm. 2019, 567, 118452.
  61. Burggraeve, A.; Silva, A.F.; Van Den Kerkhof, T.; Hellings, M.; Vervaet, C.; Remon, J.P.; Vander Heyden, Y.; De Beer, T.J.T. Development of a fluid bed granulation process control strategy based on real-time process and product measurements. Talanta 2012, 100, 293–302.
  62. Georgakopoulos, P.; Malamataris, S.; Dolamidis, G. The effects of using different grades of PVP and gelatin as binders in the fluidized bed granulation and tabletting of lactose. Pharmazie 1983, 38, 240–243.
  63. Pauli, V.; Elbaz, F.; Kleinebudde, P.; Krumme, M. Methodology for a variable rate control strategy development in continuous manufacturing applied to twin-screw wet-granulation and continuous fluid-bed drying. J. Pharm. Innov. 2018, 13, 247–260.
  64. Dhenge, R.M.; Washino, K.; Cartwright, J.J.; Hounslow, M.J.; Salman, A.D. Twin screw granulation using conveying screws: Effects of viscosity of granulation liquids and flow of powders. Powder Technol. 2013, 238, 77–90.
  65. Vanhoorne, V.; Vanbillemont, B.; Vercruysse, J.; De Leersnyder, F.; Gomes, P.; De Beer, T.; Remon, J.P.; Vervaet, C. Development of a controlled release formulation by continuous twin screw granulation: Influence of process and formulation parameters. Int. J. Pharm. 2016, 505, 61–68.
  66. Dhenge, R.M.; Fyles, R.S.; Cartwright, J.J.; Doughty, D.G.; Hounslow, M.J.; Salman, A.D. Twin screw wet granulation: Granule properties. Chem. Eng. J. 2010, 164, 322–329.
  67. Tan, L.; Carella, A.J.; Ren, Y.; Lo, J.B. Process optimization for continuous extrusion wet granulation. Pharm. Dev. Technol. 2011, 16, 302–315.
  68. Beer, P.; Wilson, D.; Huang, Z.; De Matas, M. Transfer from High-Shear Batch to Continuous Twin Screw Wet Granulation: A Case Study in Understanding the Relationship Between Process Parameters and Product Quality Attributes. J. Pharm. Sci. 2014, 103, 3075–3082.
  69. El Hagrasy, A.; Hennenkamp, J.; Burke, M.; Cartwright, J.; Litster, J.D. Twin screw wet granulation: Influence of formulation parameters on granule properties and growth behavior. Powder Technol. 2013, 238, 108–115.
  70. Dhenge, R.M.; Cartwright, J.J.; Doughty, D.G.; Hounslow, M.J.; Salman, A.D. Twin screw wet granulation: Effect of powder feed rate. Adv. Powder Technol. 2011, 22, 162–166.
  71. Meier, R.; Moll, K.-P.; Krumme, M.; Kleinebudde, P. Impact of fill-level in twin-screw granulation on critical quality attributes of granules and tablets. Eur. J. Pharm. Biopharm. 2017, 115, 102–112.
  72. Vercruysse, J.; Toiviainen, M.; Fonteyne, M.; Helkimo, N.; Ketolainen, J.; Juuti, M.; Delaet, U.; Van Assche, I.; Remon, J.P.; Vervaet, C. Visualization and understanding of the granulation liquid mixing and distribution during continuous twin screw granulation using NIR chemical imaging. Eur. J. Pharm. Biopharm. 2014, 86, 383–392.
  73. Vercruysse, J.; Díaz, D.C.; Peeters, E.; Fonteyne, M.; Delaet, U.; Van Assche, I.; De Beer, T.; Remon, J.P.; Vervaet, C. Continuous twin screw granulation: Influence of process variables on granule and tablet quality. Eur. J. Pharm. Biopharm. 2012, 82, 205–211.
  74. Thompson, M.; Sun, J. Wet granulation in a twin-screw extruder: Implications of screw design. J. Pharm. Sci. 2010, 99, 2090–2103.
  75. Keleb, E.; Vermeire, A.; Vervaet, C.; Remon, J.P. Twin screw granulation as a simple and efficient tool for continuous wet granulation. Int. J. Pharm. 2004, 273, 183–194.
  76. Rambali, B.; Baert, L.; Jans, E.; Massart, D.L. Influence of the roll compactor parameter settings and the compression pressure on the buccal bio-adhesive tablet properties. Int. J. Pharm. 2001, 220, 129–140.
  77. Sheskey, P.J.; Dasbach, T.P. Evaluation of various polymers as dry binders in the preparation of an immediate-release tablet formulation by roller compaction. Pharm. Technol. 1995, 19, 98–112.
  78. Souihi, N.; Josefson, M.; Tajarobi, P.; Gururajan, B.; Trygg, J. Design space estimation of the roller compaction process. Ind. Eng. Chem. Res. 2013, 52, 12408–12419.
  79. Hsu, S.-H.; Reklaitis, G.V.; Venkatasubramanian, V. Modeling and control of roller compaction for pharmaceutical manufacturing. Part I: Process dynamics and control framework. J. Pharm. Innov. 2010, 5, 14–23.
  80. Miller, R.W. Roller compaction technology. In Handbook of Pharmaceutical Granualtion Technology; CRC Press: Boca Raton, FL, USA, 2005; Volume 154, pp. 159–190.
  81. Gago, A.P.; Reynolds, G.; Kleinebudde, P. Impact of roll compactor scale on ribbon density. Powder Technol. 2018, 337, 92–103.
  82. Falzone, A.M.; Peck, G.E.; Mccabe, G.P. Effects of changes in roller compactor parameters on granulations produced by compaction. Drug Dev. Ind. Pharm. 1992, 18, 469–489.
  83. Gamble, J.F.; Tobyn, M.; Dennis, A.B.; Shah, T. Roller compaction: Application of an in-gap ribbon porosity calculation for the optimization of downstream granule flow and compactability characteristics. Pharm. Dev. Technol. 2010, 15, 223–229.
  84. Inghelbrecht, S.; Remon, J.P. The roller compaction of different types of lactose. Int. J. Pharm. 1998, 166, 135–144.
  85. Roberts, R.J.; Rowe, R.C. The effect of punch velocity on the compaction of a variety of materials. J. Pharm. Pharmacol. 1985, 37, 377–384.
  86. Pietsch, W.B. Agglomeration Processes: Phenomena, Technologies, Equipment; John Wiley and Sons: Hoboken, NJ, USA, 2008.
  87. Kruisz, J.; Rehrl, J.; Sacher, S.; Aigner, I.; Horn, M.; Khinast, J.G. RTD modeling of a continuous dry granulation process for process control and materials diversion. Int. J. Pharm. 2017, 528, 334–344.
  88. Von Eggelkraut-Gottanka, S.G.; Abed, S.A.; Müller, W.; Schmidt, P.C. Roller compaction and tabletting of St. John’s wort plant dry extract using a gap width and force controlled roller compactor. I. Granulation and tabletting of eight different extract batches. Pharm. Dev. Technol. 2002, 7, 433–445.
  89. Peng, Y.; Han, Y.; Gardner, D.J. Spray-drying cellulose nanofibrils: Effect of drying process parameters on particle morphology and size distribution. Wood Fiber Sci. 2012, 44, 448–461.
  90. De Leersnyder, F.; Vanhoorne, V.; Bekaert, H.; Vercruysse, J.; Ghijs, M.; Bostijn, N.; Verstraeten, M.; Cappuyns, P.; Van Assche, I.; Vander Heyden, Y. Breakage and drying behaviour of granules in a continuous fluid bed dryer: Influence of process parameters and wet granule transfer. Eur. J. Pharm. Sci. 2018, 115, 223–232.
  91. Cal, K.; Sollohub, K. Spray drying technique. I: Hardware and process parameters. J. Pharm. Sci. 2010, 99, 575–586.
  92. Santos, D.; Maurício, A.C.; Sencadas, V.; Santos, J.D.; Fernandes, M.H.; Gomes, P.S. Spray Drying: An Overview. In Biomaterials: Physics and Chemistry—New Edition; InTech: London, UK, 2018.
  93. Putra, R.N.; Ajiwiguna, T.A. Influence of air temperature and velocity for drying process. Proc. Eng. 2017, 170, 516–519.
  94. Wilson, K.E.; Crossman, E. The influence of tablet shape and pan speed on intra-tablet film coating uniformity. Drug Dev. Ind. Pharm. 1997, 23, 1239–1243.
  95. Chen, W.; Chang, S.-Y.; Kiang, S.; Marchut, A.; Lyngberg, O.; Wang, J.; Rao, V.; Desai, D.; Stamato, H.; Early, W. Modeling of pan coating processes: Prediction of tablet content uniformity and determination of critical process parameters. J. Pharm. Sci. 2010, 99, 3213–3225.
  96. Just, S.; Toschkoff, G.; Funke, A.; Djuric, D.; Scharrer, G.; Khinast, J.; Knop, K.; Kleinebudde, P. Optimization of the inter-tablet coating uniformity for an active coating process at lab and pilot scale. Int. J. Pharm. 2013, 457, 1–8.
  97. Müller, R.; Kleinebudde, P. Comparison study of laboratory and production spray guns in film coating: Effect of pattern air and nozzle diameter. Pharm. Dev. Technol. 2006, 11, 425–433.
  98. Morks, M.; Akimoto, K. The role of nozzle diameter on the microstructure and abrasion wear resistance of plasma sprayed Al2O3/TiO2 composite coatings. J. Manuf. Process. 2008, 10, 1–5.
  99. Patel, J.; Shah, A.; Sheth, N. Aqueous-based film coating of tablets: Study the effect of critical process parameters. Int. J. Pharm. Tech. Res. 2009, 1, 235–240.
  100. Wang, J.; Hemenway, J.; Chen, W.; Desai, D.; Early, W.; Paruchuri, S.; Chang, S.-Y.; Stamato, H.; Varia, S. An evaluation of process parameters to improve coating efficiency of an active tablet film-coating process. Int. J. Pharm. 2012, 427, 163–169.
  101. Benjasirimongkol, P.; Piriyaprasarth, S.; Sriamornsak, P. Effect of Formulations and Spray Drying Process Conditions on Physical Properties of Resveratrol Spray-Dried Emulsions. In Key Engineering Materials; John Wiley and Sons: Hoboken, NJ, USA, 1995; pp. 246–251.
  102. Munday, D.; Fassihi, A. Controlled release delivery: Effect of coating composition on release characteristics of mini-tablets. Int. J. Pharm. 1989, 52, 109–114.
  103. Pint, B.A.; Lance, M.J.; Allen Haynes, J. The Effect of Coating Composition and Geometry on Thermal Barrier Coatings Lifetime. J. Eng. Gas Turbines Power. 2019, 141.
  104. Tobiska, S.; Kleinebudde, P. Coating uniformity: Influence of atomizing air pressure. Pharm. Dev. Technol. 2003, 8, 39–46.
  105. Barbash, D.; Fulghum, J.E.; Yang, J.; Felton, L. A novel imaging technique to investigate the influence of atomization air pressure on film–tablet interfacial thickness. Drug Dev. Ind. Pharm. 2009, 35, 480–486.
  106. Kothari, B.H.; Fahmy, R.; Claycamp, H.G.; Moore, C.M.; Chatterjee, S.; Hoag, S.W. A systematic approach of employing quality by design principles: Risk assessment and design of experiments to demonstrate process understanding and identify the critical process parameters for coating of the ethylcellulose pseudolatex dispersion using non-conventional fluid bed process. AAPS PharmSciTech 2017, 18, 1135–1157.
  107. Bodmeier, R.; Paeratakul, O. The effect of curing on drug release and morphological properties of ethylcellulose pseudolatex-coated beads. Drug Dev. Ind. Pharm. 1994, 20, 1517–1533.
  108. Hutchings, D.; Kuzmak, B.; Sakr, A. Processing considerations for an EC latex coating system: Influence of curing time and temperature. Pharm. Res. 1994, 11, 1474–1478.
  109. Mafi, R.; Mirabedini, S.; Naderi, R.; Attar, M. Effect of curing characterization on the corrosion performance of polyester and polyester/epoxy powder coatings. Corros. Sci. 2008, 50, 3280–3286.
  110. Garlapati, V.K.; Roy, L. Utilization of response surface methodology for modeling and optimization of tablet compression process. J. Young Pharm. 2017, 9, 417–421.
  111. Peeters, E.; Silva, A.; Fonteyne, M.; De Beer, T.; Vervaet, C.; Remon, J.P. Influence of extended dwell time during pre-and main compression on the properties of ibuprofen tablets. Eur. J. Pharm. Biopharm. 2018, 128, 300–315.
  112. Mittal, B. How to Develop Robust Solid Oral Dosage Forms: From Conception to Post-Approval; Academic Press: Cambridge, MA, USA, 2016; pp. 17–37.
  113. Riippi, M.; Antikainen, O.; Niskanen, T.; Yliruusi, J. The effect of compression force on surface structure, crushing strength, friability and disintegration time of erythromycin acistrate tablets. Eur. J. Pharm. Biopharm. 1998, 46, 339–345.
  114. Sunada, H.; Bi, Y. Preparation, evaluation and optimization of rapidly disintegrating tablets. Powder Technol. 2002, 122, 188–198.
  115. Narang, A.S.; Rao, V.M.; Guo, H.; Lu, J.; Desai, D.S. Effect of force feeder on tablet strength during compression. Int. J. Pharm. 2010, 401, 7–15.
  116. Sinka, I.; Motazedian, F.; Cocks, A.; Pitt, K. The effect of processing parameters on pharmaceutical tablet properties. Powder Technol. 2009, 189, 276–284.
  117. Ali, H.; Khatri, A.M.; Jain, A.; Modi, R.; Patel, A. Standard Practice of sampling, storage and Holding Time for Pharmaceutical Tablet and Injection during manufacturing process. Drug Invent. Today 2011, 3, 157–159.
  118. Akande, O.F.; Ford, J.L.; Rowe, P.H.; Rubinstein, M.H. Pharmaceutics: The Effects of Lag-time and Dwell-time on the Compaction Properties of 1:1 Paracetamol/microcrystalline Cellulose Tablets Prepared by Pre-compression and Main Compression. J. Pharm. Pharmacol. 1998, 50, 19–28.
  119. Anbalagan, P.; Liew, C.V.; Heng, P.W.S. Role of dwell on compact deformation during tableting: An overview. Int. J. Pharm. Investig. 2017, 47, 173–181.
  120. Sun, C.C. Dependence of ejection force on tableting speed—A compaction simulation study. Powder Technol. 2015, 279, 123–126.
  121. US Food and Drug Administration. Guidance for industry, PAT-A Framework for Innovative Pharmaceutical Development, Manufacturing and Quality Assurance. 2004. Available online: (accessed on 10 March 2021).
  122. Rinnan, Å.; Van Den Berg, F.; Engelsen, S.B. Review of the most common pre-processing techniques for near-infrared spectra. Trends Analyt. Chem. 2009, 28, 1201–1222.
  123. Joe, A.; Frank, A.; Gopal, A. A Study on Various Preprocessing Algorithms Used For NIR Spectra. Res. J. Pharm. Biol. Chem. 2016, 7, 2752–2757.
  124. Christensen, J.; Nørgaard, L.; Heimdal, H.; Pedersen, J.G.; Engelsen, S.B. Rapid spectroscopic analysis of marzipan—Comparative instrumentation. J. Near Infrared Spectrosc. 2004, 12, 63–75.
  125. Engelsen, S.B.; Mikkelsen, E.; Munck, L. New approaches to rapid spectroscopic evaluation of properties in pectic polymers. In The Colloid Science of Lipids; Springer: Berlin, Germany, 1998; pp. 166–174.
  126. Cronin, M.T.; Schultz, T.W. Pitfalls in QSAR. J. Mol. Struct. THEOCHEM 2003, 622, 39–51.
  127. De Bleye, C.; Chavez, P.-F.; Mantanus, J.; Marini, R.; Hubert, P.; Rozet, E.; Ziemons, E. Critical review of near-infrared spectroscopic methods validations in pharmaceutical applications. J. Pharm. Biomed. Anal. 2012, 69, 125–132.
  128. Cozzolino, D.; Cynkar, W.; Shah, N.; Smith, P. Multivariate data analysis applied to spectroscopy: Potential application to juice and fruit quality. Food Res. Int. 2011, 44, 1888–1896.
  129. Jiang, M.; Severson, K.A.; Love, J.C.; Madden, H.; Swann, P.; Zang, L.; Braatz, R.D. Opportunities and challenges of real-time release testing in biopharmaceutical manufacturing. Biotechnology 2017, 114, 2445–2456.
  130. Galata, D.L.; Könyves, Z.; Nagy, B.; Novák, M.; Mészáros, L.A.; Szabó, E.; Farkas, A.; Marosi, G.; Nagy, Z.K. Real-time release testing of dissolution based on surrogate models developed by machine learning algorithms using NIR spectra, compression force and particle size distribution as input data. Int. J. Pharm. 2021, 597, 120338.
  131. Roggo, Y.; Pauli, V.; Jelsch, M.; Pellegatti, L.; Elbaz, F.; Ensslin, S.; Kleinebudde, P.; Krumme, M. Continuous manufacturing process monitoring of pharmaceutical solid dosage form: A case study. J. Pharm. Biomed. Anal. 2020, 179, 112971.
  132. Barimani, S.; Kleinebudde, P. Optimization of a semi-batch tablet coating process for a continuous manufacturing line by design of experiments. Int. J. Pharm. 2018, 539, 95–103.
  133. Pauli, V.; Roggo, Y.; Pellegatti, L.; Trung, N.Q.N.; Elbaz, F.; Ensslin, S.; Kleinebudde, P.; Krumme, M. Process analytical technology for continuous manufacturing tableting processing: A case study. J. Pharm. Biomed. An. 2019, 162, 101–111.
  134. Eustaquio, A.; Blanco, M.; Jee, R.; Moffat, A. Determination of paracetamol in intact tablets by use of near infrared transmittance spectroscopy. Anal. Chim. Acta 1999, 383, 283–290.
  135. Blanco, M.; Peguero, A. Analysis of pharmaceuticals by NIR spectroscopy without a reference method. Trends Analyt. Chem. 2010, 29, 1127–1136.
  136. Karande, A.D.; Heng, P.W.S.; Liew, C.V. In-line quantification of micronized drug and excipients in tablets by near infrared (NIR) spectroscopy: Real time monitoring of tabletting process. Int. J. Pharm. 2010, 396, 63–74.
  137. Blanco, M.; Cueva-Mestanza, R.; Peguero, A. NIR analysis of pharmaceutical samples without reference data: Improving the calibration. Talanta 2011, 85, 2218–2225.
  138. Xie, Y.; Song, Y.; Zhang, Y.; Zhao, B. Near-infrared spectroscopy quantitative determination of Pefloxacin mesylate concentration in pharmaceuticals by using partial least squares and principal component regression multivariate calibration. Spectrochim. Acta A Mol. Biomol. Spectrosc. 2010, 75, 1535–1539.
  139. Grohganz, H.; Gildemyn, D.; Skibsted, E.; Flink, J.M.; Rantanen, J. Towards a robust water content determination of freeze-dried samples by near-infrared spectroscopy. Anal. Chim. Acta 2010, 676, 34–40.
  140. Corredor, C.C.; Bu, D.; Both, D. Comparison of near infrared and microwave resonance sensors for at-line moisture determination in powders and tablets. Anal. Chim. Acta 2011, 696, 84–93.
  141. Zheng, Y.; Lai, X.; Bruun, S.W.; Ipsen, H.; Larsen, J.N.; Løwenstein, H.; Søndergaard, I.; Jacobsen, S. Determination of moisture content of lyophilized allergen vaccines by NIR spectroscopy. J. Pharm. Biomed. Anal. 2008, 46, 592–596.
  142. Grohganz, H.; Fonteyne, M.; Skibsted, E.; Falck, T.; Palmqvist, B.; Rantanen, J. Role of excipients in the quantification of water in lyophilised mixtures using NIR spectroscopy. J. Pharm. Biomed. Anal. 2009, 49, 901–907.
  143. Zhang, X.-B.; Feng, Y.-C.; Hu, C.-Q. Feasibility and extension of universal quantitative models for moisture content determination in beta-lactam powder injections by near-infrared spectroscopy. Anal. Chim. Acta 2008, 630, 131–140.
  144. Paul Findlay, W.; Peck, G.R.; Morris, K.R. Determination of fluidized bed granulation end point using near-infrared spectroscopy and phenomenological analysis. J. Pharm. Sci. 2005, 94, 604–612.
  145. Zhou, X.; Hines, P.; Borer, M.W. Moisture determination in hygroscopic drug substances by near infrared spectroscopy. J. Pharm. Biomed. Anal. 1998, 17, 219–225.
  146. Rantanen, J.; Antikainen, O.; Mannermaa, J.-P.; Yliruusi, J. Use of the near-infrared reflectance method for measurement of moisture content during granulation. Pharm. Dev. Technol. 2000, 5, 209–217.
  147. Fonteyne, M.; Vercruysse, J.; Díaz, D.C.; Gildemyn, D.; Vervaet, C.; Remon, J.P.; Beer, T.D. Real-time assessment of critical quality attributes of a continuous granulation process. Pharm. Dev. Technol. 2013, 18, 85–97.
  148. Portier, C.; Pandelaere, K.; Delaet, U.; Vigh, T.; Di Pretoro, G.; De Beer, T.; Vervaet, C.; Vanhoorne, V. Continuous twin screw granulation: A complex interplay between formulation properties, process settings and screw design. Int. J. Pharm. 2020, 576, 119004.
  149. Meng, W.; Román-Ospino, A.D.; Panikar, S.S.; O’Callaghan, C.; Gilliam, S.J.; Ramachandran, R.; Muzzio, F.J. Advanced process design and understanding of continuous twin-screw granulation via implementation of in-line process analytical technologies. Adv. Powder Technol. 2019, 30, 879–894.
  150. Broad, N.W.; Jee, R.D.; Moffat, A.C.; Eaves, M.J.; Mann, W.C.; Dziki, W. Non-invasive determination of ethanol, propylene glycol and water in a multi-component pharmaceutical oral liquid by direct measurement through amber plastic bottles using Fourier transform near-infrared spectroscopy. Analyst 2000, 125, 2054–2058.
  151. Avalle, P.; Pollitt, M.; Bradley, K.; Cooper, B.; Pearce, G.; Djemai, A.; Fitzpatrick, S. Development of Process Analytical Technology (PAT) methods for controlled release pellet coating. Eur. J. Pharm. Biopharm. 2014, 87, 244–251.
  152. Naidu, V.R.; Deshpande, R.S.; Syed, M.R.; Deoghare, P.; Singh, D.; Wakte, P.S. PAT-based control of fluid bed coating process using NIR spectroscopy to monitor the cellulose coating on pharmaceutical pellets. AAPS PharmSciTech 2017, 18, 2045–2054.
  153. Hudovornik, G.; Korasa, K.; Vrečer, F. A study on the applicability of in-line measurements in the monitoring of the pellet coating process. Eur. J. Pharm. Sci. 2015, 75, 160–168.
  154. Morisseau, K.M.; Rhodes, C.T. Near-infrared spectroscopy as a nondestructive alternative to conventional tablet hardness testing. Pharm. Res. 1997, 14, 108–111.
  155. Trafford, A.; Jee, R.; Moffat, A. A rapid quantitative assay of intact paracetamol tablets by reflectance near-infrared spectroscopy. Analyst 1999, 124, 163–167.
  156. Chablani, L.; Taylor, M.K.; Mehrotra, A.; Rameas, P.; Stagner, W.C. Inline real-time near-infrared granule moisture measurements of a continuous granulation–drying–milling process. AAPS PharmSciTech 2011, 12, 1050–1055.
  157. Manley, L.; Hilden, J.; Valero, P.; Kramer, T. Tablet compression force as a process analytical technology (PAT): 100% inspection and control of tablet weight uniformity. J. Pharm. Sci. 2019, 108, 485–493.
  158. Clavaud, M.; Lema-Martinez, C.; Roggo, Y.; Bigalke, M.; Guillemain, A.; Hubert, P.; Ziemons, E.; Allmendinger, A. Near-infrared spectroscopy to determine residual moisture in freeze-dried products: Model generation by statistical design of experiments. J. Pharm. Sci. 2020, 109, 719–729.
  159. Ziemons, E.; Mantanus, J.; Lebrun, P.; Rozet, E.; Evrard, B.; Hubert, P. Acetaminophen determination in low-dose pharmaceutical syrup by NIR spectroscopy. J. Pharm. Biomed. Anal. 2010, 53, 510–516.
  160. Narang, A.S.; Stevens, T.; Paruchuri, S.; Macias, K.; Gao, Z.; Badawy, S.I.; Bindra, D.; Hubert, M. Inline Focused Beam Reflectance Measurement During Wet Granulation. In Handbook of Pharmaceutical Wet Granulation; Elsevier: Amsterdam, The Netherlands, 2019; pp. 471–512.
  161. Bostijn, N.; Dhondt, W.; Vervaet, C.; De Beer, T. PAT-based batch statistical process control of a manufacturing process for a pharmaceutical ointment. Eur. J. Pharm. Sci. 2019, 136, 104946.
  162. Kim, J.; Noh, J.; Chung, H.; Woo, Y.-A.; Kemper, M.S.; Lee, Y. Direct, non-destructive quantitative measurement of an active pharmaceutical ingredient in an intact capsule formulation using Raman spectroscopy. Anal. Chim. Acta 2007, 598, 280–285.
  163. Henn, R.; Kirchler, C.G.; Huck, C.W. Miniaturized NIR spectroscopy for the determination of main carbohydrates in syrup. NIR News 2017, 28, 3–6.
  164. Henn, R.; Schwab, A.; Huck, C.W. Evaluation of benchtop versus portable near-infrared spectroscopic method combined with multivariate approaches for the fast and simultaneous quantitative analysis of main sugars in syrup formulations. Food Control. 2016, 68, 97–104.
  165. Mazurek, S.; Szostak, R. Quantitative analysis of topical gels and ointments by FT-Raman spectroscopy. Vib. Spectrosc. 2016, 83, 1–7.
  166. Paris, I.; Janoly-Dumenil, A.; Paci, A.; Mercier, L.; Bourget, P.; Brion, F.; Chaminade, P.; Rieutord, A. Near infrared spectroscopy and process analytical technology to master the process of busulfan paediatric capsules in a university hospital. J. Pharm. Biomed. Anal. 2006, 41, 1171–1178.
  167. Eliasson, C.; Macleod, N.A.; Jayes, L.C.; Clarke, F.C.; Hammond, S.V.; Smith, M.R.; Matousek, P. Non-invasive quantitative assessment of the content of pharmaceutical capsules using transmission Raman spectroscopy. J. Pharm. Biomed. Anal. 2008, 47, 221–229.
  168. Nagy, B.; Farkas, A.; Gyürkés, M.; Komaromy-Hiller, S.; Démuth, B.; Szabó, B.; Nusser, D.; Borbás, E.; Marosi, G.; Nagy, Z.K. In-line Raman spectroscopic monitoring and feedback control of a continuous twin-screw pharmaceutical powder blending and tableting process. Int. J. Pharm. 2017, 530, 21–29.
  169. Bhagurkar, A.M.; Angamuthu, M.; Patil, H.; Tiwari, R.V.; Maurya, A.; Hashemnejad, S.M.; Kundu, S.; Murthy, S.N.; Repka, M.A. Development of an ointment formulation using hot-melt extrusion technology. AAPS PharmSciTech 2016, 17, 158–166.
  170. Serranti, S.; Bonifazi, G. Hyperspectral imaging and its applications. In Optical Sensing and Detection IV; SPIE Photonics Europe: Brussels, Belgium, 2016; Volume 9899.
  171. Rosas, J.; Armenta, S.; Cruz, J.; Blanco, M. A new approach to determine the homogeneity in hyperspectral imaging considering the particle size. Anal. Chim. Acta 2013, 787, 173–180.
  172. Müller, J.; Knop, K.; Thies, J.; Uerpmann, C.; Kleinebudde, P. Feasibility of Raman spectroscopy as PAT tool in active coating. Drug Dev. Ind. Pharm. 2010, 36, 234–243.
  173. Müllertz, A.; Perrie, Y.; Rades, T. Analytical Techniques in the Pharmaceutical Sciences; Springer: New York, NY, USA, 2016; pp. 171–222.
  174. Acevedo, D.; Muliadi, A.; Giridhar, A.; Litster, J.D.; Romañach, R.J. Evaluation of three approaches for real-time monitoring of roller compaction with near-infrared spectroscopy. AAPS PharmSciTech 2012, 13, 1005–1012.
  175. Khorasani, M.; Amigo, J.M.; Sun, C.C.; Bertelsen, P.; Rantanen, J. Near-infrared chemical imaging (NIR-CI) as a process monitoring solution for a production line of roll compaction and tableting. Eur. J. Pharm. Biopharm. 2015, 93, 293–302.
  176. Gupta, A.; Peck, G.E.; Miller, R.W.; Morris, K.R. Real-time near-infrared monitoring of content uniformity, moisture content, compact density, tensile strength, and Young’s modulus of roller compacted powder blends. J. Pharm. Sci. 2005, 94, 1589–1597.
  177. Zeng, S.; Wang, L.; Chen, T.; Wang, Y.; Mo, H.; Qu, H. Direct analysis in real time mass spectrometry and multivariate data analysis: A novel approach to rapid identification of analytical markers for quality control of traditional Chinese medicine preparation. Anal. Chim. Acta 2012, 733, 38–47.
  178. Ganguly, A.; Stewart, J.; Rhoden, A.; Volny, M.; Saad, N. Mass spectrometry in freeze-drying: Motivations for using a bespoke PAT for laboratory and production environment. Eur. J. Pharm. Biopharm. 2018, 127, 298–308.
  179. De Beer, T.; Allesø, M.; Goethals, F.; Coppens, A.; Vander Heyden, Y.; Lopez De Diego, H.; Rantanen, J.; Verpoort, F.; Vervaet, C.; Remon, J.P. Implementation of a process analytical technology system in a freeze-drying process using Raman spectroscopy for in-line process monitoring. Anal. Chem. 2007, 79, 7992–8003.
  180. Rodríguez-hornedo, N.; Murphy, D. Significance of controlling crystallization mechanisms and kinetics in pharmaceutical systems. J. Pharm. Sci. 1999, 88, 651–660.
  181. Hansuld, E.M.; Briens, L.; Sayani, A.; McCann, J.A. Monitoring quality attributes for high-shear wet granulation with audible acoustic emissions. Powder Technol. 2012, 215, 117–123.
  182. Folttmann, F.; Knop, K.; Kleinebudde, P.; Pein, M. In-line spatial filtering velocimetry for particle size and film thickness determination in fluidized-bed pellet coating processes. Eur. J. Pharm. Biopharm. 2014, 88, 931–938.
  183. Petrak, D. Simultaneous measurement of particle size and particle velocity by the spatial filtering technique. In Particle and Particle Systems Characterization: Measurement and Description of Particle Properties and Behavior in Powders and Other Disperse Systems; John Wiley and Sons: Hoboken, NJ, USA, 2002; pp. 391–400.
  184. Langner, M.; Kitzmann, I.; Ruppert, A.-L.; Wittich, I.; Wolf, B. In-line particle size measurement and process influences on rotary fluidized bed agglomeration. Powder Technol. 2020, 364, 673–679.
  185. Hou, G.; Power, G.; Barrett, M.; Glennon, B.; Morris, G.; Zhao, Y. Development and characterization of a single stage mixed-suspension, mixed-product-removal crystallization process with a novel transfer unit. Cryst. Growth Des. 2014, 14, 1782–1793.
  186. Heath, A.R.; Fawell, P.D.; Bahri, P.A.; Swift, J.D. Estimating average particle size by focused beam reflectance measurement (FBRM). In Particle and Particle Systems Characterization: Measurement and Description of Particle Properties and Behavior in Powders and Other Disperse Systems; John Wiley and Sons: Hoboken, NJ, USA, 2002; pp. 84–95.
  187. Kyoda, Y.; Costine, A.; Fawell, P.; Bellwood, J.; Das, G. Using focused beam reflectance measurement (FBRM) to monitor aggregate structures formed in flocculated clay suspensions. Miner. Eng. 2019, 138, 148–160.
  188. Barrett, P.; Glennon, B. In-line FBRM monitoring of particle size in dilute agitated suspensions. In Particle and Particle Systems Characterization: Measurement and Description of Particle Properties and Behavior in Powders and Other Disperse Systems; John Wiley and Sons: Hoboken, NJ, USA, 1999; pp. 207–211.
  189. Greaves, D.; Boxall, J.; Mulligan, J.; Montesi, A.; Creek, J.; Sloan, E.D.; Koh, C.A. Measuring the particle size of a known distribution using the focused beam reflectance measurement technique. Chem. Eng. Sci. 2008, 63, 5410–5419.
  190. Leba, H.; Cameirao, A.; Herri, J.-M.; Darbouret, M.; Peytavy, J.-L.; Glénat, P. Chord length distributions measurements during crystallization and agglomeration of gas hydrate in a water-in-oil emulsion: Simulation and experimentation. Chem. Eng. Sci. 2010, 65, 1185–1200.
  191. Bodmeier, R. Effect of solvent type on preparation of ethyl cellulose microparticles by solvent evaporation method with double emulsion system using focused beam reflectance measurement. Polym. Int. 2017, 66, 1448–1455.
  192. Boxall, J.A.; Koh, C.A.; Sloan, E.D.; Sum, A.K.; Wu, D.T. Measurement and calibration of droplet size distributions in water-in-oil emulsions by particle video microscope and a focused beam reflectance method. Ind. Eng. Chem. Res. 2010, 49, 1412–1418.
  193. Melchuna, A.; Cameirao, A.; Herri, J.-M.; Glenat, P. Topological modeling of methane hydrate crystallization from low to high water cut emulsion systems. Fluid Phase Equilib. 2016, 413, 158–169.
  194. Li, H.; Kawajiri, Y.; Grover, M.A.; Rousseau, R.W. Application of an empirical FBRM model to estimate crystal size distributions in batch crystallization. Cryst. Growth Des. 2014, 14, 607–616.
  195. Yu, Z.Q.; Chow, P.S.; Tan, R.B. Interpretation of focused beam reflectance measurement (FBRM) data via simulated crystallization. Org. Process Res. Dev. 2008, 12, 646–654.
  196. Antosz, F.J.; Xiang, Y.; Diaz, A.R.; Jensen, A.J. The use of total reflectance X-ray fluorescence (TXRF) for the determination of metals in the pharmaceutical industry. J. Pharm. Biomed. Anal. 2012, 62, 17–22.
  197. Uo, M.; Wada, T.; Sugiyama, T. Applications of X-ray fluorescence analysis (XRF) to dental and medical specimens. Jpn. Dent. Sci. Rev. 2015, 51, 2–9.
  198. Jenkins, R. X-ray Fluorescence Analysis. In X-ray Characterization of Materials; John Wiley and Sons: Hoboken, NJ, USA, 1999; pp. 171–209.
  199. Chen, Z.; Gibson, W.M.; Huang, H. High definition x-ray fluorescence: Principles and techniques. X-ray Opt. Instrum. 2008, 2008.
  200. Lin, H.; Zhang, Z.; Markl, D.; Zeitler, J.A.; Shen, Y. A review of the applications of OCT for analysing pharmaceutical film coatings. Appl. Sci. 2018, 8, 2700.
  201. Markl, D.; Hannesschläger, G.; Sacher, S.; Leitner, M.; Buchsbaum, A.; Pescod, R.; Baele, T.; Khinast, J.G. In-line monitoring of a pharmaceutical pan coating process by optical coherence tomography. J. Pharm. Sci. 2015, 104, 2531–2540.
More
Information
Contributor MDPI registered users' name will be linked to their SciProfiles pages. To register with us, please refer to https://encyclopedia.pub/register :
View Times: 1.3K
Revisions: 2 times (View History)
Update Date: 22 Jul 2021
1000/1000