1000/1000
Hot
Most Recent
 +1 point
Corn and soybean monocultures clustered indicator microbes, while chisel tillage and no-till also showed contrasting effects. Soil organic matter amounts and pH categorized bacterial community structure. Fungal abundance increased under continuous corn compared to continuous soybean. Many archaeal ASVs were ammonia-oxidizers closely associated with specific pH requirements.
Recent advancements in agricultural metagenomics allow for characterizing microbial indicators of soil health brought on by changes in management decisions, which ultimately affect the soil environment. Field-scale studies investigating the microbial taxa from agricultural experiments are sparse, with none investigating the long-term effect of crop rotation and tillage on microbial indicator species. Therefore, our goal was to determine the effect of rotations (continuous corn, CCC; continuous soybean, SSS; and each phase of a corn-soybean rotation, Cs and Sc) and tillage (no-till, NT; and chisel tillage, T) on the soil microbial community composition following 20 years of management. We found that crop rotation and tillage influence the soil environment by altering key soil properties, such as pH and soil organic matter (SOM). Monoculture corn lowered pH compared to SSS (5.9 vs. 6.9, respectively) but increased SOM (5.4% vs. 4.6%, respectively). Bacterial indicator microbes were categorized into two groups: SOM dependent and acidophile vs. N adverse and neutrophile. Fungi preferred the CCC rotation, characterized by low pH. Archaeal indicators were mainly ammonia oxidizers with species occupying niches at contrasting pHs. Numerous indicator microbes are involved with N cycling due to the fertilizer-rich environment, prone to aquatic or gaseous losses.
The experiment was conducted at the Northwestern Illinois Agricultural Research and Demonstration Center (40°55′50″ N, 90°43′38″ W), near Monmouth, Illinois. The study was established in 1996, and a complete description of the site can be found in Behnke et al. (2018; 2020). Briefly, soils were comprised of highly fertile silty clay loam and silt loam soil series (Muscatune 43%, Sable 40%, and Osco 17%) [18]. The study was designed in a split-plot arrangement of 4 rotation levels and 2 tillage levels in a randomized complete block design with 4 replications (blocks). The main plots (22 m long by 12 m wide) were crop rotation treatments, which consisted of continuous corn (CCC), corn phase of the corn-soybean rotation (Cs), soybean phase of the corn-soybean rotation (Sc), and continuous soybean (SSS). Subplot (22 m long by 6 m wide) tillage options were either no-till (NT) or chisel tillage (T).
The PCA on the 16S V4 bacterial domain produced five PCs (PC1-PC5; Table 5 and Table S3), explaining 65% of the variability in the 35 selected top-contributing ASVs. Within each PC, bacterial indicator microbes were flagged when significant correlations (loadings ≥1 |0.5|) were detected. The taxonomic classification of these ASVs provided by the SILVA database is listed in Table S3.
Table 5. Analysis of variance (ANOVA) results for the effects of crop rotation, tillage, and their interaction (Rot × Till) on each group of principal components (PCs) calculated for bacteria, fungi, and archaea taxa datasets. The datasets for each taxa were comprised of indicator ASVs. The probability values (p-Value) for each treatment effect and degrees of freedom (df) are displayed in the top rows. The treatment mean values and their standard errors (SEM) are presented below. For each taxon group and within a given column, treatment mean values followed by the same lowercase letter were not statistically different (α = 0.05).
| Bacteria | Fungi | Archaea | ||||||||||||||
|---|---|---|---|---|---|---|---|---|---|---|---|---|---|---|---|---|
| PC1 | PC2 | PC3 | PC4 | PC5 | PC1 | PC2 | PC3 | PC4 | PC5 | PC1 | PC2 | PC3 | PC4 | PC5 | ||
| Treatments | df | p-Value | p-Value | p-Value | ||||||||||||
| Rotation | 3 | 0.00 | 0.01 | 0.18 | 0.29 | 0.19 | 0.02 | 0.42 | 0.47 | 0.83 | 0.61 | 0.01 | 0.20 | 0.98 | 0.95 | 0.39 |
| Tillage | 1 | 0.00 | 0.01 | 0.02 | 0.00 | 0.00 | 0.79 | 0.37 | 0.00 | 0.11 | 0.03 | 0.16 | 0.26 | 0.05 | 0.00 | 0.09 |
| Rot × Till | 3 | 0.31 | 0.01 | 0.01 | 0.68 | 0.06 | 0.09 | 0.79 | 0.04 | 0.70 | 0.66 | 0.15 | 0.39 | 0.79 | 0.21 | 0.55 |
| Treatment means | ||||||||||||||||
| CCC † | −1.13 a | 0.51 | 0.29 | −0.23 | −0.01 | 1.21 a | −0.12 | 0.07 | 0.24 | 0.13 | −0.73 c | 0.09 | 0.02 | −0.05 | −0.52 | |
| Cs | −0.14 b | −1.69 | −0.03 | 0.00 | −0.61 | −0.06 b | 0.64 | 0.20 | −0.29 | 0.07 | 0.10 ab | 0.32 | 0.03 | −0.08 | 0.30 | |
| Sc | 0.17 b | −0.55 | 0.12 | −0.29 | 0.52 | −0.11 b | −0.39 | −0.09 | −0.02 | −0.31 | −0.04 b | −0.41 | −0.12 | 0.06 | 0.11 | |
| SSS | 1.09 c | 0.21 | −0.38 | 0.52 | 0.10 | −1.04 c | −0.13 | −0.18 | 0.07 | 0.11 | 0.67 a | 0.00 | 0.07 | 0.07 | 0.11 | |
| SEM | 0.29 | 0.33 | 0.52 | 0.68 | 0.37 | 0.18 | 0.41 | 0.33 | 0.42 | 0.42 | 0.40 | 0.34 | 0.38 | 0.29 | 0.36 | |
| NT ‡ | −0.25 a | −0.29 | −0.25 | −0.19 a | 0.43 a | −0.02 | 0.10 | −0.57 | 0.19 | −0.30 a | −0.11 | −0.14 | −0.28 a | −0.35 a | −0.19 | |
| T | 0.25 b | 0.29 | 0.25 | 0.19 b | −0.43 b | 0.02 | −0.10 | 0.57 | −0.19 | 0.30 b | 0.11 | 0.14 | 0.28 b | 0.35 b | 0.19 | |
| SEM | 0.25 | 0.30 | 0.50 | 0.63 | 0.30 | 0.13 | 0.25 | 0.30 | 0.25 | 0.38 | 0.36 | 0.30 | 0.27 | 0.24 | 0.23 | |
| CCC-NT • | −1.34 | 0.72 ab | −0.59 b | −0.42 | 0.85 | 0.97 | 0.04 | −0.81 d | 0.41 | −0.29 | −0.96 | −0.03 | −0.17 | −0.81 | −0.50 | |
| Cs-NT | −0.30 | −0.27 cde | −0.02 b | −0.28 | −0.31 | 0.02 | 0.86 | −0.52 cd | −0.31 | −0.16 | 0.16 | 0.52 | −0.39 | −0.18 | −0.11 | |
| Sc-NT | −0.23 | −0.92 e | 0.07 b | −0.36 | 0.93 | −0.27 | −0.28 | −0.61 cd | 0.36 | −0.37 | −0.39 | −0.78 | −0.51 | −0.20 | −0.10 | |
| SSS-NT | 0.87 | −0.69 de | −0.48 b | 0.28 | 0.27 | −0.79 | −0.21 | −0.34 cd | 0.29 | −0.37 | 0.74 | −0.25 | −0.05 | −0.23 | −0.05 | |
| CCC-T | −0.91 | 0.31 abc | 1.16 a | −0.04 | −0.86 | 1.45 | −0.29 | 0.96 a | 0.06 | 0.56 | −0.50 | 0.22 | 0.21 | 0.71 | −0.55 | |
| Cs-T | 0.03 | −0.07 bcd | −0.04 b | 0.28 | −0.91 | −0.13 | 0.43 | 0.91 a | −0.27 | 0.30 | 0.04 | 0.13 | 0.44 | 0.01 | 0.72 | |
| Sc-T | 0.57 | −0.19 cde | 0.17 b | −0.22 | 0.11 | 0.04 | −0.50 | 0.43 ab | −0.40 | −0.25 | 0.31 | −0.05 | 0.27 | 0.31 | 0.32 | |
| SSS-T | 1.31 | 1.12 a | −0.28 b | 0.75 | −0.08 | −1.28 | −0.04 | −0.02 bc | −0.15 | 0.59 | 0.60 | 0.24 | 0.19 | 0.37 | 0.28 | |
| SEM | 0.30 | 0.39 | 0.55 | 0.69 | 0.41 | 0.23 | 0.47 | 0.37 | 0.48 | 0.50 | 0.43 | 0.41 | 0.46 | 0.37 | 0.41 | |
† CCC, continuous corn; Cs, corn phase of the corn-soybean rotation; Sc, soybean phase of the corn-soybean rotation; SSS, continuous soybean. ‡ NT, no-till; T, chisel tillage. • CCC-NT, continuous corn, and no-till; CCC-T, continuous corn, and chisel tillage; Cs-NT, corn phase of the corn-soybean rotation and no-till; Cs-T, corn phase of the corn-soybean rotation and chisel tillage; Sc-NT, soybean phase of the corn-soybean rotation and no-till; Sc-T, soybean phase of the corn-soybean rotation and chisel tillage; SSS-NT, continuous soybean and no-till; SSS-T, continuous soybean and chisel tillage.
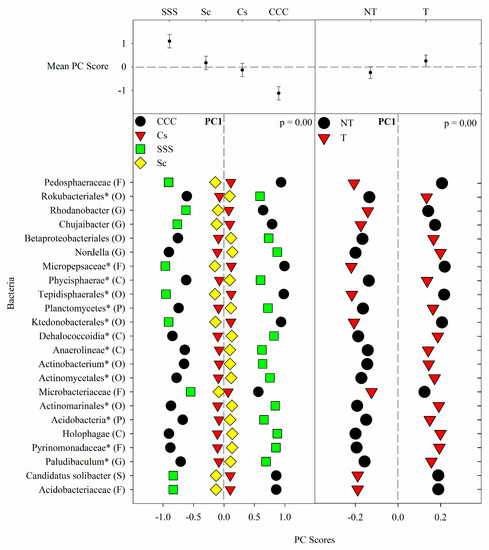
Figure 1. Mean bacterial principal component scores (PC) following 20 years of rotation and tillage treatments. Top panels show the bacterial mean PC score for both crop rotation and tillage main effects for PC1 based on the analysis of variance (ANOVA); error bars represent standard errors of the mean PC scores. Bottom panels show relative abundances (RAs) for each bacterial indicator ASVs by crop rotation and tillage effects. The main effects for PC1 are shown as CCC, continuous corn; Cs, corn phase of the corn-soybean rotation; Sc, soybean phase of the corn-soybean rotation; SSS, continuous soybean; NT, no-till; T, chisel tillage. For each taxon, the response of each ASV was calculated as the mean PC score multiplied by the PC loading score of a given ASV. The y-axes show the name of the ASV’s most explanatory taxonomic rank in parentheses (P, phylum; C, class; O, order; F, family; G, genus; S, species). The “*” after an ASV means it is uncultured.
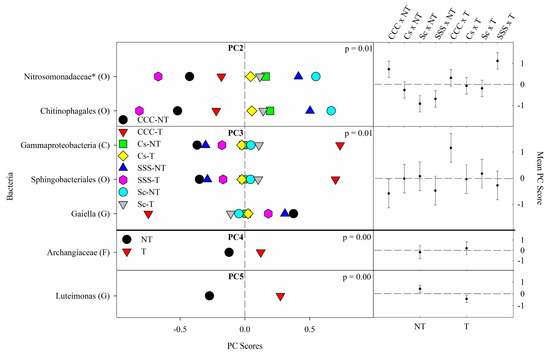
Figure 2. Mean bacterial principal component scores (PC) following 20 years of rotation and tillage treatments. Right panels show the bacterial mean PC score for the crop rotation × tillage interaction for PC2 and PC3 and a tillage effect for PC4 and PC5 based on the analysis of variance (ANOVA); error bars represent standard errors of the mean PC scores. Left panels show relative abundances (RAs) for each bacterial indicator ASVs by crop rotation × tillage and tillage. The crop rotation × tillage interaction for PC2 and PC3 is shown as CCC-NT, continuous corn, and no-till; CCC-T, continuous corn, and chisel tillage; Cs-NT, corn phase of the corn-soybean rotation and no-till; Cs-T, corn phase of the corn-soybean rotation and chisel tillage; Sc-NT, soybean phase of the corn-soybean rotation and no-till; Sc-T, soybean phase of the corn-soybean rotation and chisel tillage; SSS-NT, continuous soybean and no-till; SSS-T, continuous soybean and chisel tillage. The tillage main effect for PC4 and PC5 is shown as NT, no-till; T, chisel tillage. For each taxon, the response of each ASV was calculated as the mean PC score multiplied by the PC loading score of a given ASV. The y-axes show the name of the ASV’s most explanatory taxonomic rank in parentheses (P, phylum; C, class; O, order; F, family; G, genus; S, species). The “*” after an ASV means it is uncultured.
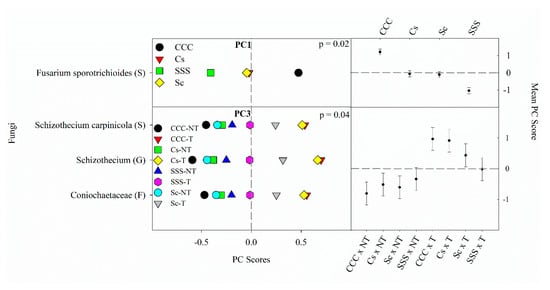
Figure 3. Mean fungal principal component scores (PC) following 20 years of rotation and tillage treatments. Right panels show the fungal mean PC score for the main effect of crop rotation for PC1 and the crop rotation × tillage interaction for PC3 based on the analysis of variance (ANOVA); error bars represent standard errors of the mean PC scores. Left panels show relative abundances (RAs) for each fungal indicator ASVs by crop rotation and crop rotation × tillage. The crop rotation main effects for PC1 are shown as CCC, continuous corn; Cs, corn phase of the corn-soybean rotation; Sc, soybean phase of the corn-soybean rotation; SSS, continuous soybean. The crop rotation × tillage interaction for PC3 is shown as CCC-NT, continuous corn and no-till; CCC-T, continuous corn, and chisel tillage; Cs-NT, corn phase of the corn-soybean rotation and no-till; Cs-T, corn phase of the corn-soybean rotation and chisel tillage; Sc-NT, soybean phase of the corn-soybean rotation and no-till; Sc-T, soybean phase of the corn-soybean rotation and chisel tillage; SSS-NT, continuous soybean and no-till; SSS-T, continuous soybean and chisel tillage. For each taxon, the response of each ASV was calculated as the mean PC score multiplied by the PC loading score of a given ASV. The y-axes show the name of the ASV’s most explanatory taxonomic rank in parentheses (P, phylum; C, class; O, order; F, family; G, genus; S, species).
The PCA on the 16S rRNA archaeal domain produced 5 PCs (PC1-PC5; Table 5 and Table S5), explaining a total of 69% of the variability in the 11 selected top-contributing archaeal ASVs. As with bacteria and fungi, archaeal indicator microbes were flagged when significant correlations (loadings ≥1 |0.5|) were discovered and identified by the SILVA database to the nearest classification; archaeal classification specifics are listed in Table S5.
The results from the ANOVA on the archaeal community found a crop rotation effect (p = 0.008) for PC1 (Figure 4). The means separation procedure showed that SSS was the largest but not different from Cs, which was not different from Sc; the CCC rotation was the lowest (Figure 4). Significant tillage main effects were detected for PC3 (p = 0.045) and PC4 (p = 0.0032) with tillage being greater than no-till in both cases (Figure 4).
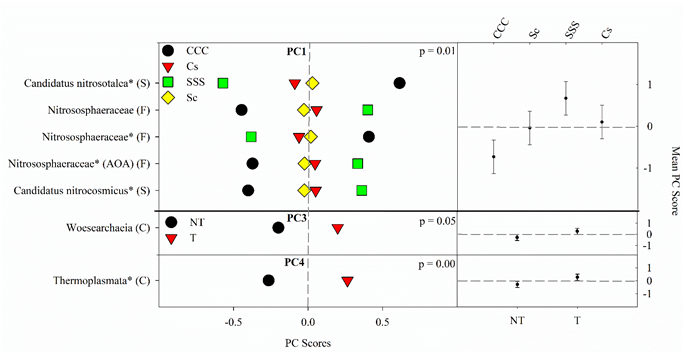
Figure 4. Mean archaeal principal component scores (PC) following 20 years of rotation and tillage treatments. Right panels show the archaeal mean PC score for the main effects of crop rotation for PC1 and tillage for PC3 and PC4 based on the analysis of variance (ANOVA); error bars represent standard errors of the mean PC scores. Left panels show relative abundances (RAs) for each archaeal indicator ASVs by crop rotation and tillage. The crop rotation main effects for PC1 are shown as CCC, continuous corn; Cs, corn phase of the corn-soybean rotation; Sc, soybean phase of the corn-soybean rotation; SSS, continuous soybean. The tillage effects for PC3 and PC4 are shown as NT, no-till; T, chisel tillage. For each taxon, the response of each ASV was calculated as the mean PC score multiplied by the PC loading score of a given ASV. The y-axes show the name of the ASV’s most explanatory taxonomic rank in parentheses (P, phylum; C, class; O, order; F, family; G, genus; S, species). The “*” after an ASV means it is uncultured. AOA denotes ammonia-oxidizing archaea.
This study adds valuable insight as to important microbes and how they respond to typical agricultural management. We found that bacterial indicator microbes responded contrastingly to the two monocultures with the rotated corn and soybean showing intermediate effects, partially confirming our hypothesis. Tillage, too, showed contrasting effects between chisel tillage and NT. Using those strong main effects, we grouped the indicator bacteria into organic matter dependent and acidophile vs. N adverse and neutrophile. This grouping agreed with our previous qPCR publication [19] and fit bacterial characterizations well. From the indicator bacteria, we found that many were involved in the N cycle and respond positively to conditions of increased inorganic N. Unlike bacteria, fewer fungi and archaea were selected as indicator microbes. Fungi were poorly identified, and all were from Sordariomycetes (C), with the top indicator species thriving in the low pH environment of CCC, confirming our hypothesis. The significant archaeal indicators were mainly AOA, preferring the neutral pH in the SSS rotation, though some AOA were found to be acidophile, partially confirming our hypothesis. This study shows the need to fully classify soil organisms to a finer level, which will help better understand the role specific microorganisms play in soil nutrient cycling. Future work should focus on identifying the uncultured yet significant ASVs described in this study. In addition, N cycle genetic analysis of these indicator species would greatly help explain their role in the agroecosystems. Using metagenomics and bioinformatics, we were able to select 49 indicator microbes out of thousands of ASVs from highly productive soils, using typical agronomic management practices from a replicated, long-term trial. These indicator taxa could potentially generate a soil assessment narrative to identify inefficiencies in agronomic practices or indicate possible environmental consequences.


