Submitted Successfully!
To reward your contribution, here is a gift for you: A free trial for our video production service.
Thank you for your contribution! You can also upload a video entry or images related to this topic.
Version Summary Created by Modification Content Size Created at Operation
1 + 2170 word(s) 2170 2021-07-06 12:28:55 |
2 The format is correct Meta information modification 2170 2021-07-09 03:23:52 |

Video Upload Options

Do you have a full video?

Confirm

Are you sure to Delete?
Cite
If you have any further questions, please contact Encyclopedia Editorial Office.
Suarez-Pajes, E.; Díaz-De Usera, A.; Marcelino-Rodríguez, I.; Guillen-Guio, B.; Flores, C. Estimation of Genetic Ancestry. Encyclopedia. Available online: https://encyclopedia.pub/entry/11798 (accessed on 25 April 2024).
Suarez-Pajes E, Díaz-De Usera A, Marcelino-Rodríguez I, Guillen-Guio B, Flores C. Estimation of Genetic Ancestry. Encyclopedia. Available at: https://encyclopedia.pub/entry/11798. Accessed April 25, 2024.
Suarez-Pajes, Eva, Ana Díaz-De Usera, Itahisa Marcelino-Rodríguez, Beatriz Guillen-Guio, Carlos Flores. "Estimation of Genetic Ancestry" Encyclopedia, https://encyclopedia.pub/entry/11798 (accessed April 25, 2024).
Suarez-Pajes, E., Díaz-De Usera, A., Marcelino-Rodríguez, I., Guillen-Guio, B., & Flores, C. (2021, July 07). Estimation of Genetic Ancestry. In Encyclopedia. https://encyclopedia.pub/entry/11798
Suarez-Pajes, Eva, et al. "Estimation of Genetic Ancestry." Encyclopedia. Web. 07 July, 2021.
Estimation of Genetic Ancestry
Edit

Admixed populations arise when two or more ancestral populations interbreed. As a result of this admixture, the genome of admixed populations is defined by tracts of variable size inherited from these parental groups and has particular genetic features that provide valuable information about their demographic history. Diverse methods can be used to derive the ancestry apportionment of admixed individuals, and such inferences can be leveraged for the discovery of genetic loci associated with diseases and traits, therefore having important biomedical implications. 

admixture mapping genetic ancestry ancestry informative markers next-generation sequencing

1. Genetic Admixture

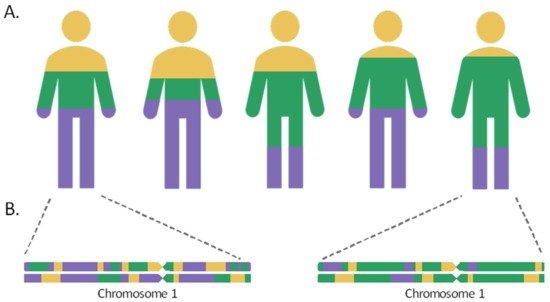
Admixed populations are the result of gene flow between reproductively isolated groups, owing to events that have occurred throughout human history, including migratory events, the discovery of new territories, or the slave trade. As a result of the intermixture and recombination, over time, the genomes of individuals in the hybrid population will contain a mosaic of ancestries from different population sources in their chromosomes. The length of the chromosome segments inherited from the different ancestral populations will be proportional to the time elapsed since the admixture event. These tracts shorten over the generations by the meiotic recombination process, so that the most recently admixed populations, such as the Canary Islanders in Spain or the Latino populations, would retain longer ancestral tracts, while the populations that mixed more distantly in time, such as the Uyghur in China, would harbor shorter ancestry segments in their chromosomes [1][2].

As such, the admixture proportions and the elapsed time since the admixture event can be inferred based on linkage disequilibrium (LD) [3][4]. When two distant populations interbreed, the admixture linkage disequilibrium (ALD) can be generated among loci with different allelic frequencies in the ancestral populations, leading to a linkage between markers that were previously unlinked. During the first generations since the admixture, ALD is expected to experience a rapid decay between distant loci, while it would be maintained between closer positions and can be detected after generations [5]. Additionally, the ALD dynamics of decay are also influenced by the admixture model. For example, a greater drop of ALD and a faster length decrease in the ancestral chromosomal segments are expected for those populations that have been formed by a single mixing event, compared with admixtures maintained throughout generations [1][6].

2. Estimation of Genetic Ancestry: Global and Local Ancestry

Global ancestry (GA) is the fraction of genomic ancestry from each admixed individual that can be ascribed to each of the ancestral populations contributing to the recently admixed population (Figure 1A). The estimate of GA can be obtained using different approaches. Some of the most popular methods are based on probabilistic models using genotype data, assuming that populations are in Hardy–Weinberg equilibrium and considering complete linkage equilibrium for all loci considered for the estimation, such as STRUCTURE [7][8] and ADMIXTURE [9][10]. Alternative approaches that allow the estimation of the ancestry proportions are based on principal component decompositions, such as ipPCA [11], and on the study of LD decay curves, such as ALDER [3].
Ijms 22 06962 g001 550
Figure 1. Global (A) and local (B) genetic ancestries in a recently admixed population with three ancestral populations. The proportion of each of the ancestral populations is represented by the colors yellow, blue, and purple.
Local ancestry (LA) is a term commonly used to refer to the ancestry in each of the chromosome blocks, also known as ancestral tracks, in recently admixed individuals (Figure 1B). For this, the number of copies derived of each ancestral population, in each genomic position, could be inferred per individual (from zero to two copies). Thus, GA can also be obtained by summarizing LA across the individual genomes. Multiple estimators have been developed to infer LA (Table 1). 
Table 1. Most common methods to estimate local genetic ancestry.
SOFTWARE Algorithm Background LD Phasing
Requirement
Genetic Map Physical Map Number of Ancestral Populations Reference
CHROMOPAINTER HMM Yes Phased Optional No ≥2 [12]
EILA k-means No Unphased No Yes 2 or 3 [13]
ELAI Two layers HMM Yes Phased/Unphased a No No ≥2 [14]
HAPMIX HMM Yes Phased /Unphased b Yes No 2 [15]
LAMP-LD HMM Yes Phased/Unphased b No Yes 2, 3 or 5 [16]
Loter Single layer HMM No Phased No No ≥2 [17]
PCAdmix HMM and local PCA No Phased Optional Optional ≥2 [18]
RFMIX CRF No Phased Yes No ≥2 [19]
SABER + HMM Yes Phased No No 2–4 [20][21]
SEQMIX HMM No Unphased Yes No 2 [22]
SupportMix SVM No Phased Yes No ≥2 [23]
a Phased and unphased data are allowed for ancestral and admixed populations. b Phased data are needed for the ancestral populations and unphased data for the admixed population. CRF (Conditional Random Field), HMM (Hidden Markov Model), LD (linkage disequilibrium), PCA (Principal Component Analysis), SVM (Support Vector Machines).
The use of genotyping microarrays has also led to the development of improved methods to infer LA, such as LAMP-LD [16], RFMix [19], and HAPMIX [15], among others (Table 1). Compared to the previous methods that were designed to deal with AIMs, these other algorithms rely on denser sets of genetic markers (retaining LD) that allow one to obtain a higher resolution in estimating LA, most of them based on hidden Markov models [14][16].
In order to identify the optimal approach for each scenario, benchmarking the different algorithms and reference panels is necessary. Previous reviews have compared the characteristics and effectiveness of local ancestry estimators [24][25][26][27][28], suggesting a few main aspects to consider: (1) the prior requirements of each estimator, and (2) the inherent features of the target population itself. Table 1 shows the main characteristics of the most common methods to estimate local ancestry.
Regarding the necessary requirements for the use of each estimator, it must be considered, for example, whether a phasing step is needed prior to ancestry estimation. This step is crucial for an accurate estimate of ancestry and is closely linked to the density of available markers [29].

3. Admixture Mapping Studies

3.1. Definition

The distribution of allelic frequencies in recently admixed populations is closely related to those frequencies found in their ancestral populations [30][31]. When these ancestral populations have marked differences in the susceptibility to a disease, admixture mapping studies, also known as mapping by admixture linkage disequilibrium (MALD) studies, can be performed to reveal genetic loci harboring variants underlying such differences between population groups [32]. Admixture mapping studies aim to correlate LA with a trait of interest in recently admixed populations in which ALD is still detectable, under the hypothesis that variants associated with increased disease risk will be found in chromosomal fragments inherited from one of the parental populations [33][34]. Thus, an increment (or decrease) in the proportion of the ancestry associated with the trait of interest will be expected in these chromosomal regions (Figure 2, Table 2).
Ijms 22 06962 g002 550
Figure 2. Scheme of an admixture mapping study. (A) LA estimates in cases and controls individuals from a recently admixed population. (B) Comparison of local ancestry scores of all chromosomal regions between cases and controls. (C) Fine mapping study on genomic regions where genetic ancestry is associated with a trait.
Table 2. Definition of the main concepts.
Concept Definition
Ancestry informative marker (AIM) Genetic variants, usually SNPs, that show large frequency differences between the parental populations and that are, thus, highly informative for ancestry estimation in admixed populations.
Admixture model A simple model to describe how gene flow between ancestral populations could have occurred. Admixed populations can be the result of a mixture between individuals from two or more populations and that can be maintained in various generations (gradual admixture) or be a result of a single event (hybrid isolation).
Ancestry estimation In admixed populations, this allows the determination of the proportion of each of the ancestries for a given admixture model.
Global ancestry (GA) Estimated ancestry proportion with which each parental population contributes on average to the genome of an admixed individual for a given admixture model.
Local ancestry (LA) Estimated ancestry proportion with which each parental population contributes to each locus of the genome of an admixed individual for a given admixture model.
Admixture mapping Method that allows detecting if the genetic ancestry of a particular section of the genome in a mixed population tends to be inherited with a particular trait.

3.2. Advantages and Disadvantages of Admixture Mapping Studies

As a major advantage, given that LA tracks are usually large, often measured in the megabase-scale, the significance penalty of these studies is much lower than for GWAS, therefore increasing the statistical power for a given sample size [30]. Furthermore, these studies are less affected by allelic heterogeneity than GWAS, because they are based on LA and not on SNP alleles directly.

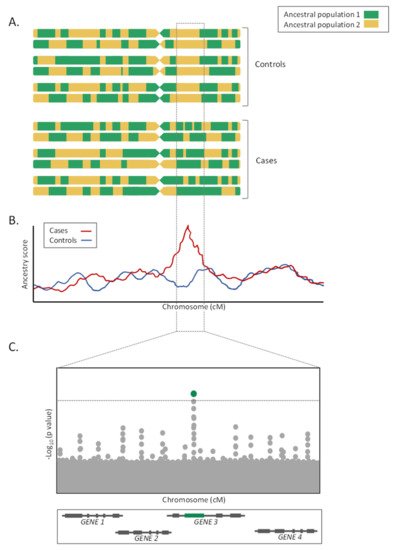
On the contrary, admixture mapping studies lose efficiency when allele frequencies are similarly distributed among ancestral populations and when the LD in the parental populations is unknown [35][36]. Furthermore, for the LA estimations to be accurate, the choice of the LA estimator, as well as the number and density of genotyped markers, is critical [36]. Additionally, given the megabase size of the loci detected by the admixture mapping approaches, fine mapping studies or candidate gene association studies focused on the prioritized genomic regions must follow for the study to be fully completed (Figure 2C). Finally, as in the GWAS, admixture mapping approaches only allow the detection of the genetic risks associated with the trait of interest, and do not consider the environmental, cultural, or socioeconomic factors [35].

3.3. Applications of Admixture Mapping Studies in Biomedical Research

Based on admixed populations, several studies have implemented admixture mapping approaches to reveal novel risk factors associated with complex diseases, including cancer, hypertension, and autoimmune, respiratory, and infectious diseases. Primarily, these studies have been widely applied in African Americans and Hispanic/Latino populations. The genetic contribution of each of the parental populations has been estimated for African Americans from four different states, providing an estimate of average ancestry corresponding to 76.4% African, 20.9% European, and 2.7% Native American [37]. A similar approach was carried out in the Hispanic population of Southern Colorado, for whom the composition was reported to correspond to 62.7% European, 34.1% Native American, and 3.2% African [38]. However, these estimates differ widely between the states [39]. In this sense, recent studies in African American populations have found genomic regions with increased proportions of African ancestry associated with risk of prostate and breast cancer [40][41][42].

4. NGS and Genetic Ancestry Estimation

The technological development of NGS over the years, together with the reduction in the sequencing costs, offers a great opportunity for genetic ancestry studies to develop further. Among the major advantages of this technology compared to microarrays (Table 3) is its high-throughput capacity, resulting in thousands of DNA fragments being sequenced simultaneously, offering the possibility of covering a larger fraction of the genome. Therefore, the use of NGS, especially of whole-genome sequencing (WGS), allows an increase in the number of markers tested to infer LA, and the possibility to find optimal ancestry-specific genetic markers. This permits one to obtain reference panels of ancestral populations and then design panels of more restricted AIMs, as done by Li-Ju Wang and colleagues, who proposed a specific panel of AIMs to infer three-way genetic admixture (European, East Asian, and African) by using whole-exome sequencing (WES) data [43]. Furthermore, the NGS technology allows the detection of information from the entire spectrum of allelic frequencies, from common variants to low-frequency and rare variants, which, by definition, are expected to be more structured among populations compared to the common variation that is typically covered by most SNP genotyping microarrays. This leads to better detection of population-specific variants and, therefore, improved LA estimation [44]. Additionally, another advantage offered by the NGS is that detected SNPs are not affected by ascertainment bias, which is induced by an incorrect or nonrepresentative selection of markers. In this sense, Maróti and colleagues assessed the used of WGS, WES, and SNP genotyping microarray data in population genetic analyses [45]. Their results suggested that SNP genotyping data may be more prone to biasing the results, as they are related to significantly higher cross-validation error values and an overestimation of the admixture proportions than are WES or WGS data. Accordingly, Lachance and Tishkoff suggested that the use of biased markers from genotyping arrays may misestimate LD and overestimate population differences [46]. Since these aspects are important for LA inference and, consequently, for the proper performance of an admixture mapping study, we anticipate that the use of NGS will lead to more accurate estimates.

Table 3. Advantages and disadvantages of using NGS for LA estimation.
Advantages Disadvantages
  • Larger fraction of the genome covered.
  • Detection of low-frequency and population-specific variants.
  • More accurate LA estimate.
  • SNPs not affected by ascertainment bias.
  • Lack of specific algorithms and software.
  • Accuracy depends on sequencing coverage.
  • WES covers a small portion of the genome.
  • Higher computational and economic costs.
LA (Local ancestry), WES (Whole-Exome Sequence), SNP (Single Nucleotide Polymorphism).

5. Concluding Remarks

Genetic ancestry studies and admixture mapping approaches have expanded genetic knowledge in biomedical research, revealing new loci associated with traits and diseases that could not have been detected by conventional association studies. Despite this, the available genomic resources need to be improved to obtain more accurate ancestry inferences. 

In summary, promoting genetic studies in admixed populations, and the use of admixture mapping studies, combined with the alternative approaches described, promise the identification of novel disease associations and a better understanding of complex trait genetics. Eventually, these results will translate into a more equitable representation of the catalogs of genetic variation across populations.

References

  1. Jin, W.; Li, R.; Zhou, Y.; Xu, S. Distribution of ancestral chromosomal segments in admixed genomes and its implications for inferring population history and admixture mapping. Eur. J. Hum. Genet. 2014, 22, 930–937.
  2. Guillen-Guio, B.; Lorenzo-Salazar, J.M.; Gonzalez-Montelongo, R.; Díaz-de Usera, A.; Marcelino-Rodrıguez, I.; Corrales, A.; de Leon, A.C.; Alonso, S.; Flores, C. Genomic analyses of human European diversity at the southwestern edge: Isolation, African influence and disease associations in the Canary Islands. Mol. Biol. Evol. 2018, 35, 3010–3026.
  3. Loh, P.R.; Lipson, M.; Patterson, N.; Moorjani, P.; Pickrell, J.K.; Reich, D.; Berger, B. Inferring admixture histories of human populations using linkage disequilibrium. Genetics 2013, 193, 1233–1254.
  4. Zhou, Y.; Qiu, H.; Xu, S. Modeling Continuous Admixture Using Admixture-Induced Linkage Disequilibrium. Sci. Rep. 2017, 7, 43054.
  5. Chakraborty, R.; Weiss, K.M. Admixture as a tool for finding linked genes and detecting that difference from allelic association between loci. Proc. Natl. Acad. Sci. USA 1988, 85, 9119–9123.
  6. Pfaff, C.L.; Parra, E.J.; Bonilla, C.; Hiester, K.; McKeigue, P.M.; Kamboh, M.I.; Hutchinson, R.G.; Ferrell, R.E.; Boerwinkle, E.; Shriver, M.D. Population structure in admixed populations: Effect of admixture dynamics on the pattern of linkage disequilibrium. Am. J. Hum. Genet. 2001, 68, 198–207.
  7. Falush, D.; Stephens, M.; Pritchard, J.K. Inference of population structure using multilocus genotype data: Dominant markers and null alleles. Mol. Ecol. Notes 2007, 7, 574–578.
  8. Pritchard, J.K.; Stephens, M.; Donnelly, P. Inference of Population Structure Using Multilocus Genotype Data. Genetics 2000, 155, 945–959.
  9. Alexander, D.H.; Novembre, J.; Lange, K. Fast model-based estimation of ancestry in unrelated individuals. Genome Res. 2009, 19, 1655–1664.
  10. Alexander, D.H.; Lange, K. Enhancements to the ADMIXTURE algorithm for individual ancestry estimation. BMC Bioinform. 2011, 12, 246.
  11. Limpiti, T.; Intarapanich, A.; Assawamakin, A.; Shaw, P.J.; Wangkumhang, P.; Piriyapongsa, J.; Ngamphiw, C.; Tongsima, S. Study of large and highly stratified population datasets by combining iterative pruning principal component analysis and structure. BMC Bioinform. 2011, 12, 255.
  12. Lawson, D.J.; Hellenthal, G.; Myers, S.; Falush, D. Inference of population structure using dense haplotype data. PLoS Genet. 2012, 8, e1002453.
  13. Yang, J.J.; Li, J.; Buu, A.; Williams, L.K. Efficient inference of local ancestry. Bioinformatics 2013, 29, 2750–2756.
  14. Guan, Y. Detecting structure of haplotypes and local ancestry. Genetics 2014, 196, 625–642.
  15. Price, A.L.; Tandon, A.; Patterson, N.; Barnes, K.C.; Rafaels, N.; Ruczinski, I.; Beaty, T.H.; Mathias, R.; Reich, D.; Myers, S. Sensitive detection of chromosomal segments of distinct ancestry in admixed populations. PLoS Genet. 2009, 5, e1000519.
  16. Baran, Y.; Pasaniuc, B.; Sankararaman, S.; Torgerson, D.G.; Gignoux, C.; Eng, C.; Rodriguez-Cintron, W.; Chapela, R.; Ford, J.G.; Avila, P.C.; et al. Fast and accurate inference of local ancestry in Latino populations. Bioinformatics 2012, 28, 1359–1367.
  17. Dias-Alves, T.; Mairal, J.; Blum, M.G.B. Loter: A software package to infer local ancestry for a wide range of species. Mol. Biol. Evol. 2018, 35, 2318–2326.
  18. Brisbin, A.; Bryc, K.; Byrnes, J.; Zakharia, F.; Omberg, L.; Degenhardt, J.; Reynolds, A.; Ostrer, H.; Mezey, J.G.; Bustamante, C.D. Pcadmix: Principal components-based assignment of ancestry along each chromosome in individuals with admixed ancestry from two or more populations. Hum. Biol. 2012, 84, 343–364.
  19. Maples, B.K.; Gravel, S.; Kenny, E.E.; Bustamante, C.D. RFMix: A discriminative modeling approach for rapid and robust local-ancestry inference. Am. J. Hum. Genet. 2013, 93, 278–288.
  20. Tang, H.; Coram, M.; Wang, P.; Zhu, X.; Risch, N. Reconstructing genetic ancestry blocks in admixed individuals. Am. J. Hum. Genet. 2006, 79, 1–12.
  21. Johnson, N.A.; Coram, M.A.; Shriver, M.D.; Romieu, I.; Barsh, G.S.; London, S.J.; Tang, H. Ancestral Components of Admixed Genomes in a Mexican Cohort. PLoS Genet. 2011, 7, e1002410.
  22. Hu, Y.; Willer, C.; Zhan, X.; Kang, H.M.; Abecasis, G.R. Accurate Local-Ancestry Inference in Exome-Sequenced Admixed Individuals via Off-Target Sequence Reads. Am. J. Hum. Genet. 2013, 93, 891–899.
  23. Omberg, L.; Salit, J.; Hackett, N.; Fuller, J.; Matthew, R.; Chouchane, L.; Rodriguez-Flores, J.L.; Bustamante, C.; Crystal, R.G.; Mezey, J.G. Inferring genome-wide patterns of admixture in Qataris using fifty-five ancestral populations. BMC Genet. 2012, 13, 49.
  24. Geza, E.; Mugo, J.; Mulder, N.J.; Wonkam, A.; Chimusa, E.R.; Mazandu, G.K. A comprehensive survey of models for dissecting local ancestry deconvolution in human genome. Brief. Bioinform. 2019, 20, 1709–1724.
  25. Schubert, R.; Andaleon, A.; Wheeler, H.E. Comparing local ancestry inference models in populations of two- And three-way admixture. PeerJ 2020, 8, 1–19.
  26. Hui, D.; Fang, Z.; Lin, J.; Duan, Q.; Li, Y.; Hu, M.; Chen, W. LAIT: A local ancestry inference toolkit. BMC Genet. 2017, 18, 83.
  27. Yuan, K.; Zhou, Y.; Ni, X.; Wang, Y.; Liu, C.; Xu, S. Models, methods and tools for ancestry inference and admixture analysis. Quant. Biol. 2017, 5, 236–250.
  28. Thornton, T.A.; Bermejo, J.L. Local and global ancestry inference and applications to genetic association analysis for admixed Populations. Genet. Epidemiol. 2014, 38, S5–S12.
  29. Browning, S.R.; Browning, B.L. Haplotype phasing: Existing methods and new developments. Nat. Rev. Genet. 2011, 12, 703–714.
  30. Shriner, D.; Adeyemo, A.; Ramos, E.; Chen, G.; Rotimi, C.N. Mapping of disease-associated variants in admixed populations. Genome Biol. 2011, 12, 223.
  31. Auton, A.; Abecasis, G.R.; Altshuler, D.M.; Durbin, R.M.; Bentley, D.R.; Chakravarti, A.; Clark, A.G.; Donnelly, P.; Eichler, E.E.; Flicek, P.; et al. A global reference for human genetic variation. Nature 2015, 526, 68–74.
  32. Claiborne Stephens, J.; Briscoe, D.; O’Brien, S.J. Mapping by admixture linkage disequilibrium in human populations: Limits and guidelines. Am. J. Hum. Genet. 1994, 55, 809–824.
  33. McKeigue, P.M. Mapping genes underlying ethnic differences in disease risk by linkage disequilibrium in recently admixed populations. Am. J. Hum. Genet. 1997, 60, 188–196.
  34. McKeigue, P.M. Mapping genes that underlie ethnic differences in disease risk: Methods for detecting linkage in admixed populations, by conditioning on parental admixture. Am. J. Hum. Genet. 1998, 63, 241–251.
  35. Shriner, D. Overview of Admixture Mapping. Curr. Protoc. Hum. Genet. 2017, 94, 1.23.1–1.23.8.
  36. Smith, M.W.; O’Brien, S.J. Mapping by admixture linkage disequilibrium: Advances, limitations and guidelines. Nat. Rev. Genet. 2005, 6, 623–632.
  37. Reiner, A.P.; Ziv, E.; Lind, D.L.; Nievergelt, C.M.; Schork, N.J.; Cummings, S.R.; Phong, A.; Burchard, E.G.; Harris, T.B.; Psaty, B.M.; et al. Population structure, admixture, and aging-related phenotypes in African American adults: The cardiovascular health study. Am. J. Hum. Genet. 2005, 76, 463–477.
  38. Bonilla, C.; Parra, E.J.; Pfaff, C.L.; Dios, S.; Marshall, J.A.; Hamman, R.F.; Ferrell, R.E.; Hoggart, C.L.; McKeigue, P.M.; Shriver, M.D. Admixture in the Hispanics of the San Luis Valley, Colorado, and its implications for complex trait gene mapping. Ann. Hum. Genet. 2004, 68, 139–153.
  39. Bryc, K.; Durand, E.Y.; Macpherson, J.M.; Reich, D.; Mountain, J.L. The genetic ancestry of african americans, latinos, and european Americans across the United States. Am. J. Hum. Genet. 2015, 96, 37–53.
  40. Freedman, M.L.; Haiman, C.A.; Patterson, N.; McDonald, G.J.; Tandon, A.; Waliszewska, A.; Penney, K.; Steen, R.G.; Ardlie, K.; John, E.M.; et al. Admixture mapping identifies 8q24 as a prostate cancer risk locus in African-American men. Proc. Natl. Acad. Sci. USA 2006, 103, 14068–14073.
  41. Bock, C.H.; Schwartz, A.G.; Ruterbusch, J.J.; Levin, A.M.; Neslund-Dudas, C.; Land, S.J.; Wenzlaff, A.S.; Reich, D.; McKeigue, P.; Chen, W.; et al. Results from a prostate cancer admixture mapping study in African-American men. Hum. Genet. 2009, 126, 637–642.
  42. Ruiz-Narváez, E.A.; Sucheston-Campbell, L.; Bensen, J.T.; Yao, S.; Haddad, S.; Haiman, C.A.; Bandera, E.V.; John, E.M.; Bernstein, L.; Hu, J.J.; et al. Admixture mapping of African-American women in the AMBER Consortium identifies new loci for breast cancer and estrogen-receptor subtypes. Front. Genet. 2016, 7, 1–10.
  43. Wang, L.J.; Zhang, C.W.; Su, S.C.; Chen, H.I.H.; Chiu, Y.C.; Lai, Z.; Bouamar, H.; Ramirez, A.G.; Cigarroa, F.G.; Sun, L.Z.; et al. An ancestry informative marker panel design for individual ancestry estimation of Hispanic population using whole exome sequencing data. BMC Genom. 2019, 20, 1007.
  44. Brown, R.; Pasaniuc, B. Enhanced Methods for Local Ancestry Assignment in Sequenced Admixed Individuals. PLoS Comput. Biol. 2014, 10, e1003555.
  45. Maróti, Z.; Boldogkői, Z.; Tombácz, D.; Snyder, M.; Kalmár, T. Evaluation of whole exome sequencing as an alternative to BeadChip and whole genome sequencing in human population genetic analysis. BMC Genom. 2018, 19, 778.
  46. Lachance, J.; Tishkoff, S.A. SNP ascertainment bias in population genetic analyses: Why it is important, and how to correct it. BioEssays 2013, 35, 780–786.
More
Information
Contributors MDPI registered users' name will be linked to their SciProfiles pages. To register with us, please refer to https://encyclopedia.pub/register : , , , ,
View Times: 380
Revisions: 2 times (View History)
Update Date: 09 Jul 2021
1000/1000