1000/1000
Hot
Most Recent
 +1 point
Transcriptional spatial profiling enables characterization of the cancer immune profile by providing quantitative gene expression data that retains critical spatial information. It encompasses both well-known technologies such as in-situ hybridization and digital spatial profiling as well as emerging technologies such as Visium Spatial Gene Expression Solution. These technologies may be used to identify and subsequently block the source of tumour heterogeneity that underlies treatment resistance, disease progression and cancer relapse. By combining sequencing data with spatial information, transcriptional spatial profiling technologies hold great promise in uncovering novel biomarkers, potential drug targets and pathogenic mechanisms.
Immunotherapy has emerged as a promising and powerful pillar in the fight against cancer: These therapeutics activate the patient’s immune system to kill cancer cells. Current immunotherapeutic strategies are based on cancer vaccines, cytokines (such as interleukin-2), adoptive cell transfer (ACT), and immune checkpoint inhibition [1][2]. These treatments have shown great promise, and immune checkpoint inhibitors targeting the programmed cell death-1/programmed cell death-ligand 1 (PD-1/PD-L1) pathway in particular, have now been approved as first- or second-line treatments for melanoma, lymphoma, and other malignancies [3]. However, only a minority of patients positively respond to treatment [4]; some patients ultimately develop resistance [5] and/or even suffer adverse reactions [6] and autoimmune toxicity [7] as a result of the treatment. The reason for this poor result in a subset of patients is partly attributed to the composition of the dynamic tumour microenvironment (TME) [8][9][10]. Here, a complex interplay between tumour cells, infiltrating immune cells, and the stroma as well as the location and density of immune cell populations affects disease progression and responses to therapy [11][12]. This paradigm has spurred the development of technologies that can characterize the cancer immune profile while retaining spatial information of the various cell types. Spatial information is critical, as visualizing the interplay between the tumour and various cell groups that mediate immune surveillance will improve our understanding of pathogenic mechanisms and potential drug targets. Spatial context, including cell–cell distances and feature heterogeneity, can also be correlated with clinical outcomes to identify predictive biomarkers for responses to immunotherapy [13]. Meanwhile, analysing how current immunotherapeutic strategies alter the TME architecture and immune context can help guide future treatment approaches [14]. Together, we are better able to identify novel biomarkers, potential drug targets and pathogenic mechanisms.
Multiplex immunohistochemistry/immunofluorescence (mIHC/IF) is one commonly used tool that enables the simultaneous detection of up to 40 markers of interest in a single tissue sample [15][16]. This approach was better able to predict the cellular response to PD-1/PD-L1 therapy compared to analyses of the tumour mutational burden (TMB) or gene expression profile (GEP) alone [17]. This is because mIHC/IF has a spatial component that provides information on the TME architecture and co-expression of multiple cellular markers, unlike TMB analyses, which only provide quantitative measurements of mutations in tumour cells [18], and GEP, which only measures mRNA transcript levels of immune-related genes or signatures [19]. However, despite these promising findings, multiplexed spatial analyses are limited by the number of markers that can be detected at any one time, compared to genomic techniques, which can provide a holistic view of the entire genome or transcriptome [20]. As a result, we tend to bias our selection of markers and thus have limited capacity for spatial analyses that follow a hypothesis-driven rather than an unbiased data-driven approach. Next-generation sequencing (NGS) has circumvented this limitation of mIHC/IF and enabled higher throughput whole-genome or whole-transcriptome sequencing compared to conventional mIHC/IF techniques [21][22]. However, such sequencing performed on bulk tissues or single cells after enzymatic dissociation comes at the sacrifice of critical spatial information [23][24].
Given these limitations, researchers and developers have focused efforts on finding a one-stop solution that offers both the breadth and depth of sequencing coverage of biomarkers as well as adequate resolution and spatial information. Spatial transcriptomics (ST) holds great promise in this area, providing researchers with the ability to identify novel biomarkers and insight into the dynamic interplay between tumour cells, adipose tissue, vessels, tertiary lymphoid structures, and the stroma in the TME [25].
In situ hybridization (ISH) is a molecular technique to visualize specific DNA or RNA molecules in cells or tissues. ISH is based on the complementary nature of DNA/DNA or DNA/RNA double strands and the hybridization of a labelled nucleic acid probe onto the target in situ. In this way, we can obtain useful spatial information. Traditionally, nucleic acid probes are attached to a radioactive label [26][27][28]; however, this approach has been largely replaced by a fluorochrome. The result is fluorescence in situ hybridization or FISH. FISH itself has been further developed into techniques known as multiplexed single-molecule FISH (smFISH), which is able to simultaneously detect approximately 10,000 genes and around 70,000–100,000 RNA molecules per cell at a single-molecule resolution.
Digital spatial profiling (DSP) is a high-plex spatial profiling method that overcomes the key limitations of multiplexed smFISH techniques, including prolonged experimental times that decrease sample throughput, the limited capacity to only assess a single analyte type (RNA or protein), a lack of FFPE compatibility, and the lack of a commercial integrated system. DSP uses oligonucleotide detection technologies to quantify protein or RNA levels in FFPE tissue samples. Unlike sequential hybridization techniques, such as MERFISH, which have prolonged experimental times of up to 48 h for one slide (including probe hybridization) [29], DSP offers a more efficient workflow that generates results from 10–20 tissue sections or up to 384 regions of interest within 48 hours [30]. In addition, DSP can detect up to 96 proteins or 1400 mRNA simultaneously [20][30] as compared to multiplex smFISH, which only profiles RNA. This feature is particularly relevant for cancer immunotherapy, as discrepancies in mRNA and protein expression patterns can be used to elucidate post-transcriptional regulation and post-translational modifications contributing to protein instability and affecting prognosis and response to therapy [20][31]. DSP is also particularly attractive for clinical use as it offers a commercial integrated system that is highly automated, and optimized workflows, validated assays, and data analysis software are available. In addition, it also preserves the integrity of tissue samples, allowing precious samples to be stored and used for further analysis in the future.
Although DSP shows promise in the context of immunotherapy research, some key limitations remain. Firstly, DSP requires the selection of regions of interest (ROI) for analysis. This is mostly an automated process that allows great flexibility in the types of ROI selection, such as geometric, gridded, rare cell population profiling, and segmentation into the tumour and TME [20][31]. While this is particularly useful in interrogating the TME and features of interest, it prevents whole-tissue analysis especially in larger excisional biopsy samples and may lead to a biased hypothesis-driven sample analysis [32][33]. In addition, DSP has poor single-cell resolution, requiring at least 10 cells in an ROI to generate adequate counts [34][35]. This restriction might limit the effectiveness of DSP when analysing tumour regions with low cellularity. Secondly, DSP only provides images based on its ‘morphology kit’ for no more than four colours. Multiplexing only provides numerical data in the form of counts that are detected within the ROI. As there is no reconstructed tissue image, it is not possible to ascertain staining quality and there is a loss of critical spatial information [33]. Furthermore, the multiplexing capacity is limited to up to 1400 genes [30], which is comparatively less than other tools, such as MERFISH and Visium (discussed below), which have multiplexing capacities of 10,000 and 100,000 genes, respectively. There have been efforts to overcome this limited multiplexing capacity by integrating DSP with NGS readout, which theoretically might lead to an unlimited multiplexing capacity, but studies have yet to demonstrate this [32][36]. This lack of sequencing information offered by DSP has thus spurred the development of spatial transcriptomics (ST), which enables unprecedented full-transcriptome profiling while retaining spatial context.
During single-cell RNA sequencing, spatial information is lost as tissues are often homogenized to obtain an averaged overview of the transcriptome [37][38]. Although this technique is widely used to explore gene expression profiles at a single-cell level, it confers a low capture efficiency and sequencing coverage, as well as a high rate of dropout events, which together can impede downstream data analysis and interpretation [38][39][40]. Recently, the emerging field of spatial genomics entered the arena, with the development of a technique pioneered by a company aptly named “Spatial Transcriptomics” (Stockholm, Sweden). This technique enables quantitative visualisation and analysis of the transcriptome within intact tissue sections with the use of spatially barcoded oligo-deoxythymidine microarrays [37][38]. Here, unique positional barcodes are introduced onto glass slides to preserve spatial positioning within the tissue architecture before proceeding with the RNA sequencing process [41] (Figure 1).
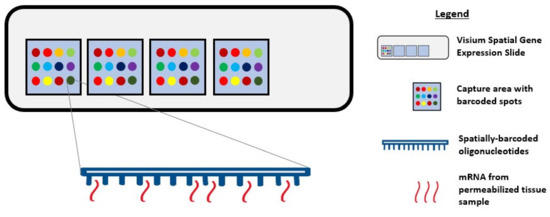
Figure 1. Diagram showing Visium Spatial Gene Expression Solution. Tissue samples are sectioned and placed in the 4 capture areas on the Visium Spatial Gene Expression slide. Each capture area contains over 5000 barcoded spots and each spot has multiple spatially barcoded oligonucleotides that will bind to mRNA released from permeabilized tissue samples.
This novel technique was first demonstrated on the mouse olfactory bulb, and it follows a standard workflow as follows: Tissue sectioning, fixation, haematoxylin and eosin (H&E) staining, bright-field imaging, tissue permeabilization, cDNA synthesis, tissue removal, probe release, library preparation, sequencing, data processing, data visualization, and analysis [38][42][43][44]. Notably, a distinctive feature of this workflow is the ability to generate an on-slide cDNA library with preserved spatial information, making it possible to visually map the gene expression profile to its corresponding tissue morphology [42]. This possibility encourages the identification of novel gene targets and the early detection of premalignant tissue areas that might not be identifiable by pathologists.
Various success stories applying spatial transcriptomics (ST) techniques have been reported in the literature, based on identifying unique gene expression profiles in tissue biopsies prior to histopathological annotations. Data analysis of breast cancer [38], prostate cancer [45], and cutaneous malignant melanoma [46] biopsies by ST have revealed an unprecedented level of intra- and inter-tumoral heterogeneity, as well as distinct differences in gene expression profiles between the annotated tumour area and periphery that were not evident through RNA sequencing analysis and/or standard morphological annotations. Moreover, in vivo experimentation utilising this technique has identified the induction of IL-6 signalling by repopulating microglia, which might have value in the therapeutic context [47]. Of course, histopathological annotations and single-cell RNA sequencing can identify aberrant tissue morphologies and confirm the presence of genetically distinct cell populations, respectively; however, ST can highlight distinct spatial regions based on gene expression profiles.
To harness the potential of ST, researchers recently developed an analytical approach known as multimodal intersection analysis (MIA). MIA incorporates datasets generated from single-cell RNA sequencing and ST techniques to produce an unbiased map of transcripts across the tissue footprint at a cellular level. As a proof-of-concept, MIA was performed on a pancreatic ductal adenocarcinoma dataset and revealed specific cell type and subpopulation enrichment across spatially restricted regions that was previously unknown or undetectable [37].
Based on the concept pioneered by Spatial Transcriptomics, Visium Spatial Gene Expression Solution (10× Genomics, USA) was recently released with enhancements, such as a higher resolution and increased sensitivity, compared to the first iterations of the ST technique [48]. In the context of human squamous cell carcinoma [49], single-cell RNA sequencing revealed a distinct subpopulation of tumour-specific keratinocytes (TSKs) with signature genes associated with epithelial-mesenchymal transition and invasive behaviours. The first-generation ST technique identified clear TSK clusters at the tumour leading edges, including TSK marker MMP10, in each patient. Using the enhanced Visium technique, additional spot transcriptomes were identified and as such, enrichment of endothelial and cancer-associated fibroblast-associated transcripts at the stroma were demonstrated. This finding reveals and supports a fibrovascular niche surrounding TSKs in the tumour microenvironment.
Visium is a well-built platform for in-depth investigations of diseases that are associated with tissue structure and function. This is because it can identify tissue regions with aberrant gene expression, allowing for the discovery of novel biomarkers within an area. For example, the laminar organization of the human cerebral cortex is highly complex; studies of neurological disorders have proposed that differences in pathology and gene expression profiles are localized to specific cortical layers [50]. By applying Visium to the human dorsolateral prefrontal cortex, researchers have successfully defined the spatial topography of gene expression profiles within the tissue, identified several formerly underappreciated layer-enriched expression profiles, and verified laminar enrichment of several genes in specific cortical layers [51]. These findings suggest that as well as cancer immunotherapy, Visium could also be applied to neurological disorders.
The Visium software programs for data analysis and visualisation of the generated cDNA library to achieve multidimensional datasets are provided by 10× Genomics (Space Ranger and Loupe Browser). With an end-to-end workflow, Visium can be easily integrated into existing lab infrastructure; no specialised equipment is required other than a cryostat, microscope, and sequencer [42]. The 10× Genomics platform has been used to profile tumour-associated macrophages (TAMs) from patient biopsies, where it helped to quantify the main subpopulations. By mapping glioma structures, it was revealed that microglia take the lead in tumour infiltration while blood-derived TAMs are enriched near blood vessels. As a result, a negative correlation between blood-derived TAMs and low-grade gliomas was reported. This finding supports the notion that macrophage ontogeny is critical to shaping macrophage activation in the glioma microenvironment [52].
Particularly in the field of spatial genomics, 10× Genomics’ Visium is a promising platform with the capacity to construct high-resolution microscopic images with gene expression data aligned to the tissue footprint. It allows flexibility to analyse spatial gene expression from different angles within a single experiment and because it embraces the ST technique, users can perform multiple data generation without losing valuable information as original tissue transcripts are conserved on the slide [51]. Apart from the software programs provided by 10× Genomics, Itai Yanai and his team proposed that Visium might also be compatible with MIA [53].
Despite its great promise, there are limitations to Visium that must be noted. Although the recommended optimal tissue thickness is 10 µm, this value is dependent on the tissue type and composition. 10× Genomics have produced a support site that provides users with an updated list of compatible tissues and the corresponding thicknesses; to date, there are currently 4 rat tissues, 20 mouse tissues, and 19 human tissues listed, as well as 4 tissues planned for further optimisation [54]. Users are also recommended to run a one-time optimisation experiment for every new tissue type, as tissue permeabilization conditions vary between tissues, species, and even laboratories. We anticipate that 10× Genomics’ Visium Spatial Tissue Optimization Slide and Reagent Kit will aid in ensuring tissue compatibility and a better workflow. Furthermore, although Visium has only been validated in fresh-frozen specimens [42], early studies suggest that it can be used for genome-wide spatial profiling in FFPE specimens as well [55]. Lastly, as part of ST enhancement, each tissue capture area contains ~5000 spots with an individual spot size of 55 µm; this generates a cell resolution of 1–10 cells per spot depending on the tissue type and thickness [56]. While some might find this resolution satisfactory, extra precaution should be taken when analysing spots at a boundary. One suggestion is to integrate MIA into the workflow to allow read-outs at a cellular level. Regardless of these limitations, because Visium can promptly identify aberrant gene expression profiles and detect emerging hallmarks of cancer initiation and progression without losing spatial information, we feel that the potential of Visium prevails over the aforementioned technologies.
Transcriptional spatial profiling techniques have rapidly evolved over recent years. From early tools, such as FISH-based technologies, that allow for the analysis of a few gene targets to recent developments, such as Visium, that allow unprecedented whole-transcriptome analysis, we are now able to characterize the cancer immune profile with high-throughput technologies while retaining critical spatial information and resolution. With such rapid advancements in spatial profiling techniques, the relevance of traditional multiplex IHC/IF may come into question. Multiplex IHC/IF has been used extensively in both the research and clinical settings to simultaneously detect multiple target proteins in the same tissue sample. Although there are numerous commercialized multiplexed tissue imaging techniques available, such as multiplexed ion beam imaging (MIBI) [57] and imaging mass cytometry (IMC) that evaluate up to 40 biomarkers at any one time [58], these techniques still lack the high multiplexing capacity and spatial information offered by other transcriptional spatial profiling techniques. However, multiplex IHC/IF still retains key advantages in cancer tissue analysis that are worth remembering. Firstly, proteins are functional molecules and hence, gene expression that is evaluated using transcriptional spatial profiling techniques might not necessarily correlate with protein expression. This is particularly relevant in PD-L1 checkpoint inhibitor therapy, where PD-L1 IHC is the primary biomarker assay currently used for selection of patients for checkpoint inhibitor therapy as increased PD-L1 tissue expression is associated with improved survival rates [59][60]. Interestingly, in two separate studies [61][62] that used transcriptomic technology to predict the response to anti-PD1 therapy, it was found that genes involved in the checkpoint pathway, such as PD-L1 and CD8A/B, showed no significant association with response to therapy [19]. Instead, inflammatory tumour phenotypes [61] and the expression levels of metabolic-related genes [62] were found to predict an anti-PD1 response. Thus, while transcriptional spatial profiling techniques may enable extensive sequencing up to the entire genome level, one must consider that not every mRNA transcript necessarily leads to translation and synthesis of biologically active proteins that contribute to tumour initiation, progression, and therapeutic response. This may be attributed to the heterogeneity in signalling pathways, post-translational modifications, and protein isoforms, which limits the utility of mRNA abundance as a proxy for protein abundance and activity [63][64][65][66]. Therefore, protein-based technologies, such as multiplex IHC/IF, remain integral for downstream analysis after transcriptomics studies as they serve as an excellent endpoint to validate protein function after identifying genetic targets. Multiplex IHC/IF is not redundant, and instead, should be viewed as a complementary tool to the transcriptional spatial profiling techniques discussed above.
Despite being relatively new, transcriptional spatial profiling technologies have been explored widely in cancer immunotherapy. FISH and RNAscope are useful clinical tools for the diagnosis and prognostication of solid and haematological cancers [67][68][69]. Newer techniques, such as MERFISH and Visium, have overcome some of the limitations to their multiplexing capacity by enabling bulk transcriptome analysis with an unprecedented level of resolution and sensitivity [70][71]. The increasing accessibility of such techniques is exciting for the field of cancer immunology, as they enable the discovery of novel biomarkers that serve to predict responses to immunotherapy and permit personalized treatment approaches based on the heterogeneity of their unique TME [45][46]. These spatial profiling techniques can potentially be combined with dimensionality-reduction techniques, such as uniform manifold approximation and projection (UMAP), to visualize the immune landscape of the tumour microenvironment (Figure 2a). This will provide critical information about the immune cells surrounding the tumour border and stroma (Figure 2b) and can be correlated with clinical outcomes to determine predictive biomarkers. For instance, as intra-tumoral tissue hypoxia can also contribute to the heterogeneity of the tumour microenvironment, visualization of the hypoxia gradient (Figure 2c) is critical for determining treatment resistance and prognosis. Thus, overlaying the UMAP and hypoxia gradient (Figure 2d) can help provide a more holistic visualization of the heterogenous tumour microenvironment.
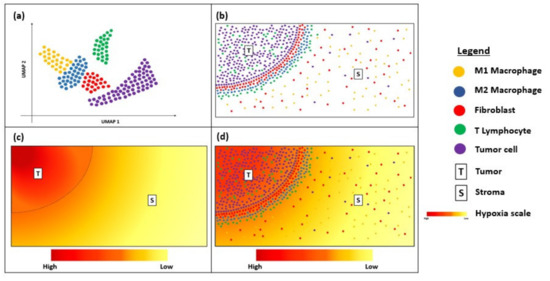
Figure 2. Diagram showing uniform manifold approximation and projection (UMAP) and hypoxia gradient in a tissue sample. (a) UMAP showing the immune landscape of tumour micro-environment; (b) Immune cells surrounding the tumour border; (c) Hypoxia gradient of tumour micro-environment; (d) Overlay of UMAP and the hypoxia gradient to visualize heterogeneity of the tumour micro-environment.
Going forward, DSP offers spatial profiling and digital characterization of mRNA expression but remains limited by the number of gene targets that can be investigated simultaneously. However, its operation via a commercial platform with an optimized pipeline for both protein and RNA targets is likely to be attractive to some users [72]. Although Visium is relatively new to the market, 10× Genomics has recently released a new protocol that allows for IF staining instead of the conventional H&E staining. By combining whole-transcriptome analysis with protein detection in this way, users can spatially map cell populations and their gene expression profiles within tissues by visualizing co-localized protein and gene expression simultaneously [73]. Through the constant improvements made within a short time, Visium holds great potential to provide new insights into disease pathology and clinical translational research.
Given the variety of evolving transcriptional spatial profiling techniques available to researchers, it is important that one considers both the technical characteristics of the technology, including the spatial resolution, sensitivity, specificity, and tissue type, as well as practical considerations, such as the cost, compatibility with available resources, and turnaround time. Ultimately, researchers must carefully consider their research questions and select an appropriate technology that closely aligns with their research and clinical goals.


