

Dynamics of population and resources symmetries are investigated and a model of ecological interaction that fits with empirical behavior was obtained. It was observed how variables in these dynamics are in recurrence considering parameters such as time, frequency, iteration and interaction. Variables investigated are the consume, time and supply mechanics.
Time series analysis of these variables indicated a possible phase space formation of the phenomena. The main conclusion leads to a nonlinear dynamics of the ecological interactions of the organisms and resources symmetries.
- predator-prey
- population-resources dynamics
- time
- ecological interactions
- information theory
- nonlinearity
By Telles, Charles R. Secretary of State for Education of Paraná. Brazil.
It has been widely investigated how predator-prey and other ecological behaviors involving organisms are set to happen, develop and end. Those behaviors in this entry are reported to happen when considering only resources aspects and amount of population of a given organism, leading to a framework where any type of ecological behavior can be expressed considering a dynamics of an event through time, the amount of resources and population[1][2].
For this analysis, in figure 1, it was simulated a theoretical experiment where population and resource flow have increasing and constant values adding to the interaction of these two variables. As the time passes, this interaction is interrupted (represented by the first red line from the left to the right of the figure) and variables start to accumulate in space leading to a new property of an event, in which it was designed as a phase space starting point[3][4].
Figure 1: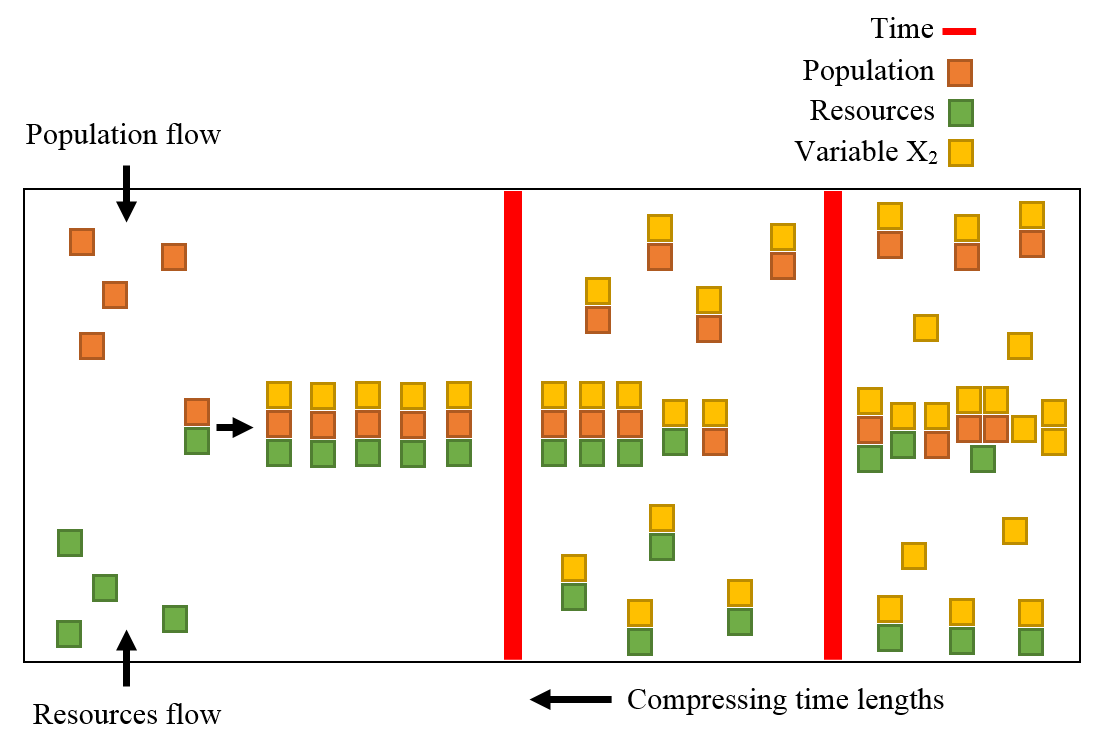
Figure 1: Scheme for resources and population dynamics regulated by time lengths. Possible results obtained through iteration, frequency and time over variables x1 and x2. It is theoretically postulated that time lengths have specific effects over the event, causing specific phase space trajectories. Variables analyzed: resource consume (x1) and the opposite time and space effect that none will consume it (x2).
After the first interruption is over (red vertical line), population and resources interaction start regroup again and at this exact point ecological behaviors are produced under previous regulated conditions. Those behaviors are visible in the second red vertical line where ecological interactions are promoted due to stress conditions in the proportion of resources and population. The behaviors expected are dependent on the organisms and resource characteristics such as physical, behavioral and specie related conditions. In the example of figure 1, it is considered only the population-resources ratio aspect without any specific biological interaction between organisms due to the simulation aspect of the experiment and no specific identity of organisms represented, but the same properties of figure 1 can be seen at bacteria experiments empirically[5][6][7].
The whole system of figure 1 can be represented by figure 2 where the event, as a phase space expression (not represented in this research), return to the initial condition, being represented by deterministic to the chaotic organization as it is observed in time series of the figure 3 and 4[8][9][10][11].
Figure 2:
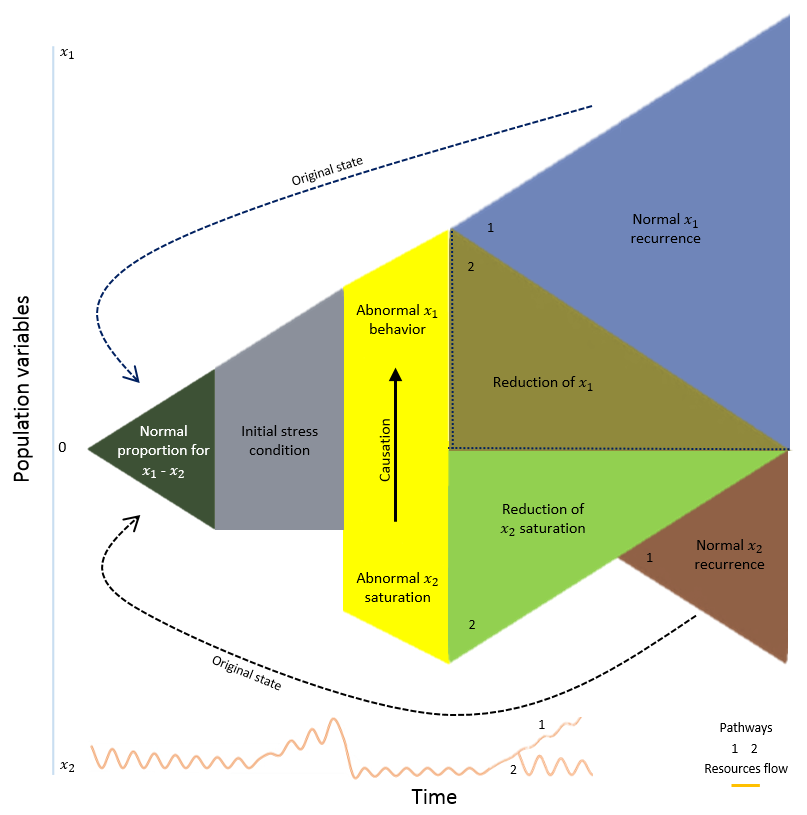
Figure 2: Evolution of system dynamics. Population and resource ratio are represented in two possible pathways. (1) Variables and resources recurrence to the original state. The amount of resource available at pathway 1 is proportional to the population previous aspects. In this case, resource amount is higher than the original state amount (2). Pathway 2 leads to the end of the event. It is expected for the resource time series at bottom of Figure 2, a constant reduction of information flow until it reaches 0 (zero for both variables interaction).
Initial condition of population-resource ratio can be viewed as a linear time serie expressing deterministic conditions and ideal parameters without any oscillation for time, population and resource variables. This situation is expressed at figure 2 at first green triangle only. After time variable start affecting experiment, other variables of system will be presenting specific oscillation trajectories as shown at figure 4.
Figure 3:
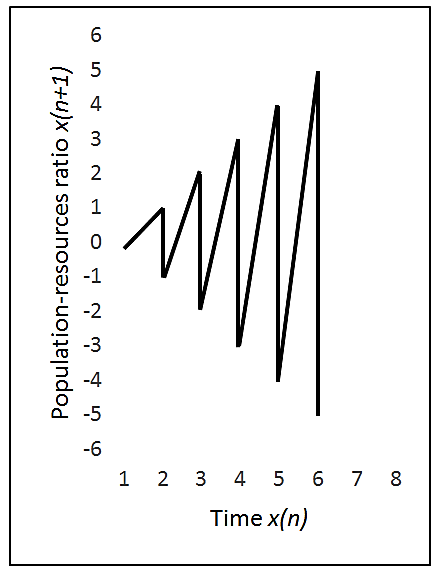
Figure 3: Time series of population variables x1 and x2 expressing proportionality for population-resource ratio.
Figure 4:
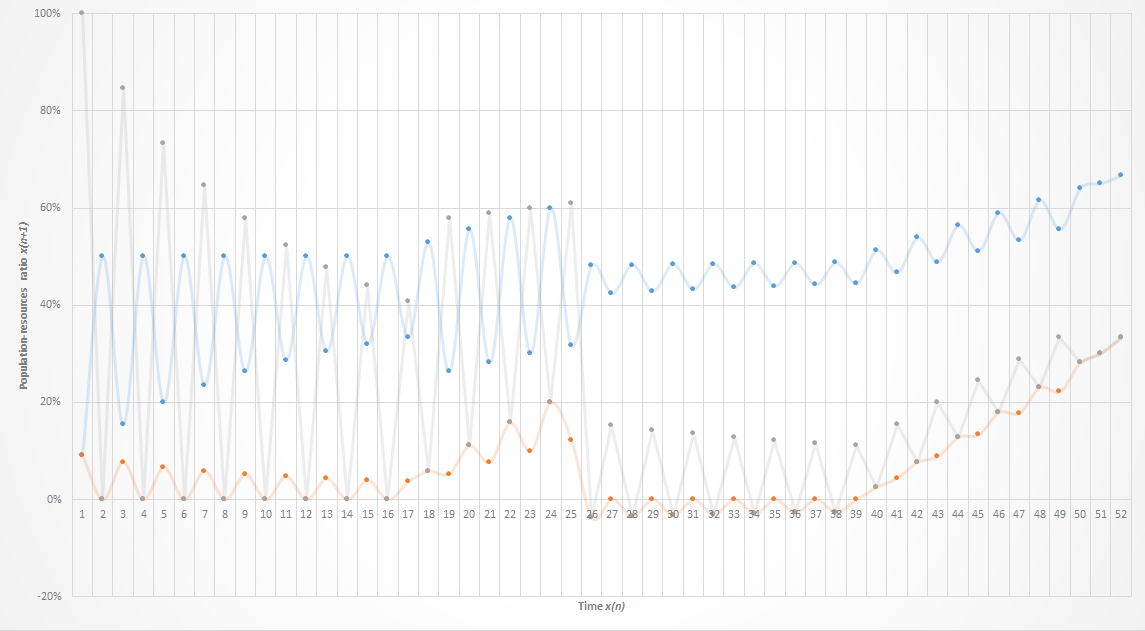
Figure 4: Time regulated dynamics of population-resource ratio. It is possible to observe the oscillations of variables in the system as time passes. Blue line, the variable x2, orange line, resources and light brown line, population.
One empirical example that is very similar to this article, but does not offer a mathematical and a theoretical model of the problem presented, is the experiment[5] where resources that are consumed by bacteria are regulated and it modifies aspects of bacteria competition, evolution and survival. When experiment makes resources a case of availability and flows, it acts as a time regulation of events, giving results that are expressed in this article[3] as found in “Nonlinearity from deterministic conditions” section. However, variable’s properties differ between considering human water consumption or bacteria resources interaction, but the results and the event as a whole have time regulated dynamics analogously. Result overview can be observed in discussion section[5] and by the theoretical framework obtained through time regulation method, it is possible to anticipate future discoveries that could be derived from the experiment with bacteria[5] or with other investigations. It means iteration (number of organisms and variables expression), frequency (of iteration), and time, are capable of disrupting any results obtained regarding survivability, evolution and competition of a life form. This statement is a suggestion for researchers of this field. Another study very related to the approach that is presented in this article is about nutrition and scarlet fever mortality correlation in the 19th century[6], where it was observed wheat prices oscillations causing consequent mortality oscillations in the same ratio. According to information sequences that are regulated by time lengths[3], the correlation between variables can be predicted by investigating the maximum oscillation output[2]. Possible other variables of biological origin will count towards the results making oscillation output be wider than expected.
Conclusion:
The article's scope of investigation brings an example related to ecological interactions and give a glance of how time is related to phenomena where diverse variables that are located in a chain of events, in which, probabilistic functions can assume an evolution of density and retrocede in its own properties regulated by time lengths. These densities evolutions promote together with other variables, increasing margins of possible outcomes in a complex chain of events, giving the whole view of deterministic to chaotic control of events in duality transformations for each pathway of the event. In this way, it is possible to regulate through time the frequencies in which iterations assume the main role of possible oscillations in the event, thus reducing the non-ergodicity of the system as a whole. This statement was performed in theoretical view, using population-resources ratio and parameters such as interaction, iteration, frequency of iteration, and time regulations.
Article link: https://www.mdpi.com/2073-8994/10/11/645
References
- Lev R. Ginzburg; Roger Arditi; Coupling in predator-prey dynamics: Ratio-Dependence. Journal of Theoretical Biology 1989, 139, 311-326, 10.1016/s0022-5193(89)80211-5.
- Uzi Harush; Baruch Barzel; Dynamic patterns of information flow in complex networks. Nature Communications 2017, 8, 2181, 10.1038/s41467-017-01916-3.
- Charles Roberto Telles; Geometrical Information Flow Regulated by Time Lengths: An Initial Approach. Symmetry 2018, 10, 645, 10.3390/sym10110645.
- Mézard, M.; Montanari, A.. Information, Physics and Computation; Oxford University Press: Corby, 2009; pp. 568.
- Minna Pekkonen; Tarmo Ketola; Jouni T. Laakso; Resource Availability and Competition Shape the Evolution of Survival and Growth Ability in a Bacterial Community. PLOS ONE 2013, 8, e76471, 10.1371/journal.pone.0076471.
- C. J. Duncan; S. R. Duncan; S. Scott; The dynamics of scarlet fever epidemics in England and Wales in the 19th century. Epidemiology and Infection 1996, 117, 493-499, 10.1017/s0950268800059161.
- Alexia Giannoula; Alba Gutiérrez-Sacristán; Alex Bravo; Ferran Sanz; Laura I. Furlong; Identifying temporal patterns in patient disease trajectories using dynamic time warping: A population-based study. Scientific Reports 2018, 8, 14, 10.1038/s41598-018-22578-1.
- Turkay Baran; Nilgun B. Harmancioglu; Cem Polat Cetinkaya; Filiz Barbaros; An Extension to the Revised Approach in the Assessment of Informational Entropy. Entropy 2017, 19, 634, 10.3390/e19120634.
- Mohamed Afy-Shararah; Nicholas Rich; Operations flow effectiveness: a systems approach to measuring flow performance. International Journal of Operations & Production Management 2018, 38, 2096-2123, 10.1108/ijopm-09-2016-0575.
- R. I. G. Hughes; Peter Gibbins; Particles and Paradoxes: The Limits of Quantum Logic.. The Philosophical Review 1990, 99, 646, 10.2307/2185625.
- Tsitsiklis, J. Bernoulli Process: Probabilistic Systems Analysis and Applied Probability, Lecture 13. . MIT Opencourseware. 2011. Retrieved 2019-1-8

