The recognition of fingerprint has played extremely important role in criminal investigations due to its uniqueness. This paper reports the recognition of sweat latent fingerprints by green-emitting, environment-friendly carbon dots prepared by DL-malic acid and ethylenediamine, and the exploration of impacting factors in the developing process of fingerprints. The experiments showed that better fingerprint images can be obtained when the latent fingerprints are developed in green-emitting carbon dots with pH 9 for 30 min at room temperature. The reported method is also effective for the latent fingerprints on a variety of substrates, as well as for those water-immersed ones, and the developed fingerprint stayed stable after long-term preservation. Furthermore, the fluorescence three-dimensional fingerprint image could provide a direct and simple evidence for the pressing habits. The objective of this paper is to present the method. The method may help to narrow the range of suspects during criminal investigations and forensic science.
- 绿色
- 碳点
- 汗潜指纹
- 法医学
- Introduction
The fingerprint of human being, influenced by heredity and environment, exhibits the property of uniqueness [1–3] and has already become important evidences in criminal investigation and convictions [2,4–6]. Generally, there are three common types of fingerprint evidence at crime scenes: impression (or indented) fingerprints, visible (or patent) fingerprints, and latent fingerprints [6]. In most cases, the latent fingerprint is the most common, invisible to naked eyes [1,5,6] and can further be classified into bloody fingerprints and sweat fingerprints according to the fingerprint residues. The bloody fingerprints, because of its easy and specific combination with chemical reagents thanks to the hemoglobin in the blood [7], are liable to be developed. The development of sweat fingerprints, however, still remains a problem.
The fluorescence methods [8,9] are one of the common methods for development of fingerprints, including quantum dots (QDs) immersing and developing method [10], DFO treatment [6], etc. As a fluorescence nanomaterial, QDs have attracted widespread interests from researchers. Some teams have already applied oil-soluble CdS QDs, CdS/PAMAM to the development of latent fingerprints on a variety of substrates based on cyanoacrylate fuming method, respectively [11,12]. However, because of its complicated operation and the released harmful cyanoacrylate ester during the process, greatly limits its practical application. The development of fingerprint based on the direct immersion of the substrates into QDs developing solution becomes an ideal substitute [10,13]. Researchers have already reported the acquisition of clear and detailed fingerprint images by immersing the substrates with latent fingerprints directly into water-soluble CdSe QDs [10] and CdTe QDs [14,15] solutions. Recently, Xu et al. [16] based on the N-L-Cys-capped Mn-doped ZnS QDs prepared by the modification of heavy metal-free Mn, realized the development of latent fingerprints on various objects. However, these methods still exhibit obvious shortcomings. Some of the developing solution contained Cd element, harmful to its users and environment, and some required complicated preparation process with strict synthesis environment and surface modifications. These problems greatly limit their applications into practical criminal investigations.
The carbon dots (CDs) have the advantages of easy preparation process and excellent biocompatibility [17–19], and have potential applications in latent fingerprint development [20,21]. They have already exhibit incomparable merits in latent fingerprint development: (1) the source of CDs is variable and environment friendly, making the preparation at low cost; (2) the CDs possess flexible plasticity in surface chemistry and biological properties. The required biometric features of fingerprints can be developed through the combination of the functional group on the surface of CDs and the fingerprint residues because of the covalently couple or electrostatic adsorption [22] by adjusting the environment of the solution. In 2018, Jiang et al. [20] reported the acquisition of white fluorescent fingerprint image by immersing the glass with latent fingerprint into lipophilic white luminescent CDs that were dissolved in organic solvents. The researchers reported the development of latent fingerprint by a spray method using a red luminescent CDs dissolved in 0.1 M hydrochloric acid [22]. Since solvents (organic solvents, 0.1 M pH 1 hydrochloric acid) are corrosive to most objects (such as plastics, leather), the method is harmful to the environment and its users. And white fluorescent images exhibit low fluorescence intensity, and vague outlines, greatly limiting its practical application. Wang et al. [23] synthesized an excitation wavelength-dependent CDs dominated by blue luminescent by using a spray and powder method to detect latent fingerprints on various objects, and obtained a blue fingerprint image. The fluorescence of CDs is mainly blue luminescent, which might be greatly limited by the excitation source; the powder easily destroys the integrity of the fingerprint. It has strong background interference. Therefore, there is still a need to develop an environmentally friendly, low cost and versatile fingerprint developing solution suitable for use at crime scenes, which ideally provides fingerprint images with high definition and contrast. The green CDs (G-CDs), due to its wide excitation spectrum, can be excited by selectively wavelength to distinguish the fluorescence of CDs from the background fluorescence, and thus enhance the contrast of the acquired images. G-CDs may have better results in fingerprint development.
This paper reports the development of latent sweat fingerprints with G-CDs as developing solution, which is prepared by DL-malic acid and ethylenediamine. The impact of pH values of G-CDs solution, as well as other experiment factors, including the substrates, the developing time and the placed different times of G-CDs developed, have been systematically investigated. This method provides a simple and environment friendly way for sweat fingerprint development, and has surely promising outlook in criminal investigation and forensic science.
- Experimental Section
2.1. Chemicals and Apparatus
DL-Malic acid (>99.0%) was obtained from Aladdin Chemistry Co., Ltd. (Shanghai, China); ethylenediamine (≥99.0%) was purchased from Sinopharm Chemical Reagent Co., Ltd. (Shanghai, China); tris-HCl buffer solutions with different pH values were prepared by dropwise added into a concentrated hydrochloric acid solution (0.1 mol·L−1) or tris solution (0.05 mol·L−1) to required pH values. All chemicals used were of analytical grade or of the highest purity available. CDs with precursors citric acid as carbon source and N-acetyl-l-cysteine as N and S dopant (B-CDs) has been synthesized [24]. Blue-emissioned CDs (P-B-CDs) has been synthesized from ethylene imine polymer and citric acid [25]. Yellow-emissioned CDs (Y-CDs) has been synthesized from o-phenylenediamine and N,N-dimethyl formamide [26]. Deionized water was prepared from a Milli-Q-RO4 water purification system (Millipore, Burlington, MA, USA).
UV-visible absorption spectra were acquired with a Lambda-35 UV/visible spectrophotometer (PerkinElmer Company) to determine the bandgap absorption of G-CDs. Fluorescence spectra were recorded on a LS55 spectrofluorometer (PerkinElmer Company, Waltham, MA, USA). Fourier transform infrared spectra were obtained on a Nicolet 6700 (FT-IR) spectrometer (Thermo Fisher Scientific, Waltham, MA, USA). The pH was monitored by a PHSJ-3F pH meter (Shanghai Precision Scientific Instrument Company, Shanghai, China). Images were obtained with a Gel Doc™ XR+ gel documentation system (Bio-Rad Laboratories, Inc., Hercules, CA, USA) or a Canon 5DII digital camera. Images of latent fingerprints were lit on a ZF-1 three-use UV analyzer (Shanghai Jinpeng Analytical Instruments Co., Ltd., Shanghai, China). XPS measurements were acquired with a VG Multilab 2000 X-ray photoelectron spectrometer (Thermo Electron Corporation, Waltham, MA, USA). A FELIX32 system was used to obtain the fluorescence intensity decay curves (Photon Technology International, Birmingham, NJ, USA). All optical measurements were performed at room temperature.
2.2. Synthesis of G-CDs
According to literature [27], G-CDs were synthesized and the synthesis steps of G-CDs were improved. DL-malic acid (1.0 g) and ethylenediamine (0.4 mL) were added to deionized water (30 mL) form a transparent solution. The solution was carried out under stirring 10 min in N2 atmosphere. Subsequently, the mixture was heated in a teflon-equipped stainless-steel autoclave at 200 °C for 8 h. After naturally cooling to room temperature, the solution (VG-CDs:Vacetonitrile = 1:2) was centrifuged at 4000 rpm for 15 min to remove the impurities. At last, the purified G-CDs solution was diluted five times with deionized water for further detection and use.
2.3. Application in Latent Fingerprint Development
This paper selected fingerprints of two volunteers for fingerprint detection. Different fingers were cleaned with soap and water, and were dried naturally. Then the fingers were gently rubbed across the forehead and stamped fingerprints with appropriate strength. The latent fingermarks were deposited onto different objects, such as the glass coverslips, sealed bags, transparent tapes and tin foil papers. Subsequently, latent fingermark objects were immersed in G-CDs solution, then rinsed with deionized water and dried naturally. The fingerprint was placed in a darkroom, and excited with 365 nm UV light. The images of the fingerprint were taken by a Canon 5DII digital camera or gel imager. Fingerprint development can be found elsewhere in detail [10,13].
- Results and Discussion
3.1. G-CDs Spectral Characterization and Application in Latent Fingerprint Development
3.1.1. UV-Vis Spectrum and Fluorescence Spectrum
The G-CDs were synthesized through the hydrothermal method from DL-malic acid with ethylenediamine. G-CDs exhibit one main UV-vis absorption peak at 327 nm (Figure 1). The fluorescence spectrum of the G-CDs and images of different light sources are shown in Figure 1. The excitation wavelength of prepared G-CDs is 460 nm, and the maximum emission wavelength is 520 nm. The fluorescence quantum yield was determined to be 19.6%, much higher than those reported in the literature [28]. The fluorescence decay curve for G-CDs is shown in Figure S1. The overall lifetime of G-CDs is 3.252 ns (λEx = 481 nm, λEm = 542 nm).
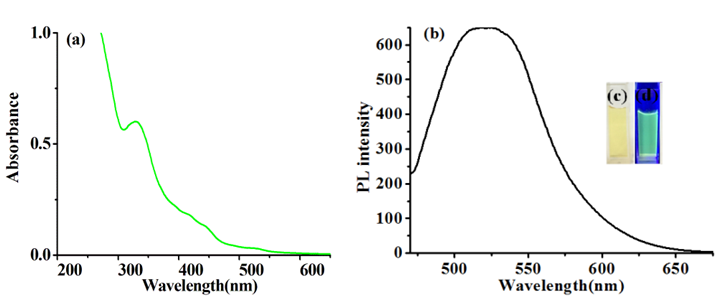
The UV-visible absorption, fluorescence spectrum of the G-CDs and images of different light sources are shown in Figure 1. G-CDs exhibit one main UV-vis absorption peak at 327 nm, and when the excitation wavelength increase from 360 nm to 460 nm, the maximum emission peak red shifts from 450 nm to 520 nm, together with the decrease of fluorescence intensity (Figure S2). The excitation wavelength dependent property ensures wide range of detection light (from UV to blue light) in practical applications when G-CDs used as developing reagent in fingerprint development.
3.1.2. Fingerprints Developed by Various QDs
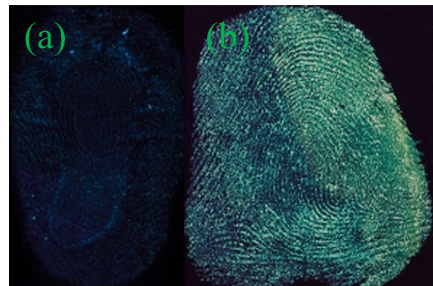
Since the CDs exhibit obvious merits in their practical applications, such as simple preparation process, good biocompatibility and optical stability, low toxicity, etc., most reported CDs are blue-emitting. The fingerprint images developed by B-CDs, P-B-CDs, Y-CDs and G-CDs (3.2 mg/mL) were compared.
As shown in Figure S3, the image developed by Y-CDs shows no outline of the fingerprint. The fingerprint image developed by P-B-CDs can show general outline, but the lines are vague. The image is low clarity and weak fluorescence intensity, almost without any practical value in fingerprint identification (Figure S3). As shown in Figure 2, the fingerprint developed by B-CDs possesses clear outline, smooth lines with weak fluorescence intensity and strong background interference. The maximum emission peak stays stable with sharp emission decrease when the excitation wavelength of B-CDs increase from 360 nm to 460 nm (Figure S2), showing that the change of excitation wavelength cannot alter the color of the fluorescence of B-CDs and also lead to weakened emission peak. The blue luminescence can be easily interfered by the background color of the substrates, and the acquired fingerprint image exhibit low resolution. The green luminescence of G-CDs could provide fingerprint images with satisfactory contrast from the background colors, clear and smooth fingerprint lines with sufficient details. The wide range of excitation wavelength can ensure the active avoidance from the background colors to reduce the background interference. The G-CDs is thus chosen as the developing reagent for further studies.
3.2. The Optimization of Fingerprint Development in G-CDs Solution
3.2.1. Fingerprints on Various Substrates
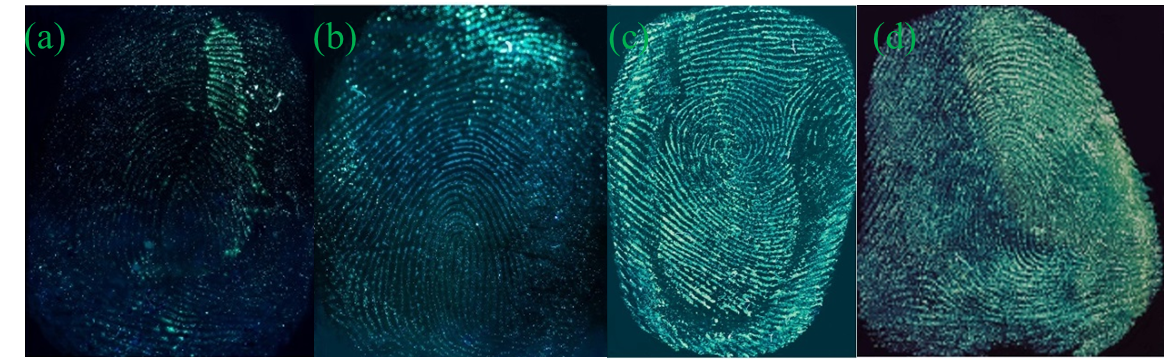
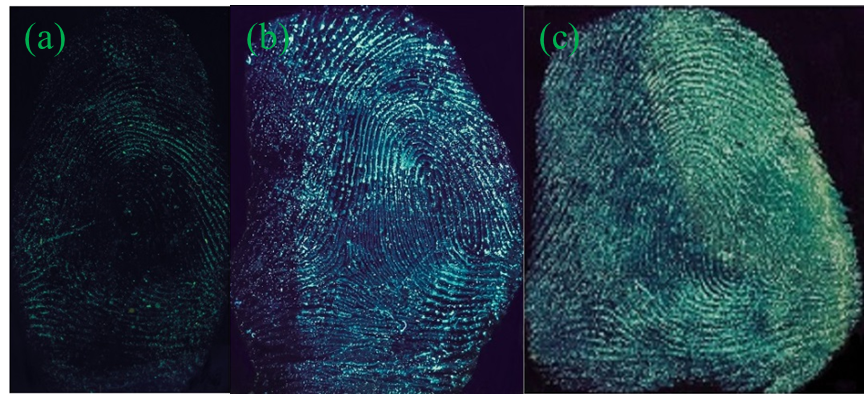
To assess the fingerprint acquisition ability of G-CDs on a variety of object surfaces, four substrates, say, the sealed bags, glass coverslips, transparent tapes and tin foil papers, have been selected in the fingerprint developing operations.
Figure 3 presents the acquired images of latent fingerprints on these four object surfaces developed by G-CDs solutions. The transparent tapes and tin foil papers present excellent latent fingerprint images with oblivious and coherent papillary ridges and depressed furrows lines, strong contrast against the background color distraction and clear details. A wealth of authentication information for fingerprinting can be provided. Fingerprint on the surface of coverslip shows better effects, but with relatively weak fluorescence intensity and fragility to external friction. The acquired latent fingerprint image on the sealed bag can be identified and has obvious fingerprint profile, ridge lines is still readable, but with weaker fluorescence intensity. The smooth surface of coverslip and sealed bag maintains fewer residues of sweat fingerprints, leading to weak fluorescence intensity on the images. Because of the difference in the texture, color and light reflection, G-CDs exhibit slight fluorescence color difference on these substrates. As the fingerprint on the tin foil paper is not easy to be glued and rubbed off, the tin foil is used as the subtract for the following research.
3.2.2. Effect of pH
The fluorescence performance of G-CDs under different pH environments have been examined before the assessments of pH to their developing effect. The fluorescence of G-CDs stays stable when pH value ranges 2–12, and drops dramatically when pH surpasses 13, due to the instability of G-CDs in strong alkaline environment (Figure S4). The assessment of developing performance of G-CDs to latent fingerprints was thus set in moderate pH environments (pH values ranges from 2 to 12).
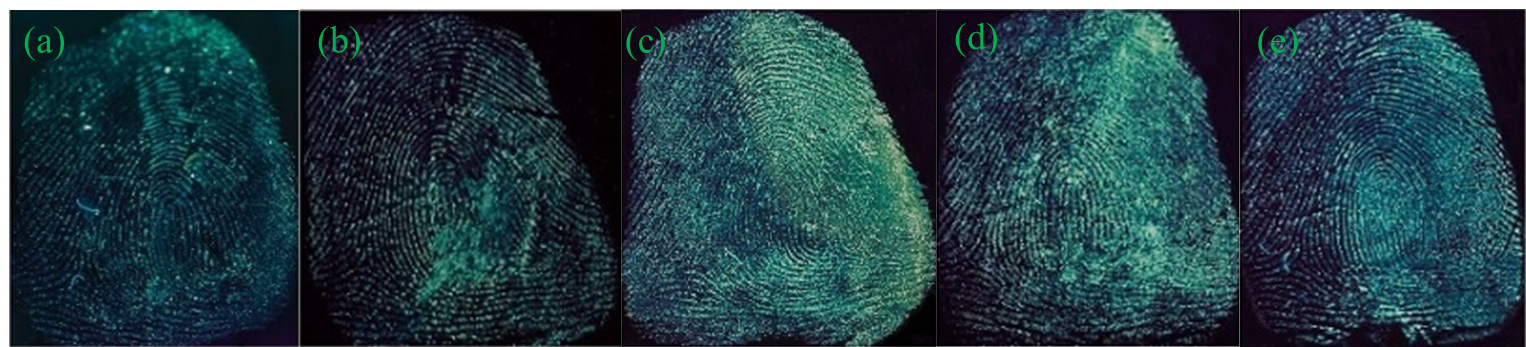
The latent fingerprints were developed according to the instructions stated in Section 2.3. When the tin foil papers were immersed in G-CDs solutions with different pH values (pH = 6, 8, 9, 10 and 12), and the acquired fingerprint images are listed in Figure 4. The brightness of acquired images increases with the enhancement of pH value. Further increase of pH (>10) would lead to decrease of florescence intensity, but the acquired images are still with clear ridges and apparent details. That is the result of hydrolysis of fingerprint residue in acid or strong alkaline environments (pH = 6, 12) [10,13,29]. When pH reaches 9–10, the acquired fingerprints exhibited strong fluorescence intensities, clear and coherent lines with uniform thickness, fine and smooth fingerprint profile and strong contrast from the background color distractions. The image reaches the best when pH set at 9. The carboxyl groups on the surface of G-CDs are negatively charged in alkaline solution [13], effectively preventing QDs from aggregation.
3.2.3. The Impacts of Developing Time
The impact of developing time, that is, the time of substrates immersing in the G-CDs solution, was then investigated, with the latent fingerprints on the tin foil paper as the sample. Figure 5 presents the acquired fingerprint images after the tin foil paper immersing in the G-CDs solution for 5, 10, 30 min under room temperature.
The fingerprint image acquired in our study presents clear and coherent ridges, detailed minutiae features and strong contrasts after 15 min developing time. The prolonged developing time ensures better fingerprint images and strong fluorescence intensities. When the developing time reaches 30 min, it gets the best effect. Considering the timeliness of fingerprint required by practical criminal investigation, 30 min is the optimal developing time.
3.3. Application of Actual Samples
3.3.1. Fingermarks Developed by G-CDs of Preserving Time
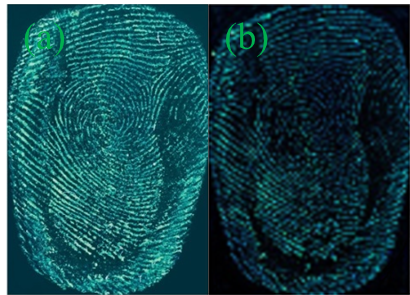
Forensic scientists always expect that the fingerprints developed by diverse techniques are able to maintain a good image after a long preservation time [29], the ability of evidence preservation is thus considered as an important evaluating indicator to fingerprint developing method. Transparent tape, as one of the most commonly used substrate for criminals, is chosen as the substrate for research.
Figure 6 presents the fingerprint images on the transparent tape developed by G-CDs solution after 60 days preservation. The fluorescence of fingerprint is slightly weakened, but is still clear with detailed minutiae features and strong contrast against the background distractions, proving its effective ability in long-term preservation of evidence and practical meaning in their application in criminal investigations.
3.3.2. The Development of Water-Soaked Latent Fingerprint
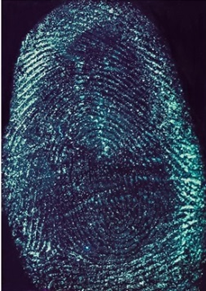
Latent fingerprints may be found on items which have been accidentally or deliberately wetted in the crime scene [30]. This type of evidence is hardly visible, and is one of the difficulties in fingerprint developing technology. The effective development of water-soaked latent fingerprint is thus the hot spot in this field. The water-soaked objects are generally high-density ones, such as knife and ax, so tin foil paper as an object was used for research. The latent fingerprint on the tin foil paper was soaked in water for four days, and then developed by G-CDs solution according to the standard operation.
Figure 7 presents the acquired image of water-soaked latent fingerprint. It can be seen that the fingerprint image is still clear in general profile with coherence in part of the papillary ridges, strong contrasts and enough minutiae features, but some of lines are indistinct as the result of the slow solution and diffusion of fingerprint materials on papillary ridges of fingerprints. Some of the papillary ridges and depressed furrows exhibit adhesion, but do not set critical impact upon fingerprint identification.
3.3.3. Three-Dimensional Image of Fingerprint by Developed in the G-CDs Solution
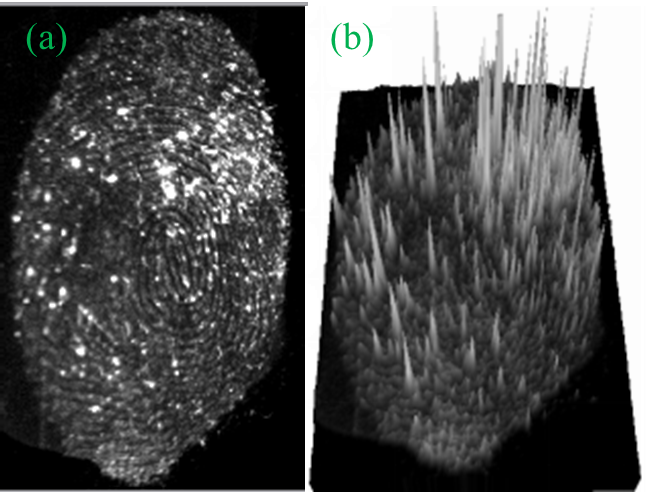
The possibility of three-dimensional analysis of latent fingerprint was then assessed. Figure 8 shows the developed latent fingerprint images on the transparent tape.
The experiments show that only the appropriate press on the substrate could produce the fingerprint with clear and coherent fingerprint details. Heavy press produces cohesion of lines and light press leaves limited fingerprint residue on the surface of the substrate, resulting in weak fluorescence intensity. Therefore, the fluorescence intensity of acquired three-dimensional image, together with the visual minutiae features would be used to infer the customary press habit of the fingerprint owner, helpful for the narrowing down the range of suspects during criminal investigations.
3.4. Mechanism of Latent Fingerprints Development by G-CDs
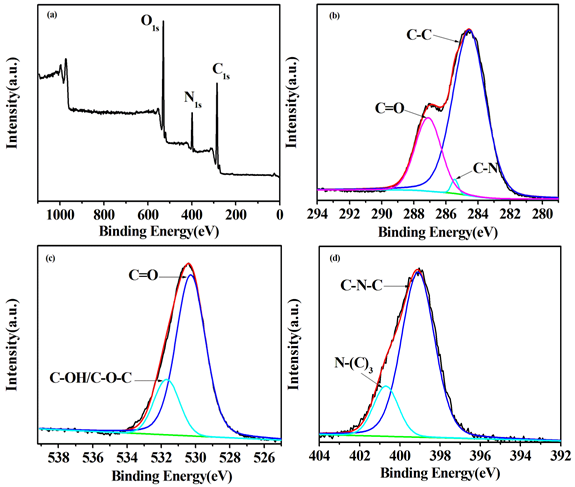
FTIR spectrum, XPS spectra were used to explore the mechanism of fingerprint development. As shown in Figure S5, the surface of G-CDs is rich in carbonyl, hydroxyl and amino groups, according to the characteristic absorption peaks of some functional groups. The elemental analysis and surface composition for the resultant G-CDs were characterized by the XPS technique (Figure 9). Results show that the as-prepared G-CDs contains C, N and O three elements, at relative percentage composition 62.23%, 13% and 24.77%, respectively, indicating the presence of carbon as the major component along with other minor components like nitrogen and oxygen. The three peaks at about 284.6, 399.1, 530.4 eV shown in the XPS full scan spectrum (Figure 9a) can be attributed to C1s, N1s and O1s, respectively. The C1S spectrum (Figure 9b) can be deconvoluted into three peaks with at 284.6, 285.4 and 287.1 eV, corresponding to C-C, C-N and C=O, respectively. The deconvoluted O1s spectrum (Figure 9c) shows two speaks at about 530.3 and 531.7 eV, corresponding to C=O and C-OH/C-O-C bands, respectively. The deconvoluted N1s spectrum (Figure 9d) exhibits a peak at 399.1 eV corresponding to C-N-C and a peak at 400.7 eV corresponding to N-(C)3 groups. All results from the FTIR spectrum and XPS studies confirm that the surface of the as-prepared G-CDs contains abundant carbonyl, hydroxyl and amino groups. The fingerprint residue is made up of inorganic components (sodium chloride, water) and organic components (skin oil, amino acid, fatty acid, etc.). The carbonyl, hydroxyl and amino groups on the surface of G-CDs would combine with the skin oil, amino acid and fatty acid through electrostatic adhesion and chemical coupling effect, making G-CDs selectively deposit on the fingerprint lines and forming the fluorescence fingerprint images under ultraviolet light.
- Conclusions
This paper reports the realization of development of latent fingerprint with green-emitting G-CDs as the developing reagent, which is one-step prepared by DL-malic acid and ethylenediamine. The experiments show that the acquired fluorescence fingerprint images possess clear and coherent ridges, enough minutiae features and strong fluorescence intensity. The impacts of a variety of experiment factors, including the pH values and the developing time, have been systematically investigated. The results show that fingerprints are immersed in the G-CDs solution with pH 9 for 30 min at room temperature to obtain good effects. The reported latent fingerprint developing method can effectively develop the latent fingerprints on a variety of substrates, and also solve the problem of the development of water-immersed latent fingerprints. The developed fingerprint stays stable for long-term preservation. Further fluorescence three-dimensional fingerprint image could provide direct and simple evidence for the habit of pressing. The method helps to narrow the range of suspects during criminal investigations and forensic science.
Supplementary Materials: The following are available online at www.mdpi.com/xxx/s1, Figure S1: Fluorescence decay curve of G-CDs; Figure S2: Fluorescence spectra of G-CDs and B-CDs at different excitation wavelengths. (a) G-CDs; (b) B-CDs; Figure S3: Diagrams of fingermarks on the tin foil paper after developed by various QDs. (a) P-B-CDs; (b) Y-CDs; Figure S4: Fluorescence properties by G-CDs of various pH values; Figure S5: FTIR spectrum of the G-CDs.
Author Contributions: D.Z. was in charge of the ideals and gave the support for the whole work; W.M. prepared the samples and carried out most of experiments; W.M. helped for the analysis and preparation of manuscript; X.X. contacted and prepared manuscript for publication.
Funding: This research was supported by Natural Science Foundation of Hubei Province (2016CFB615), and the Fundamental Research Funds for the “Central Universities”, South Central University for Nationalities (CZY15020, CZW15017). Fingerprints used in this project were from the students of South-Central University for Nationalities and informed consent was obtained from every participant of this project.
Conflicts of Interest: There are no conflicts of interest.
References
- Li, F.; Liu, S.Q.; Qi, R.Y.; Li, H.R.; Cui, T.F. Effective visualization of latent fingerprints with red fluorescent La2 (MoO4) 3: Eu3+ J. Alloys Compd. 2017, 727, 919-924.
- Ambadiyil, ; Prakash, D.; Sheeja, M.K.; Mahadevan Pillai, V.P. Secure storage and analysis of fingerprints for criminal investigation using holographic techniques. Mater Today Proc 2017, 4, 4389-4395.
- Li, Y.Q.; Xu, C.Y.; Shu, C.; Hou, X.D.; Wu, P. Simultaneous extraction of level 2 and level 3 characteristics from latent fingerprints imaged with quantum dots for improved fingerprint analysis. Chem. Lett. 2017, 28, 1961-1964.
- Milasinovic, N. Polymers in criminalistics: Latent fingerprint detection and enhancement: From idea to practical application. Nauka, bezbednost, policija 2016, 21, 133-148.
- Bailey,MJ; Ismail,M。; Bleay,S。; Bright,N。; Levin Elad,M。; 科恩,Y。; Geller,B。; Everson,D。; Costa,C。; Webb,RP; Watts,JF; de Puit,M。使用质谱成像增强了显影指纹的成像。分析师 2013,138,6246。
- 王,M。; 李,M。; Yu,A。; 朱,Y。杨,我的; Mao,CB荧光纳米材料,用于法医科学中潜在指纹的开发。本功能。母校。 2017年,27,1606243。
- Petretei,D。; Angyal,M。从皮肤上恢复血腥的指纹。J For Ident。 2015年,65,813-827。
- 宋,ZP; 李,ZH 林,LH; 张,YF; 林,TR; 陈,L。; 蔡,Z。; 林,S。; 郭,LQ; 傅,FF; Wang,XC Phenyl掺杂石墨氮化碳:光致发光机理和潜指纹成像。纳米级 2017年,9,17737-17742。
- Li,F。; 李,人力资源; Cui,TF一步法合成固态发光碳基二氧化硅纳米复合物,用于潜在指纹成像。Optmat 2017年,73,459-465。
- 王,YF; 杨,RQ; 施,ZX; 刘,JJ; 赵,K。Wang,YJ CdSe纳米粒子悬浮液对潜在指纹形成的有效性。沙特化学。SOC。 2014,18,13-18。
- Menzel,ER; 萨沃伊,SM; Ulvick,SJ; 程,KH; Murdock,RH; Sudduth,MR用于指纹检测的光致发光半导体纳米晶体。Forens。科学。 2000,45,545-551。
- Jin,YJ; 罗,YJ; 李,GP; 李,J。; 王,YF; 杨,RQ; Lu,WT光致发光CdS / PAMAM纳米复合材料在指纹检测中的应用。法医科学。诠释。 2008年,179,34-38。
- 王,YF; 杨,RQ; 王,YJ; 施,ZX; Liu,JJ应用CdSe纳米粒子悬浮液在粘合剂的粘性面上形成潜在的指纹。法医科学。诠释。 2009年,185,96-99。
- 刘,JJ; 施,ZX; Yu,YC; 杨,RQ; Zuo,SL水溶性多色荧光CdTe量子点:指纹图谱的合成与应用。胶体界面科学。 2010,342,278-282。
- Gao,F。; Han,JX; 张,J。; 李,Q。Sun,XF; 郑,JC; 宝,LR; 李,X。Liu,ZL新修改的CdTe量子点的合成及其在改进潜指纹检测中的应用。纳米技术 2011,22,075705。
- 徐,CY; 周,RH; 他,WW; 吴,L。; 吴,P。; Hou,XD使用无毒Mn掺杂ZnS量子点快速成像外分泌潜指纹。化学。 2014,86,3279-3283。
- 施,YL; 魏,S。高,ZQ碳量子点及其应用。SOC。牧师 2015年,44,362-381。
- 丁,; Yu,SB; 魏,JS; Xiong,HM全彩色发光碳点,具有表面状态控制的发光机制。ACS纳米 2015年,10,484-491。
- 赵,SJ; Lan,MH; 朱,XY; 薛,HT; Ng,TW; 孟,XM; 李,CS; 王,PF; 张,WJ绿色合成大蒜双功能荧光碳点用于细胞成像和清除自由基。ACS Appl。母校。接口 2015年,7,17054-17060。
- Jiang, B.P.; Yu, Y.X.; Guo, X.L.; Ding, Z.Y.; Zhou, B.; Liang, H.; Shen, X.C. White-emitting carbon dots with long alkyl-chain structure: effective inhibition of aggregation caused quenching effect for label-free imaging of latent fingerprint. Carbon 2018, 128, 12-20.
- Khan, W.U.; Wang, D.Y.; Zhang, W.; Tang, Z.B.; Ma, X.L.; Ding, X.; Du, S.S.; Wang, Y.H. High quantum yield green-emitting carbon dots for Fe (ІІІ) detection, biocompatible fluorescent ink and cellular imaging. Sci Rep 2017, 7, 14866.
- Chen, J.; Wei, J.S.; Zhang, P.; Niu, X.Q.; Zhao, W.; Zhu, Z.Y.; Ding H.; Xiong, H.M. Red-emissive carbon dots for fingerprints detection by spray method: coffee ring effect and unquenched fluorescence in drying process. ACS A Mater. Interfaces 2017, 9, 18429-18433.
- Wang, C.; Zhou, J.D.; Lu L.L.; Song, Q.J. Rapid visualization of latent fingerprints with color-tunable solid fluorescent carbon dots. Part. Syst. Charact. 2018, 35, 1700387.
- Gao, F.; Ma, S.Y.; Li, J.; Dai, K.; Xiao, X.C.; Zhao, D.; Gong, W.F. Rational design of high quality citric acid-derived carbon dots by selecting efficient chemical structure motifs. Carbon 2017, 112, 131-141.
- Li, J.Y.; Liu, Y.; Shu, Q.W.; Liang, J.M.; Zhang, F.; Chen, X.P.; Deng X.Y.; Swihart M.T.; Tan, K.J. One-pot hydrothermal synthesis of carbon dots with efficient up-and down-converted photoluminescence for the sensitive detection of morin in a dual-readout assay. Langmuir 2017, 33, 1043-1050.
- Lin, S.; Cheng, Y.Z.; Lin, C.; Fang, J.L.; Xiang, W.D.; Liang, X.J. Carbon nanodots with intense emission from green to red and their multifunctional applications. Alloys Compd. 2018, 742, 212-219.
- Pang, S.B.; Zhang, Y.; Wu, C.K.; Feng, S.L. Fluorescent carbon dots sensor for highly sensitive detection of guanine. Actuators B: Chem. 2016, 222, 857-863.
- 肖,DL; 袁,DH; 他,H。; 高,MM微波辅助离子液体一步法绿色合成荧光碳纳米粒子及其作为槲皮素测定新型荧光探针的应用。鲁闽。2013,140,120-125。
- 蔡,肯塔基; 杨,RQ; 王,YJ; 俞,XJ; Liu,JJ用水溶性CdTe量子点超快速检测潜指纹。法医科学。实习生。 2013,226,240-243。
- 罗哈吉,; Sodhi,GS; Kapoor,AK基于结晶紫染料的小颗粒试剂,用于在无孔湿表面上形成潜在指纹。埃及J法医科学。 2015年,5,162-165。

