Most food waste is incinerated and reclaimed in Korea. Due to the development of industry, soil and groundwater pollution are serious. The purpose of this study was to study recycled materials and eco-friendly remediation methods to prevent secondary pollution after remediation. In this study, recycled food waste ash was filled in a permeable reactive barrier (PRB) and used as a heavy metal adsorption material. In situ remediation electrokinetic techniques (EK) and acetic acid were used. Electrokinetic remediation is a technology that can remove various polluted soils and pollutants, and is an economical and highly useful remediation technique. Thereafter, the current density increased constantly over time, and it was confirmed that it increased after electrode exchange and then decreased. Based on this result, the acetic acid was constantly injected and it was reconfirmed through the water content after the end of the experiment. In the case of both heavy metals, the removal efficiency was good after 10 days of operation and 8 days after electrode exchange, but, in the case of lead, it was confirmed that experiments are needed by increasing the operation date before electrode exchange. It was confirmed that the copper removal rate was about 74% to 87%, and the lead removal rate was about 11% to 43%. After the end of the experiment, a low pH was confirmed at x/L = 0.9, and it was also confirmed that there was no precipitation of heavy metals and there was a smooth movement by the enhancer and electrolysis after electrode exchange.
1. Introduction
The advantages of the electrokinetic remediation technique can be summarized as follows
[1][44]: first, the electrokinetic remediation technique does not require complex equipment. Second, during electrokinetic remediation, workers or the general public are not exposed to pollutants. Third, electrokinetic remediation techniques can be used for soil, sludge, sediment, and groundwater. Fourth, it can be applied to metals, organic compounds, radionuclides, or complex pollutants. Fifth, it can be used in both in situ and ex situ remediation systems, and can be used in combination with other remediation technologies, such as bioremediation. Finally, compared to other thermal remediation techniques, low amounts of electrical energy are required and the overall cost is low. Costs range from $20 to $225 per cubic yard, depending on the site conditions.
In this study, to compensate for the disadvantages of the EK remediation method, recycled food waste ash was filled in PRB and used as an adsorbent. To prevent precipitation by hydroxide ions, the adsorbent was installed at 75% of the anode near the precipitation boundary, and heavy metals at the cathode were moved to the PRB through electrode exchange. To improve the movement of heavy metals, biodegradable acid was injected consistently using a Mariotte bottle. The contaminated ground typically is with contaminated with heavy metal copper and lead, and the remediation characteristics of copper and lead are identified to help the application of the remediation technique using recycled food waste ash.
2. Analysis on Results
2.1. pH Change
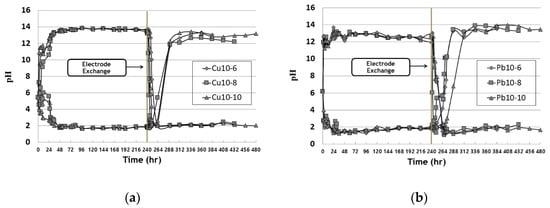
Figure 14 shows the pH change in the anode water tank during the EK remediation experiment for copper and lead. After the start of EK remediation, the electrolysis phenomenon resulted in pH changes at the anode and cathode. Two hours after remediation, the cathode showed a low pH at the hydrogen ion (H
+) and a high pH at the cathode (OH
−). After about 36 h, the anode tank tends to show a low pH between 2 and 3 and the cathode tank shows a high pH between 12 and 13. Due to the changed electrode after the electrode exchange, the pH of the tank changes and the low pH of the cathode (initial anode) increases and the high pH of the anode (initial cathode) decreases. It was confirmed that the pH of both copper and lead decreased within 24 h after electrode exchange, and that the pH increased after 2 days in the changed anode. It was confirmed that the effect of hydrogen at the anode, according to EK remediation, was faster.
Figure 14. pH change of water tank during EK experiments: (a) copper; (b) lead.
2.2. Current Density
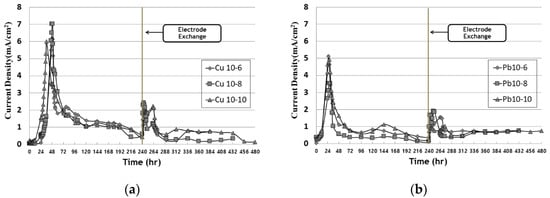
Figure 25 shows the change in current over time and the change in current density in EK remediation experiments, which vary the timing of the electrode exchange and the operation date after the exchange. The current density was calculated by dividing the total current passing through a cross section of the soil into the area of the test cell. The current density was expressed by dividing the measured current value by the soil sample (5 cm × 4.3 cm). The current density decreased after its peak between 30 and 50 h, showing very low values after running for about 100 h; similar results were obtained in other similar studies. Furthermore, the current density after the electrode exchange decreased after the conductivity decreased again in the anode. After electrode exchange, the current density increased and then decreased. A precipitate was formed by hydroxide ions at the point where the cathode was before the electrode exchange. However, the pH was lowered due to the electrode exchange and the influence of the improver and EK, so that the heavy metals were ionized and the reduced conductivity increased.
Figure 25. Current density during EK experiment: (a) copper; (b) lead.
2.3. Outflow
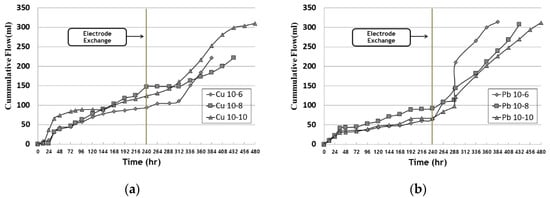
Figure 36 shows the cumulative outflow according to time. The amount of outflow tended to increase as the operation period grew longer, and the outflow volume increased after the electrode exchange. For this reason, the improver was injected at the beginning of the experiment and had a high water content, and the inlet part was converted into the outlet part through electrode exchange at the anode part. Therefore, it was determined that the electro-osmosis direction was reversed and the amount of effluent increased.
Figure 36. Cumulative outflow during EK experiment: (a) copper; (b) lead.
2.4. Water Content
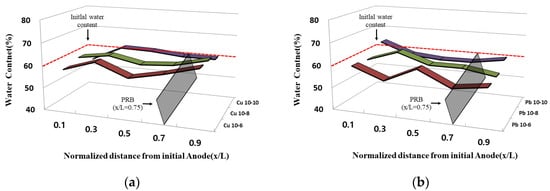
Figure 47 shows the water content in the sample after the experiment was completed. After the experiment was completed, the water content of each sample was measured for each of five ports. The water content due to electrode exchange did not differ significantly at the initial overall water content of 60%, and most of the initial anodes showed a water content slightly higher than the initial water content at x/L = 0.9. In addition, most of the initial anodes showed a tendency to be lower than the initial water content at x/L = 0.1. It is confirmed that the effect of electroosmosis is greater than the injection rate of the enhancer through the marriott bottle. This is the initial cathode through electrode exchange, and it is determined that the water content was slightly higher than the initial water content and was maintained because the improving agent was injected as the point at which the effluent exits become the anodes. Furthermore, the water content as a whole seemed to be maintained, similar to the initial water content, and it was determined that the sample did not settle during the EK remediation experiment and the movement of the improver was smooth.
Figure 47. Water content after the end of the EK experiment: (a) copper; (b) lead.
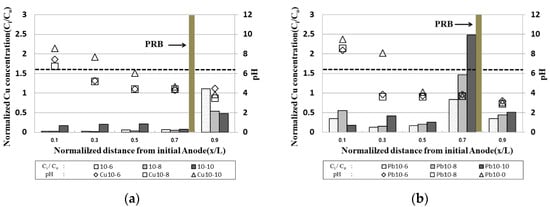
2.5. pH and Residue of Heavy Metals in Samples after the End of the EK Experiment
Figure 58 shows the residual copper/lead in the sample and the pH measurement results following the end of the experiment at the time of electrode exchange. The pH distribution in the sample was similar to the typical pH distribution in the EK experiments, which resulted in a condition in which heavy metals remaining in the soil could move to the cathode part to precipitate due to the lower pH at the anode part.
Figure 58. pH and residue of heavy metals in samples after the end of the EK experiment: (a) copper; (b) lead.
In the case of copper, the residual concentration at the x/L = 0.9 point in the initial anode was significantly reduced, and, in the case of Cu 10-10 operated for 10 days after electrode exchange, the residual concentration was significantly reduced to about 20% of the initial contamination concentration. However, it was confirmed that the residual concentration at the x/L = 0~0.7 point in the initial anode increased as the operation day increased. CFW filled with PRB was precipitated in excess of the maximum adsorption amount; it is considered that the heavy metal remaining in the PRB moved to the inside of the sample due to the electrode exchange.
In the case of lead, it showed a similar tendency to copper, and a high amount of heavy metal was confirmed at the point x/L = 0.7. This was confirmed to be higher than the initial pollution concentration due to the movement of heavy metals after 10 days of operation of copper and the electrode exchange. It was determined that the duration of EK should be longer than that for copper. In addition, the reason for the low pH in the sample near the anode in the initial stage was that the pH in the sample was lowered by the influence of hydrogen ions as the operation time before electrode exchange was prolonged. In the case of the initial cathode, it was confirmed that the pH increased and hydroxide ions after electrode exchange were easily lowered due to the injection of the improver. This is the effect of moving heavy metals from the anode to the cathode by electrophoresis and electro-osmosis during EK phenomena, and the effect of heavy metal remediation in the clay soil was confirmed
[2][3][4][5][49,50,51,52].
In the case of lead, it was confirmed that the residual amount of heavy metals was higher than that of copper in the sample, and the adsorption of lead was higher than that of copper in kaolinite
[6][53]. Due to the high adsorption, lead removal was also determined to be lower than that of copper. In addition, as a result of applying the EK remediation technique to soil contaminated with copper and lead, it can be confirmed that the remediation of lead is difficult
[7][8][9][10][11][12][13][34,35,54,55,56,57,58].
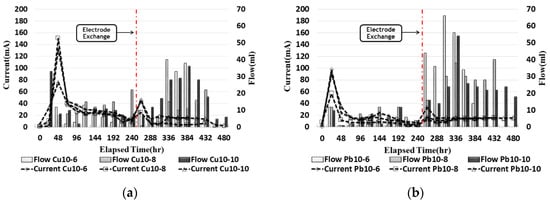
2.6. Current and Outflow
The outflow passing through the cathode water tank trough was measured every 24 h with a beaker.
Figure 69 compares the current and the outflow rates for ground contaminated with copper and lead. The current was similarly observed for copper and lead at the maximum current value, from 30 to 50 h, and showed a tendency to gradually decrease. After electrode exchange, it increased and then decreased again, and it was confirmed that the current value of copper was higher than that of lead. The outflow tended to increase and decrease as the current value increased, and, after the electrode exchange, the amount of outflow was confirmed to increase before the electrode exchange. It was confirmed that the amount of pore water at the x/L = 0~0.75-point increases after electrode exchange as electro-osmosis occurred. In the case of copper, it was confirmed that the high current value moved more than lead in the contaminated soil.
Figure 69. Current and outflow during the EK experiment: (a) copper; (b) lead.
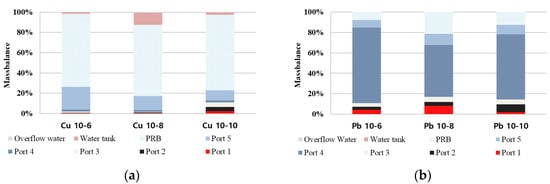
2.7. Mass Balance
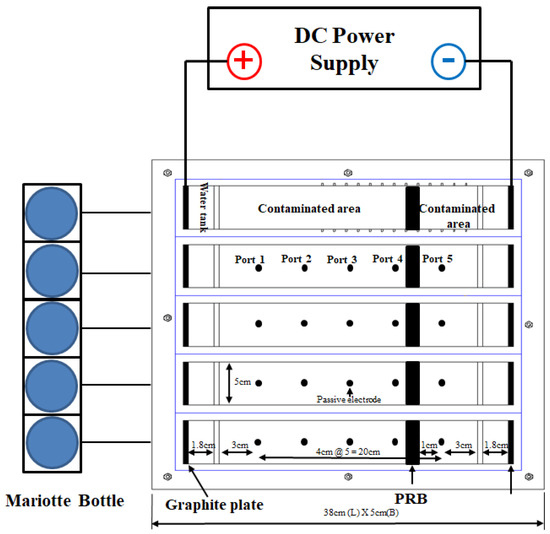
After the EK remediation experiment, the mass balance of heavy metal copper and lead was calculated, and the extraction of copper and lead contaminants adsorbed in the PRB was measured according to KSTM. The contaminated soil was sampled at five ports to measure the concentration of heavy metals, and the location of the ports could be determined as in
Figure 72.
Figure 810 and
Table 12 show the mass balance after the EK remediation experiment. Most of the heavy metals in the sample were removed in the case of copper, but most of the lead remained in the soil. Most of the copper was adsorbed to the PRB, and it was confirmed that the removal rate was about 74% to 87%. In the case of lead, the removal rate was 11%–43%, and it was confirmed that the EK remediation efficiency was lower than that of copper. The removal rate for copper and lead was the best for 8 days of electrode exchange after 10 days of operation, but it was determined that additional research is needed on the remediation period for heavy metal lead.
Figure 7. Schematic diagram and dimensions of the EK test device.
Figure 810. Mass balance: (a) copper; (b) lead.
Table 12. Mass balance and removal rates.
| Test |
Initial Amount of Pollutant
(mg) |
Residual in the Soil
(mg) |
PRB
(mg) |
Outflow
(mg) |
Water Tanks
(mg) |
Mass Balance
(%) |
Removal Rate
(%) |
| Cu 10-6 |
180 |
47.24 |
129.75 |
0.16 |
2.82 |
99.99 |
73.76 |
| Cu 10-8 |
180 |
24.33 |
99.11 |
0.80 |
16.95 |
78.44 |
86.80 |
| Cu 10-10 |
180 |
40.03 |
129.78 |
0.69 |
3.87 |
96.87 |
77.76 |
| Pb 10-6 |
360 |
293.05 |
27.17 |
0.04 |
0.03 |
96.22 |
18.59 |
| Pb 10-8 |
360 |
205.19 |
65.35 |
0.07 |
0.05 |
84.37 |
43.00 |
| Pb 10-10 |
360 |
319.22 |
51.65 |
0.35 |
0.03 |
113.8 |
11.33 |
Mass balance and removal rates.
3. CDiscurrent Insightsssion
In this study, pollutants were removed by applying PRB filled with food waste ash to ground contaminated with copper and lead, using EK remediation techniques. In order to solve the problems of existing EK remediation techniques. PRB, an improver and electrode exchange were applied, and an improved heavy metal removal method was proposed. The conclusions could be obtained through the experimental results of applying the improved EK remediation technique through a cell suitable for indoor experiments.
In the EK remediation technique for copper and lead removal, acetic acid was used to improve the movement of pollutants in the ground to improve remediation efficiency. The amount of outflow water increased both copper and lead due to the injection of samples and enhancers at the point before electrode exchange (x/L = 0~0.7), which is determined to have improved the movement of pollutants due to the smooth inflow of the enhancer. Furthermore, after the end of the experiment, the water content in the sample was maintained at the initial water content of 60%, and it is determined that the movement of the improver was smooth during the EK remediation experiment.