Please note this is a comparison between Version 1 by Eloisa Jantus-Lewintre and Version 3 by Dean Liu.
The immune checkpoint blockade (ICB), and concretely the blockade of the PD1/PDL1 axis, has opened up a new standard of treatment for non-small cell lung cancer (NSCLC).
- gut microbiota
- biomarker
- non-small cell lung cancer
- immune checkpoint blockade
- immunotherapy
- next-generation sequencing
1. Introduction
Lung cancer is one of the most lethal cancers worldwide [1][2][1,2]. Non-small cell lung cancer (NSCLC) constitutes approximately 85% of all lung cancers and includes adenocarcinoma, squamous cell carcinoma (SCC), and large cell carcinoma as the main histological subtypes [3][4][3,4]. The treatment of NSCLC has changed in recent years with the initial success of immunotherapy, especially that based on immune checkpoint blockade (ICB) with monoclonal antibodies against cytotoxic T lymphocyte-associated protein 4 (CTLA-4) or programmed cell death protein 1 (PD-1) and its ligand (PD-L1). The PD-1/PD-L1 axis has been demonstrated to influence the balance between tumor immune surveillance and immune resistance. In this sense, elevated PD-L1 expression on tumor cells results in T cell exhaustion, thereby attenuating tumor-specific immunity and promoting tumor progression [5]. Anti-PD-1 (nivolumab, pembrolizumab, cemiplimab) and anti-PD-L1 antibodies (atezolizumab, avelumab, durvalumab) are on the list of approved agents for different types of cancer, including NSCLC [6][7][8][6,7,8]. Clinical responses to treatment with ICB are usually durable, and the overall response rate in advanced NSCLC is around 15–30% [9][10][11][12][13][9,10,11,12,13]. However, despite substantial clinical advance, many patients do not benefit from these therapies and, therefore, identification of biomarkers to expand therapeutic efficacy of ICB is a priority. The expression of PD-L1 is currently the most extended and widely employed predictive biomarker for both PD-1 and PD-L1 blockade in NSCLC [14]. However, the use of this biomarker still presents unresolved issues, including temporal and spatial expression heterogeneity as well as variable quantitative scores and cutoffs within and across tumor types, which may exclude a considerable number of responders [15][16][15,16]. More recently, tumor mutational burden (TMB), defined as the number of non-synonymous mutations per coding area of tumor genome, has become a useful predictive marker for ICB effectiveness, regardless of PD-L1 expression, in different types of solid tumors, including NSCLC [17][18][17,18]. Nonetheless, some caveats, such as unclear thresholds for positive results along studies and tumor histologies, limited data providing significant correlation between higher TMB and improved overall survival, and the fact that not all patients with high TMB derive benefit from ICB, indicate that this biomarker alone is not the perfect predictor for immunotherapy [19]. Moreover, TMB determination by next-generation sequencing is often challenging because of the difficulty to obtain tumor tissue in many of the cases. In this sense, assessment of TMB in liquid biopsies and cytological specimens represent promising alternatives. Interestingly, it has been demonstrated that performing TMB evaluation on cytological samples with TMB values comparable to those obtained in histologically matched samples is technically feasible [20]. However, these findings need to be confirmed in large-scale studies and are still under investigation to accurately direct therapeutic decisions.
On the other hand, immune-related adverse events (irAEs) also remain an important therapeutic problem for immunotherapy usage. A systematic review of 5744 NSCLC patients treated with anti-PD-1/PD-L1 reports an overall adverse events incidence of 64% for anti-PD-1 and 66% for anti-PD-L1 agents [21]. IrAEs can involve any organ or system, and endocrine, dermatological, and gastrointestinal toxicities are the most common irAEs associated with anti-PD-1/PD-L1 in NSCLC patients [22]. Currently, predictive biomarkers for these irAEs to facilitate the use of ICB in the clinical setting are not available. Taking into consideration the evidence, identification of new reliable biomarkers to guide patient selection and provide indications of efficacy and/or toxicity for ICB therapies is of utmost importance.
Most recent research has been focused on the potential use of the gut microbiota as a biomarker for immunotherapy response. The human gut houses more than 1013 microorganisms [23], and the collection of these microorganisms is commonly termed gut microbiota. Abnormal composition of the gut microbiota has been proven to be related to many diseases, including inflammatory bowel disease and metabolic diseases [24][25][24,25]. Recently, there is an emerging idea of the systemic influence of the gut microbiota, and the “gut–lung” axis hypothesis supports the importance of a healthy gut microbiota to produce effective immune responses in the lung. Moreover, the impact of the microbiota on cancer and cancer treatment is an emerging area of great interest [26][27][26,27]. In the era of novel immune-modulating agents, differential composition of the gut microbiota has been studied as one of the variables accounting for interpatient heterogeneity in ICB responses [28][29][30][31][32][28,29,30,31,32]. Additionally, lung cancer patients are frequently treated with antibiotics (ATB) and this intervention could modify or unbalance the gut microbiota. In this regard, the impact of ATB on the clinical outcomes of patients treated with ICB should be a priority area of research [33][34][33,34].
Preclinical mouse models have highlighted that the therapeutic efficacy of immunotherapy is strongly dependent on the gut microbiota. In this scenario, Bacteroides fragilis has been confirmed to be related to higher anti-CTLA-4 treatment efficiency by regulating the function of dendritic cells and differentiation of T helper cells [35]. Bifidobacterium spp. and Akkermansia muciniphila have been associated with efficacy of anti-PD-1/PD-L1 treatment by increasing the function of dendritic cells, and enhancing activation and recruitment of CD4+ and CD8+ T cells into the tumor microenvironment [29][30][36][29,30,36]. A defined combination of 11 microbial strains has been associated with high colon interferon-γ (IFN-γ) production by CD8+ T cells and correlated with enhanced therapeutic efficacy of ICB in mouse tumor models [37]. Moreover, microbiota-derived end product metabolites from dietary fermentation, such as short-chain fatty acids (SCFAs), have been confirmed to influence the ICB clinical outcome by regulating the immune response [38][39][38,39]. In addition to the role in shaping systemic immune responses to ICB, the gut microbiota may also influence the emergence of irAEs, and its modification has been demonstrated to ameliorate certain adverse events, particularly colitis [28][40][41][28,40,41].
2. Gut Microbiota Composition and Response to ICB
To address a possible link between gut microbiota diversity and ICB clinical outcomes, we examined alpha-diversity indices in patients stratified according to ICB response. No significant differences were found in alpha-diversity between CB and PD patients, suggesting similarity in the compositional complexity of the gut microbiota among these two groups of patients (Figure S3). Moreover, to seek a possible impact of diversity on survival, we stratified patients into high versus low categories, based on the median of alpha-diversity indices. Again, no significant association of alpha-diversity with PFS and OS was found within the cohort, indicating a poor value of alpha-diversity as a prognostic factor (Figure S3).
To study whether differential composition and abundance within the gut microbiota could influence the patient clinical outcome to ICB, we analyzed the gut microbiota composition in CB and PD patients. To this aim, we compared the number of taxa between these two groups, observing that out of the 851 taxa obtained, 618 were shared among CB and PD patients (core microbiota), whereas 78 and 155 were exclusive to CB and PD groups, respectively (Figure 1a). However, these exclusive taxa were detected in a few patients and, therefore, the use of exclusive pools was avoided due to high individual variability. Accordingly, principal component analysis revealed no cluster formation in CB and PD patients, indicating that no specific cluster was associated with clinical outcome.4a). However, these exclusive taxa were detected in a few patients and, therefore, the use of exclusive pools was avoided due to high individual variability (Figure S4). Accordingly, principal component analysis revealed no cluster formation in CB and PD patients, indicating that no specific cluster was associated with clinical outcome (Figure S5).
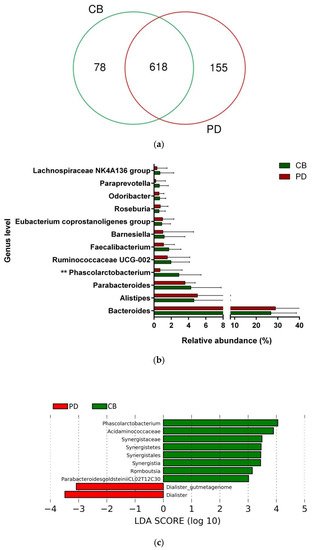
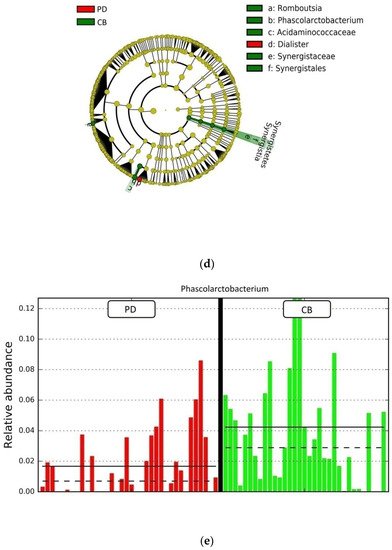
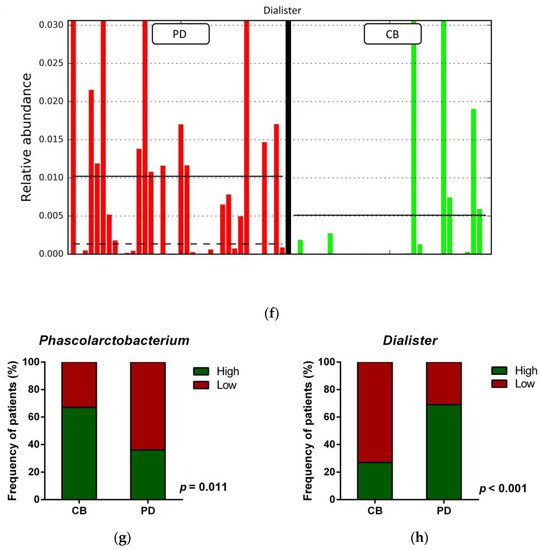
Figure 14. Compositional differences of the gut microbiota between CB and PD groups. (a) Venn diagram depicting shared and unique taxa for CB and PD groups; 618 taxa were identified as core microbiota (shared taxa). (b) Comparisons of the relative abundance at the genus level among CB (green) and PD (red) groups; ** p < 0.01. (c) Differential abundance analysis using linear discriminant analysis (LDA) effect size (LEfSe) in patients stratified according to response to ICB. (d) Taxonomic cladogram from the LEfSe analysis depicting differences in fecal taxa in CB and PD patients. Dot size is proportional to the abundance of the taxon. Green legends represent CB patients and red legends represent PD patients. (e) Differential abundance analysis using linear discriminant analysis (LDA) effect size (LEfSe) for the genera Phascolarctobacterium in PD and CB patients; the solid straight lines represent the plot subgroup relative abundance means; the dotted straight lines represent the plot subgroup relative abundance medians. (f) Differential abundance analysis using linear discriminant analysis (LDA) effect size (LEfSe) for the genus Dialister in PD and CB patients; the solid straight lines represent the plot subgroup relative abundance means; the dotted straight lines represent the plot subgroup relative abundance medians. (g) Frequency of patients with high versus low relative abundance of Phascolarctobacterium in their stool samples according to response to ICB (CB and PD groups). (h) Frequency of patients with high versus low relative abundance of Dialister in their fecal samples according to the response to ICB (CB and PD groups). The cutoff value is the median of relative abundance: 1.92% (Phascolarctobacterium), 0.01% (Dialister). CB: clinical benefit group; PD: progression disease group. LDA score > 3.0; p < 0.05.
Focused on the core microbiota, we next characterized and compared the differential abundances of the most frequent genera detected in CB and PD patients. Among the most frequent genera identified (Figure 1), Phascolarctobacterium was significantly enriched in CB patients (Figure 14b). LEfSe analysis was next used to find further imbalanced microorganisms between CB and PD patients (LDA score > 3.0 and p < 0.05). Results showed that Phascolarctobacterium (LDA > 4.0), Acidaminococcaceae, Synergistaceae, Synergistetes, Synergistales, Synergistia, Romboutsia, and Parabacteroidesgoldsteinii CL02T12C30 were enriched in CB patients, while Dialister and Dialister gutmetagenome were enriched in PD patients (Figure 14c–f). Among these bacteria, the Phascolarctobacterium and Dialister genera were found in at least 50% of patients. Interestingly, when stratifying patients into high versus low groups, based on the median relative abundance of these taxa, we found that high abundance of Phascolarctobacterium was detected in 67% (22/33) of patients experiencing clinical benefit, and 36% (13/36) of patients who progressed (p = 0.011, Figure 14g). Conversely, high abundance of Dialister was observed in 69% (25/36) of PD patients, but only in 27% (9/33) of CB patients (p < 0.001, Figure 14h). These results demonstrate the potential value of the genera Phascolarctobacterium and Dialister predicting response to ICB treatment.
3. Analysis of the Gut Microbiota as a Prognostic Marker
To further investigate the prognostic value of predictive bacteria, we performed survival analysis. Patients with high abundance of Phascolarctobacterium exhibited significantly prolonged PFS (median PFS 9.8 vs. 3.8 months, hazard ratio (HR): 0.531, 95% confidence interval (CI): 0.311–0.907, p = 0.018; Figure 25a), whereas non-significant differences in OS were observed in comparison to those with low relative abundance (median OS 19.9 vs. 11.4 months, HR: 0.642 (95% CI: 0.346–1.190), p = 0.155; Figure 25b). On the other hand, patients with high abundance of Dialister showed a significantly shortened PFS (median PFS 3.6 vs. 11.5 months, HR: 2.208 (95% CI: 1.286–3.791), p = 0.003; Figure 25c), and reduced OS compared to those with low abundance (median OS 9.3 vs. not reached months, HR: 2.847 (95% CI: 1.485–5.459), p = 0.001; Figure 25d).
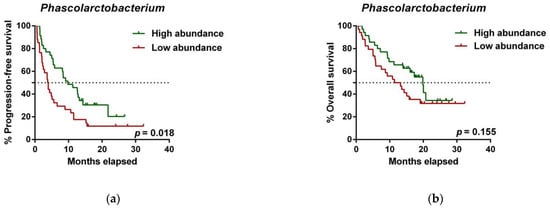
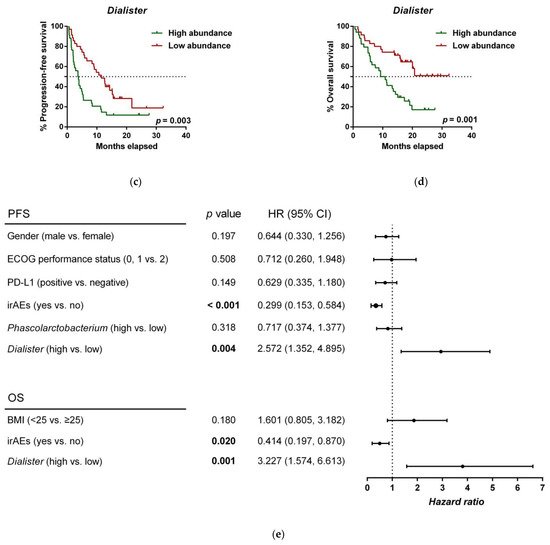
Figure 25. Dialister abundance and the presence of irAEs are independent prognostic factors for PFS and OS. (a) Kaplan–Meier plot of PFS in patients with high (green line, n = 35 (CB = 22, PD = 13), median PFS = 9.8 months) or low abundance of Phascolarctobacterium (red line, n = 34 (CB = 11, PD = 23), median PFS =3.8 months). (b) Kaplan–Meier plot of OS in patients with high (green line, n = 35 (CB = 22, PD = 13), median PFS = 19.9 months) or low abundance of Phascolarctobacterium (red line, n = 34 (CB = 11, PD = 23), median PFS = 11.4 months). (c) Kaplan–Meier plot of PFS in patients with high (green line, n = 34 (CB = 9, PD = 25), median PFS = 3.6 months) or low abundance of Dialister (red line, n = 35 (CB = 24, PD = 11), median PFS = 11.5 months). (d) Kaplan–Meier plot of OS in patients with high (green line, n = 34 (CB = 9, PD = 25), median PFS = 9.3 months) or low abundance of Dialister (red line, n = 35 (CB = 24, PD = 11), median PFS = not reached months). (e) Forest plot illustrating the results of multivariate analysis by the Cox proportional-hazard model. Statistical analysis was performed using the log-rank test. Bold p-values denote statistical significance at the p < 0.05 level. Cutoff values correspond to the median relative abundance: 1.92% (Phascolarctobacterium), 0.01% (Dialister). ECOG: Eastern cooperative oncology group; irAEs: immune-related adverse events; BMI: body mass index; PFS: progression-free survival; OS: overall survival; HR: hazard ratio; CI: confidence interval.
(References would be added automatically after the entry is online)

