Cadmium and Bladder Cancer: Comparison
Please note this is a comparison between Version 1 by Soisungwan Satarug and Version 2 by Catherine Yang.

Cadmium (Cd) is an environmental toxicant with serious public health consequences due to its persistence within arable soils, and the ease with which it enters food chains and then, accumulates in human tissues to induce a broad range of adverse health effects. Diet is a primary exposure source for non-smoking populations, whilst cigarette smoke is an additional source of Cd among those who smoked. Cd exists in cigarette smoke as a non-volatile oxide form (CdO), and a volatile metallic form with high transmission rates. Of further concern, the electronegativity of Cd is similar to that of zinc (Zn), a nutritionally essential metal, whereas its ionic radius is similar to calcium (Ca) Thus, Cd can enter the body from the gut and lungs through the metal transporter systems and pathways evolved for acquisition and storage of Zn, Ca, and other nutritionally essential metals such as iron (Fe) and manganese (Mn).

  • bladder cancer
  • cadmium
  • accquired cadmium tolerance
  • Zinc homeostasis
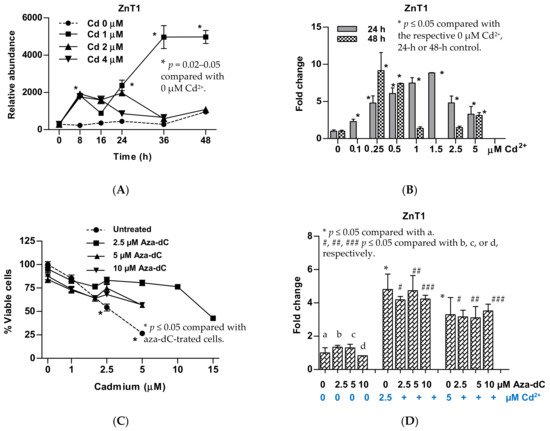
  • ZnT1 Zn(Cd) efflux transporter
  • ZIP8 Zn(Cd) influx transporter
  • ZIP14 Zn(Cd) influx transporter

1. Introduction

In the past, the majority of bladder cancer was associated with workplace exposure to aromatic amines, polycyclic hydrocarbons and heavy metals [1][2][63,64]. In recent times, workplace exposure accounted for 5–15% of bladder cancer cases in Europe with cigarette smoking arising as a predominant risk factor [3][69]. Blood Cd levels in cigarette smokers were higher than non-smokers by 2- to 6-fold [4][2]. In Italy, workplace exposure contributed to 4–10% of bladder cancer cases [5][70].
In a Spanish study of 1219 newly diagnosed bladder cancer cases and 1271 controls, cigarette smoking accounted for nearly all excess bladder cancer risk in men [3][69]. In a Belgian study of 172 bladder cancer cases and 395 non-cancer controls, the mean blood Cd in bladder cancer cases was 1.6-fold higher than the mean blood Cd in controls of 0.7 µg/L. The risk of bladder cancer was increased by 5.7-fold as blood Cd rose from the lowest tertile to the highest tertile [6][71] after adjustment for gender, age, smoking habits, and workplace exposure [6][71]. In a German study, the median urinary Cd in bladder cancer cases was 2.25-fold higher than controls of 0.8 µg/L [7][72].

2. Cadmium-Induced Cell Transformation: An In Vitro Carcinogenicity Test

The carcinogenicity of Cd has been tested in vitro using human cells, including RWPE-1 prostate epithelium [8][73], UROtsa urothelium [9][10][74,75], MCF-10A breast epithelium [11][12][13][76,77,78], BEAS bronchial epithelium [14][79], and HPDE pancreatic ductal epithelium [15][80]. It is notable that Cd concentrations used to induce cell transformation in vitro varied by 10-fold. Cd concentration, as high as 10 µM, was required to transform prostate epithelial cells [8][73], whereas 2.5 µM Cd was needed to cause malignant transformation of breast epithelium [11][76]. In contrast, urothelial, bronchial and pancreatic ductal epithelium became malignant cells after prolonged exposure to Cd as low as 1 µM [15][80]. These data suggest that variability among cell types in their capacities to tolerate Cd could be related to the levels of metal transporters involved in the influx and efflux of Cd. In addition, it could be related to expression levels of other stress response proteins that are induced by Cd such as MT and heme oxygenase-1 (HO-1) [16][17][39,40].
A 10-fold increase in the expression levels of the oncogenes, c-myc and c-jun, together with a change in DNA methylation state was observed in transformed TRL1215 rat liver epithelial cells [18][19][81,82]. Global DNA hypomethylation and overexpression of c-myc and Kras were observed in transformed MCF-10 cells [11][76]. In transformed RWPE-1 cells, the expression of the tumor suppressor genes (RASSF1A and p16) were diminished, but the DNA (cytosine-5-)-methyltransferase 3b (DNMT3b) gene was overexpressed, leading to a generalized DNA hypermethylation state [11][76]. Cd seemingly affected the expression of oncogenes through epigenetic mechanisms rather than oxidative stress-induced mechanisms [18][19][81,82].

3. UROtsa Cell Line as a Cell Model to Dissect the Carcinogenicity of Cadmium

Prolonged exposure to 1 µM Cd caused UROtsa cells to transform to cancer cells [6][71], and the tumors generated in nude mice from injected transformed UROtsa cells (a heterotransplant experiment) displayed gene expression profiles similar to the basal subtype of muscle invasive bladder cancer [7][72]. Microarray (the Affymetrix 133 Plus 2.0 chip) data indicated that at least 285 genes are upregulated and 215 genes are downregulated during Cd-induced cellular transformation [20][83]. The UROtsa cell line is non-tumorigenic, derived from the ureter epithelium of a 12-year-old female donor, immortalized with SV40 large T-antigen [21][84]. The UROtsa cells display the phenotypic and morphologic characteristics of primary transitional epithelial cells of the bladder [22][85].
Several lines of evidence have established the UROtsa cell line as a suitable cell model of urinary bladder epithelium. Expression of MT-1 and MT-2 isoforms in this cell line is induced by Cd [23][86]. These results have been replicated in a study using normal human urothelial (NHU) cells [24][50], in which the specific MT isoforms induced by Cd have been identified. However, expression of MT-3 in NHU was not detectable [24][50], although MT-3 isoform was expressed by parental UROtsa cells and transformed UROtsa cells [25][26][27][87,88,89]. Of interest, Cd-induced expression of the ZnT1 gene was observed in non-differentiated and differentiated NHU cells [24][50], and such ZnT1 induction by Cd has been replicated in UROtsa cells [28][51].

4. Zinc Transporters Expressed by Parental UROtsa Cells

In this section, data from three publications by Sens et al. [6][71] and Satarug et al. [29][28][30,51] recapitulate the evidence of a perturbation of cellular zinc homeostasis following low environmental exposure to Cd, producing blood Cd concentrations no greater than 1 µg/L. Published data showing the effects of Cd2+ on expression levels of 19 zinc transporters in UROtsa cells are reproduced (Table 1).
Table 1. Expression levels of zinc transporter genes in a cell culture model of human urothelial (UROtsa) cells at basal state and 24 h after exposure to 1, 2 and 4 µM cadmium.
Zinc Transporters Number of Transcripts in 1000 β-Actin
Batch I, 0 µM Cd2+ Batch II, 0 µM Cd2+ 1 µM Cd2+ 2 µM Cd2+ 4 µM Cd2+
SLC30A family          
ZnT1 181 ± 23 365 ± 38 3007 ± 465 1434 ± 146 1216 ± 153 ***
ZnT2 0.01 ± 0.001 0.06 ± 0.01 73 ± 15 16 ± 1.9 11 ± 1.5 ***
ZnT3 0.03 ± 0.007 0.15 ± 0.01 0.24 ± 0.05 0.10 ± 0.02 0.10 ± 0.02 *
ZnT4 1.6 ± 0.26 11.4 ± 0.8 10 ± 1 8.7 ± 1 6.2 ± 0.5 **
ZnT5 150 ± 19 510 ± 30 1038 ± 132 495 ± 54 568 ± 91 **
ZnT6 4.5 ± 0.15 65 ± 8 77 ± 6 63 ± 13 57 ± 12
ZnT7 734 ± 28 758 ± 76 1007 ± 136 706 ± 44 488 ± 63 *
ZnT10 0.04 ± 0.005 1.1 ± 0.2 2.4 ± 0.2 1.7 ± 0.2 1.1 ± 0.1 ***
SLC39A family          
ZIP1 19.5 ± 2.0 82 ± 9 99 ± 15 55 ± 10 59 ± 12 *
ZIP2 0.02 ± 0.004 1.2 ± 0.1 0.8 ± 0.2 0.4 ± 0.1 0.2 ± 0.03 ***
ZIP3A 9.1 ± 0.4 19 ± 1 23 ± 2.3 17 ± 1.7 14 ± 1.3 *
ZIP3B 0.48 ± 0.05 4.1 ± 0.2 6.2 ± 0.7 4.4 ± 0.2 4.2 ± 0.4 *
ZIP4 0.18 ± 0.04 0.06 ± 0.01 0.06 ± 0.01 0.04 ± 0.01 0.06 ± 0.01
ZIP5 0.01 ± 0.003 0.01 ± 0.001 0.01 ± 0.003 0.01 ± 0.002 0.01 ± 0.002
ZIP6 18.3 ± 2.6 92 ± 8 133 ± 12 80 ± 9 75 ± 10 **
ZIP7 121 ± 9.5 204 ± 25 342 ± 69 149 ± 32 94 ± 21 ***
ZIP8 0.09 ± 0.01 2.1 ± 0.2 2.6 ± 0.3 2.0 ± 0.2 2.7 ± 0.4
ZIP10 5 ± 0.3 54 ± 4 30 ± 8 14 ± 3 14 ± 3 ***
ZIP14 83.4 ± 10.5 146 ± 19 218 ± 24 158 ± 26 128 ± 19 *
Numbers are values for mean ± standard error of mean for the number of transcripts for each individual zinc transporter gene relative to 1000 transcripts of the β-actin gene. Expression levels of zinc transporters are as reported by Satarug et al. [29][28][30,51]. Kruskal–Wallis test was used to derive p-values and those ≤ 0.05 identified a statistically significant effect of Cd2+; * p = 0.01–0.05; ** p = 0.001; *** p = <0.001.
Expression levels of 19 zinc transporters in two batches of UROtsa cell cultures were qualitatively similar. The Golgi zinc transporter ZnT7 was expressed in the highest abundance: 734 and 758 transcripts per 1000 copies of β-actin gene transcripts in batch I and II, respectively. ZIP8, ZIP14, ZnT1 and ZnT5 genes expressed by batch I cells were 0.1, 83, 181, and 150 transcripts per 1000 copies of β-actin gene transcripts, and the corresponding ZIP8, ZIP14, ZnT1 and ZnT5 expressed by batch II cells were 2.1, 146, 365 and 510 copies per 1000 copies of β-actin gene, respectively. Based on the putative role of ZnT1 as the sole Cd efflux transporter, and ZIP8 and ZIP14 as Cd influx transporters, lower expression levels of ZIP8 than ZIP14 suggested that ZIP14 and ZnT1 could contribute to Cd accumulation by UROtsa cells. Despite low levels of transcripts, ZIP8 protein expression in UROtsa cells was detectable by Western blot analysis [30][90].

5. Upregulation of ZnT1 and Acquired Resistance to Cadmium

It is increasingly apparent that epigenetic changes, DNA methylation included, are especially frequent in urothelial carcinoma [31][91]. In this section, published data showing that Cd in low concentrations (0.01–1 µM) induced expression of ZnT1 in UROtsa cells are reproduced and discussed together with those showing Cd resistance acquired after treatment with an inhibitor of DNA methylation, 5-aza-2′-deoxycytidine (aza-dC), producing a DNA hypomethylation state [29][28][30,51].
Among three Cd concentrations tested, 1 µM Cd induced ZnT1 (Figure 1A). An increment of Cd2+ concentrations from 0.1 to 1.5 µM produced progressive increases in expression levels of ZnT1 (Figure 1B). The highest fold induction within 24 h was 8.8, achieved with 1.5 µM Cd concentration. Exposure to 0.25 µM Cd for 48 h induced ZnT1 expression to the same extent achieved with 24-h exposure to 1.5 µM Cd. Of note, 24-h exposure to 1 µM Cd resulted in a 7.5-fold increase in ZnT1 expression. However, ZnT1 fold induction declined from 7.5 at 24 h to 1.4 at 48 h, suggesting cytotoxicity of 1 µM Cd when exposure was continued for a further 24 h.
Figure 1. Change in expression of the ZnT1 gene in response to cadmium and inhibition of DNA methylation. (A) Expression levels of the ZnT1 gene as a function of exposure durations and Cd2+ concentrations; (B) expression levels of the ZnT1 gene 24 h and 48 h after exposure to various Cd2+ concentrations; (C) resistance to Cd toxicity in aza-dC-treated cells; (D) changes in ZnT1 expression in aza-dC-treated cells. Fold change or a ratio was defined as the number of transcripts of a given gene relative to β-actin in treated cells divided by number of transcripts of the same gene relative to β-actin control cells (0 µM Cd2+). ZnT1 expressions in (A,B) were from different batches of cells. The effect of 48-h exposure was not assessed for 0.1 and 1.5 µM Cd2+ concentrations (B).
UROtsa cells treated with aza-dC 24 h prior to Cd exposure exhibited tolerance to Cd toxicity (Figure 1C). The concentration of Cd causing 50% loss of cell viability was increased from 2.5 to 5 µM Cd. Treatment with aza-dC did not affect ZnT1 expression nor did the extent of Cd-induced ZnT1 expression (Figure 1D). Furthermore, the resistance to Cd toxicity was observed 96 h after aza-dCd treatment [32][48]. This may suggest the rate of Cd efflux may have exceeded or equaled to the rates of Cd influx. In theory, however, intracellular Cd-to-Zn ratio would be an important contributor to an efflux of Cd, given that ZnT1 mediates the efflux of both Zn and Cd [33][34][35][22,25,31].