Your browser does not fully support modern features. Please upgrade for a smoother experience.
Environmental Variable Classifier using Apache Spark Classifier: History
View Latest Version
Please note this is an old version of this entry, which may differ significantly from the current revision.
Contributor: , Christos Karras , Aristeidis Karras , , Spyros Sioutas

This work introduces an innovative Markov Chain Monte Carlo (MCMC) classifier that combines Bayesian machine learning with Apache Spark. The primary focus of this study is on the analysis of a large dataset of air pollutant concentrations in Madrid from 2001 to 2018, using Bayesian Logistic Regression to classify the Air Quality Index (AQI) as safe or hazardous.

The research demonstrates the model's capability to manage overfitting and enhance predictive accuracy in big data environments. It achieved a maximum accuracy of 87.91% and a remarkable recall value of 99.58% at a specific decision threshold. However, it slightly underperformed in comparison to the traditional Frequentist Logistic Regression in terms of accuracy and the AUC score.

This work highlights the effectiveness of Bayesian machine learning for managing large datasets and its applicability in environmental analysis. It underscores the importance of the MCMC Classifier and Apache Spark in handling high-dimensional data and their broader implications not only in statistics, mathematics, and physics but also in practical real-world applications.

The key points of the study are:

  • Objective: The study introduces the EVCA Classifier, a Markov Chain Monte Carlo (MCMC) based classifier, designed for analyzing high-dimensional big data. This classifier is integrated with Bayesian machine learning and Apache Spark.

  • Data Source: The classifier was applied to a large dataset of air pollutant concentrations in Madrid, collected from 2001 to 2018.

  • Methodology: Bayesian Logistic Regression was used to classify the Air Quality Index (AQI) as safe or hazardous. The research used MCMC techniques for posterior distribution sampling.

  • Results: The EVCA Classifier achieved a maximum accuracy of 87.91% and an impressive recall of 99.58% at a specific decision threshold, indicating high effectiveness in classifying AQI.

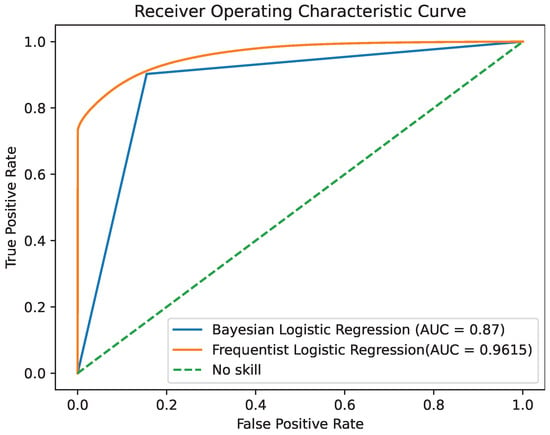
  • Comparison with Frequentist Approach: When compared with traditional Frequentist Logistic Regression, the Bayesian approach had slightly lower accuracy and AUC score.

  • Importance of Model Complexity: The study found that models with fewer features tended to perform better than those with more features, indicating that an equilibrium between the number of features and model complexity is crucial.

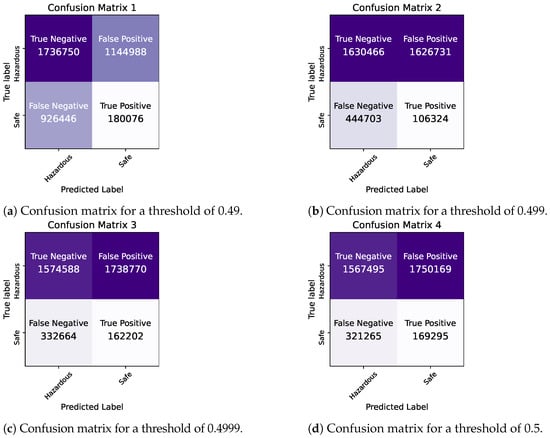
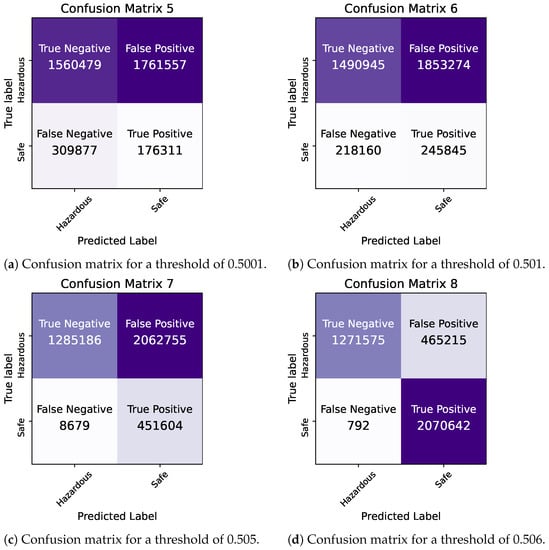
  • Impact of Decision Thresholds: The selection of appropriate decision thresholds was critical for balancing false positives and negatives, particularly important for classifying AQI correctly.

  • Performance in Apache Spark: The use of Apache Spark was instrumental in handling large datasets and demonstrated the scalability of the classifier.

  • Future Work: The study suggests potential future directions, including developing a multiclass Bayesian classification model, refining prior distributions, and expanding applications to other environmental datasets.

This study underscores the effectiveness of Bayesian machine learning in handling large datasets and its applicability in environmental analysis, emphasizing the role of MCMC classifiers and Apache Spark in managing high-dimensional data.

  • stochastic data engineering
  • Markov Chain Monte Carlo
  • big data management
  • large-scale data

1. Introduction

In the realm of global public health and climate action, the pervasive issue of air pollution looms large, as it poses significant threats to both human well-being and the environment. Understanding the origins, patterns, and consequences of air pollution relies heavily on the analysis of environmental data. By leveraging advanced analytical techniques, we can extract invaluable insights into pollution trends, pinpoint areas of concern, and devise effective strategies to mitigate its impact, thereby promoting sustainable environmental management. This analytical endeavor assumes that facilitating well-informed decision-making processes, policy formulation, and the protection of public health are of utmost importance [1,2].
One comprehensive solution involves the observation of the well-established AQI Categories, as outlined in Table 1, to accurately predict the air’s safety for the general population on an hourly basis. By utilizing these categories, we can provide the population with clear and easily understandable information regarding air quality, thereby effectively alerting them to potential safety concerns regarding their well-being. To delve into this subject matter, our methodology adopts a combination of Bayesian Logistic Regression and Markov Chain Monte Carlo (MCMC) sampling. By harnessing these sophisticated tools, we can predict and categorize the Air Quality Index (AQI) into two distinct classes, “safe” or “hazardous”, catering to the general population’s safety. This classification is primarily based on the concentrations of pollutants. If the AQI falls within the first three categories, it is deemed “safe” (classified as the negative class); otherwise, it is labeled “hazardous” (classified as the positive class). This classification is performed for each one of the 18 stations every hour and is primarily based on the hourly concentrations of pollutants.
Table 1. AQI Categories and Index Ranges.
Pollutant Good Fair Moderate Poor Very Poor Extremely
Poor
PM2.52.5 0–10 10–20 20–25 25–50 50–75 75–800
PM1010 0–20 20–40 40–50 50–100 100–150 150–1200
NO22 0–40 40–90 90–120 120–230 230–340 340–1000
O33 0–50 50–100 100–130 130–240 240–380 380–800
SO22 0–100 100–200 200–350 350–500 500–750 750–1250

2. Predictions in Apache Spark for Different Decision Thresholds

Having evaluated the model’s accuracy on small training and testing datasets, we now proceed to the retraining of the model on the 2017 pandas data frame. The goal is to make predictions on 18 years of unseen data using Pyspark for scalable big data management.
The evaluation metrics seen in Table 2 represent the performance of the classifier on the unknown data. During our experiment, we explored various decision threshold values for proba[1], as seen in Listing 3. This threshold determines the minimum probability at which the model classifies a case as positive.
For the evaluation, we use the following metrics: true positive (TP), true negative (TN), false positive (FP), and false negative (FN). It is worth noting that MCMC sampling is carried out using the following parameters: draw = 1000, tune = 1000, chains = 4, init=’advi’, n_init = 50,000, and the five feature set.
We observe that higher values of the threshold lead to a more conservative model that makes fewer false positive predictions but more false negatives (Table 2). At the lowest threshold, the model exhibits low precision, with a value of 0.4584, indicating a significant number of incidents being incorrectly classified as false positives (hazardous). As the threshold increases, both the accuracy and precision of the model improve. The maximum values of 0.8791 and 0.9932, respectively, are achieved for a decision threshold of 0.505. However, beyond this threshold, the model’s accuracy begins to decline again. These findings clearly demonstrate the substantial influence of the decision threshold on the classification model’s performance. Ultimately, the selection of an appropriate threshold depends on the specific requirements of each problem, such as the relative costs associated with false positives and false negatives [50].
Here, the objective is to classify the AQI as either “safe” (negative) or “hazardous” (positive) for the general population. This means that it is crucial to minimize false negatives, as misclassifying the air quality as “safe” could unknowingly subject the general population to harmful air pollution. Hence, our primary concern lies in the metric of recall/specificity, which quantifies the model’s ability to correctly identify safe air quality instances (or true negatives, TN).
Upon analyzing the results, we find that, for a decision threshold of 0.505, the recall/specificity metric reaches a value of 0.9958. This indicates that the model consistently and accurately predicts the safe air quality, as evidenced by the high number of true negatives (TN). For this reason, we consider the threshold of 0.505 to be the optimal choice. This decision is based not only on the superior overall model performance achieved at this threshold but also on the fact that selecting higher thresholds would lead to an increase in false negative predictions, which is undesirable in our context.

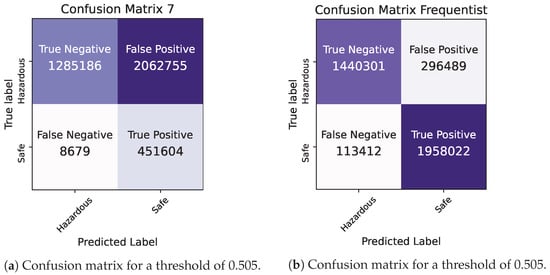
3. Bayesian vs. Frequentist Logistic Regression in Apache Spark

This research concludes with the examination, training, and testing of a Frequentist Logistic Regression model using the predefined algorithms in Pyspark’s MLlib library. The evaluation metrics of both models, trained and assessed on identical training and control sets, are presented in Table 3, using a consistent decision threshold of 0.505.
Table 3. Frequentist and Bayesian Logistic Regression evaluation metrics in Spark with five features and a decision threshold equal to 0.505.
Metrics Bayesian Logistic Regression Frequentist Logistic Regression
Accuracy 0.8791 0.8923
Precision 0.9932 0.9270
Recall/Specificity 0.9958 0.9452
ROC AUC 0.8678 0.9614
Time 35.3 s 35.3 s
Confusion Matrix [1285186,451604]
[8679, 2062755]
[1440301, 296489]
[113412, 1958022]
By comparing the two models, we observe that they demonstrate similar levels of accuracy and duration for the training and testing processes. The precision and ROC AUC metrics differ significantly for the two models, with the Bayesian model performing better in terms of precision and the Frequentist model having a higher ROC score, indicating its overall superior performance in terms of balancing the true positive rate against the false positive rate. The confusion matrices for each model for various thresholds are shown in Figure 1, Figure 2 and Figure 3 while the ROC curve, as well as the AUC score for each method, are shown in Figure 4.
Figure 1. Bayesian Logistic Regression in Pyspark: Confusion matrices for thresholds of 0.49–0.5.
Figure 2. Bayesian Logistic Regression in Pyspark: confusion matrices for thresholds of 0.5001–0.506.
Figure 3. Bayesian vs. Frequentist Logistic Regression in Pyspark: confusion matrices for a threshold of 0.505.
Figure 4. ROC area under the curve for the two models.
Given the significance of true negatives in this specific problem, the recall/specificity metric is assumed to be of utmost importance. Notably, the Bayesian model demonstrates a superior performance compared to its Frequentist counterpart when considering this specific metric, highlighting its effectiveness in accurately identifying true negatives. This is crucial for ensuring that the Air Quality Index (AQI) category is not mistakenly classified as “safe”, thereby preventing inadvertent exposure of the general population to harmful air. The examination of the confusion matrices supports the idea that the Bayesian model exhibits a greater number of true negatives compared to the Frequentist model, a crucial aspect for addressing the problem at hand.
As a final conclusion, the Bayesian model provides more up-to-date estimates by incorporating uncertainty, instilling a higher level of confidence in the data quality. Consequently, based on these observations, it is safe to say that Bayesian Logistic Regression is the best option between the two for this specific case.

This entry is adapted from the peer-reviewed paper 10.3390/info14080451

This entry is offline, you can click here to edit this entry!
Academic Video Service

Quick Survey

Encyclopedia MDPI is conducting a targeted survey to identify the specific barriers hindering efficient research. We invite you to spend 3 minutes defining the priorities for our next generation of structured knowledge tools.
Take Survey