1000/1000
Hot
Most Recent
 +1 point
The reviewed multimodal transport cost model is based on a relatively simple framework but demonstrates that other existing models of modal choice, multimodal transport and inventory location all oversimplify the transport process.
The globalisation of production and the demand for low-cost sourcing over the last three to four decades have led to greater demands for the physical movement of goods, and in parallel a need for the transfer of associated information. Movements of raw materials, semi-finished or finished goods are dynamic, and the ‘postponement’ of some processes often moves them closer to the customer. The transport of goods over long distances balances availability, increases choice and matches supply with demand. In parallel, sophisticated logistics and supply chain management systems have been developed to support supply networks.
Thus, freight transport is a fundamental aspect of balancing time and space and reducing unit costs. This is most observable on international routes where scale-economies are important. The methods of transport, the multimodal nature of many supply chains and the supporting infrastructure have therefore become increasingly sophisticated and diverse. Generally, the longer the transport distance, the more complex the solutions become, and trading protocols involving cargo owners, facilitators and transporters need to be regularly reviewed in order to adjust to technological developments and global trading dynamics [1].
International freight transport can range in scale from only a few to many thousands of kilometres. At close proximities transport methods may be unsophisticated, e.g., through the use of unimodal transport making use of existing infrastructure to bridge a small gap between the supplier and a customer. Over longer distances, at a regional or international scale, transport solutions become more varied with formal procedures and control protocols. Such control mechanisms are designed to facilitate intra-regional freight movements, and many trading blocs (EU, ASEAN and NAFTA are examples) attempt to facilitate the free movement of goods without compromising security and control.
Generally, over the last 70 years, although there have been several incremental technological improvements, freight transport has been reasonably stable, with evolutionary rather than revolutionary growth. It is likely that greater change will come over the next few decades but the fundamental basis that the majority of transport is a derived demand supporting other activities will remain. However, developing more efficient supply chains balancing the use of low-geared maritime transport, high-geared airfreight linked by intermodal road and rail transport to exploit economies of scale will likely continue, and transport solutions will need to be flexible in order to be able to respond to demand variations, technological developments and an increasing politicisation of trade [2]. It is in this context that this paper seeks to offer a perspective on how international multimodal transport can be best understood and more effective solutions developed.
The continuous increase in pressure on supply chains over the last decade and the advent of COVID-19 during the past year has led to the performance and efficiency of supply chains being brought into increasingly sharp focus. By extension, therefore, the research into modal supply chain capability and robustness is now arguably more important than ever before.
This entry seeks to examine the match between theoretical portrayals of multimodal transport in logistics chains and the real-time operation of such chains. A cost-time-distance model, originally developed in the 1990s, is used as the core theoretical framework for the discussion. The model has transport at its core, but it is flexible enough to accommodate a wide range of other parameters including, for example, capacity, ownership, speed, cost/tonne, reliability, stock holding, inventory cost/kg and the volumes, types and forms of the cargo itself.
It has long been recognised that transport is a key activity within logistics [3][4][5][6][7][8][9] and that, in turn, successful transport operations can be critical to supply chain efficiency both for inbound freight, such as components supply, and outward finished products distribution. For short-distance transport, especially internal land-based transport, solutions are usually clear-cut and simple; but over medium to long hauls modal combinations can be varied and complex [10]. In these cases, elements such as cost, capacity, convenience, reliability and practicality are considered together in a series of trade-offs; the door-to-door benefits of road haulage are thus compared with the qualities of a range of possible multimodal transport solutions [11][12]. Over long to very long distances, however, a wide range of influences come into play in determining freight routeing, and mode, method and carrier choice. The economies of the respective transport modes: air, sea, waterway, rail and road, form the basic framework for freight carriage and for supply chain structure optimisation from a transport perspective [13][14][15].
Indeed, the ever-decreasing pro rata unit costs over time of shipping, derived primarily from steadily increasing ship size and from parallel developments in cargo unitisation and containerisation, have been cited as decisive components in the globalisation of the world economy [16].
It has been noteworthy, however, that the development of theory of intermodal or multimodal transport provision has received much less attention than its practical application. This is especially true of the portrayal of the economic theory, which underpins the concepts of, respectively, modal choice and modal combination. Several underlying principles determine the roles of transport modes:
The balance of fixed versus variable costs
Modal characteristics, including networks, vehicles and regulatory regimes
Economies of scale and the cube law
The ‘cube law’ states that the volume or capacity of a ship increases in proportion to the cube of its dimension, whereas its fuel consumption is a function of its resistance through the water which is itself proportional to its frontal surface area, or the square of its width dimension. Thus, from a fuel-carrying point of view, a ship can theoretically be of any size. The advent and spread of containerisation, which greatly facilitated large-scale shipment of general cargo over long distances, led to the adoption of systems which were entirely different from those which were dominant hitherto [4][16]. Put simply, the methods of transport were revolutionised and transport and logistics research suddenly began to follow a new path.
Rather than focusing on modal competition, emphasis is now placed on how modes could best combine to produce least-cost, least-distance or least-time solutions; more subtly, solutions could now also involve ‘packages’ that could be tailored to particular requirements. Despite this revolutionary change in transport techniques, the literature has lagged behind with the emphasis still on modal choice [5] road-rail competition [17][18] intermodality [4] and modal indifference [18] or on inventory management, or supply chain management.
A separate branch of the literature covers risk, which captures commercial risks in the form of loss, damage and delay. At first glance, this could be closely linked to insurance premia, but this is not the case because:
there are some forms of risk which are not likely to be covered by insurance premia [19]; and
insurance premia usually relate more to the claims record of the insured rather than to the actual risk of using a specific route, mode or method.
The early work of Sharp [20] shed further light on the significance of damage risk in this context. Blauwens and Van de Voorde [21] looked at the underlying decision-making process in choosing between using road haulage or inland waterway in continental Europe. No assessment of loss, damage or delay was made, but they confirmed that time-savings were valued much more highly than the role of working capital [17]. Likewise, Kaatama [22] highlighted key considerations in the movement of goods (general freight, timber products, metals, paper) imports and exports, showing that financial cost persists as the most important consideration, but speed, service reliability and, in some cases damage can be almost as important. Baumol and Vinod [19] developed a ‘modal indifference curve’ which enabled the attributes of different modes to be evaluated in a simple trade-off analysis. They showed that, for example, if rail is slower than road it should not be cheaper; if air is faster than ship it should be more expensive and so on. Fowkes et al. [17] took a willingness to pay approach, which was somewhat similar, but more sophisticated. Although they only considered road versus rail, they looked at a wide commodity range from high value/low density to low value/high density. By varying the distance and volume, they examined how willing a potential customer is to pay more to receive goods more quickly. Conversely, they modelled how much less a customer would expect to pay for a slower service. More recently work by Kwak et al. [19] has considered the implications of risk in international supply chains.
Conventional and early approaches to modal decision-making can be synthesised and visually presented as in Figure 1. As can be seen from this synthesis, it is apparent that the ‘trade-offs’ were treated in what would seem to be an over-simplistic way, for example volume against value or weight against volume. What such approaches did not consider in a sophisticated way was that other factors may have also formed an important consideration in any decision that was made, for example how critical was time in the overall supply chain process.
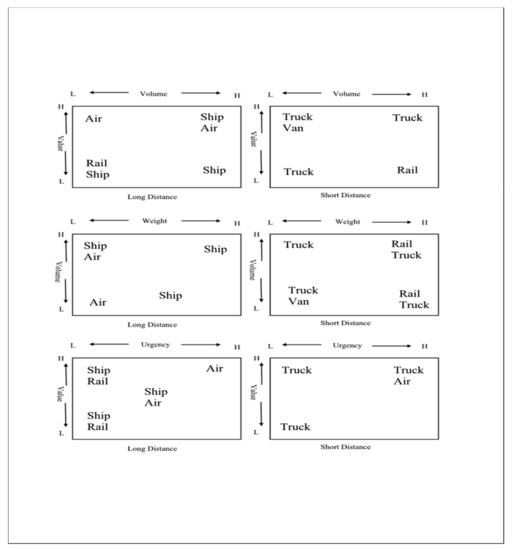
A further dimension which needs greater consideration, and which is not implicitly included in the synthesis outlined in Figure 1 which relates to commercial decision-making, is that of humanitarian crises and emergency conditions. In such situations, and other crisis contexts, perhaps most recently exhibited with the COVID-19 global pandemic, is the need to accommodate considerable variations and departures from standard responses. The works by Christopher and Tatham [24] and Tatham and Christopher [25][26] drew together a wide range of material which discusses the response required in emergency situations created by natural events such as earthquakes, droughts and tsunamis, among others. Specific consideration of adaptations to multimodal supply chains have been undertaken by, for example, Beresford and Pettit [27] and Al Hashimi et al. [28]. More recently, a work by Nikolopoulos et al. [29] added an additional dimension by developing a forecasting approach to disasters which could contribute to a more robust appreciation of the parameters it is necessary to account for in crisis situations.
The increasing interest in trade facilitation and transport liberalisation through the 1980s gave birth to a large body of literature [4][13][16][30] and the first attempts emerged to fuse the economists’ approach [21] with a multimodal viewpoint taken by transport geographers [16]. Early development work as shown in Figure 1 identified very little except the transport modes, and the potential for there to be interchange points between modes. This was used as a foundation onto which detail was added. The most obvious second layer of detail is probably the ports and inland terminals, as they form a logical link between theory and practice. Beresford [10] took a case study approach, following whisky exports from Scotland, UK, to Greece, and this enabled specific details to be formally added to develop a more comprehensive model for the first time as shown in Figure 2.
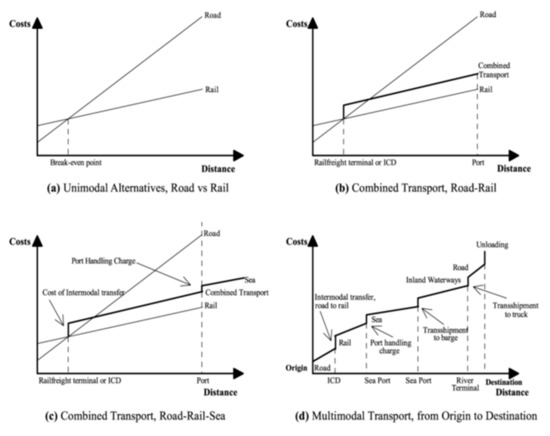
Figure 2. Multimodal transport cost model (Source: Adapted from Beresford [10]).
While inland terminals should be located at, or close to, the point where the economic competitiveness of one transport mode gives way to another, this is not simple, as discussed earlier; cargo volumes, cargo value-density, supply chain gearing and other factors complicate the picture considerably [5][31]. Even site specificities such as land availability, site shape and planning constraints play a critical role, with the result that this theoretical locational optimum for intermodal terminals is very difficult to achieve. Within the transport and cargo-handling or transfer step in the model there are many sub-components of the operation which could be separated out and, potentially, presented in the model. Port or terminal operating costs and transport costs especially lend themselves to more detailed treatment if required.
All methods of transport, whether passenger or freight, involve some effort (and hence implicitly cost) to provide and load the vehicle and, of course, to gain access to the relevant infrastructure. This start-up process can be envisaged as a vertical step in the curve with the height of the step being proportionate to the start-up cost. It is widely acknowledged that the bundle of costs enabling start-up is substantially greater for rail than for than for road transport but, conversely, provided the relevant load carrying units are well-utilised, there is a significant cost-saving per tonne-kilometre or per-passenger kilometre by using rail vis-à-vis road [17] over a certain distance. In any event, the road and rail operating cost curves can be envisaged as a start-point for a more inclusive model.
The first re-examination of the classic ‘road versus rail approach’ taken by [17] was by Beresford and Dubey [32]. The focal point of their study was the development of ‘Dry Ports’ or Inland Container distribution hubs as an integral part of trade expansion and modal integration. Thus, the literature, hitherto mostly restricted to a road/rail debate, was extended to embrace sea and inland waterway transport.
Several new and pertinent issues emerged when this attempt to capture the key characteristics of the four main surface transport modes in this way:
How should the angles of slope of the respective modes relate to each other?
Should the x and y axes be drawn to the same scale?
How high should the vertical steps be at the loading/unloading and interchange points?
Should the interchange points have a ‘realism’ such that each should stand for a terminal, depot or port where freight interchange takes place in reality?
Should the lines representing movement be straight or curved?
Should the diagram follow the full logistics chain from origin to destination or should it focus only on outward or inward segments?
Could the key parameters of cost, time and distance all be portrayed, or should the variable be paired into cost vs. distance and time vs. distance?
In practice, as the theory of multimodal transport is complex, it cannot be viewed as a simple extension of traditional bimodal models such as those suggested by Baumol and Vinod [18], or Fowkes et al. [17]. It is proposed that distance, time and cost should be considered as secondary and, as such, they can be invoked as an overlay to the main model. McKinnon [5] suggested 30 additional variables and, though the list lacks sophistication and it is certainly not exhaustive, these remain good candidates for ‘secondary variables’. In accordance with situation and need, these could in turn be split and again a number of studies have attempted this in the context of, for example, port logistics [33]. These studies shed considerable light on how the cost/time/distance model should be constructed and developed; four further key aspects need to be considered as below.
Empirical evidence points strongly towards trucking or road haulage, operating costs ranging from $1 per kilometre in an open-road uncongested environment over medium distances to $2 per kilometre over short distances or in congested environments [34]. This would convert to 10–20 cents per tonne-kilometre or 10–20 pence per tonne-mile for laden average-to-large trucks. If distances are very short, especially in urban stop-start conditions, operating costs would be higher still resulting in a steeper slope angle [12].
Trucks are also legally constrained in terms of length, width, height and overall gross weight, and by driver’s work hours. This effectively ‘lids’ the output of the vehicle in terms of maximum tonnage or volume transportable in a given time period [12]. In the model under development here, the relationship between trucking costs and distance can be taken as linear, but in reality there is some reduction in costs pro rata with distance, implying that the line representing truck operating costs should curve to reflect the slight attenuation of costs with distance. The variation in operating conditions by location, time of day, country etc., would make this unworkable, however, and the portrayal of the distance-costs relationship as a straight line is deemed acceptable for clarity and to avoid spurious or unnecessary complexity.
In the model, road transport is the natural start-finish mode, and it is thus represented by a comparatively steeply-angled line to reflect its relatively high operating costs in standard conditions. Shipping costs, on the other hand, are well known to be extremely low for large, well-utilised vessels (for example, the early work of Pearson and Fossey [35], and contemporary studies such as Stopford [14]). Ship operating costs of just a few cents per tonne kilometre, container-mile or container-kilometre are regularly quoted [14][36], and this has an obvious implication for the portrayal of shipping costs in the model. However, it should be noted that, in the same way that larger trucks tend to be deployed for the longest distances, and smaller trucks are generally used for local freight collection and distribution, the largest vessels are used on the large volume, long distance trades.
This has remained true for decades [14] despite an obvious and clear trend towards ever-larger ships on most of the main trade lanes. As is the case for truck deployment, it is likewise true that smaller ships serve lower-volume trades, sail shorter distances and require smaller ports. The logistics of container shipping per se often therefore resolve into a ‘hub and spoke’ system with the smaller feeder ships in effect servicing the larger ‘mother’ vessels at hub or load-centre ports; there is an extremely large literature on this [33] but the subject of shipping network structures lies outside the scope of this paper. For decades, sea-going vessels in virtually all sectors have become inexorably larger, at least until external constraints such as port water depth or canal width have been reached [14][37]. For the transport cost-model, it is therefore clear that the shipping leg in a multimodal transport operation will be portrayed by a shallow angled line reflecting a slow accumulation of cost with distance per unit carried. In some cases (shipping over very long distances with very large vessels) the curve could approach the horizontal; that is to say, unit costs per kilometre or per nautical mile would be extremely low. For smaller vessels, e.g., tramp ships or feeder ships, the unit costs will clearly be higher and thus translates into a steeper angle for the shipping cost line in the model.
For both rail and waterway transport, the carrying capacity is limited by the dimension and tractive power constraints. In the case of rail, virtually all major networks work to strict loading gauge limits which specify maximum height and width of the freight (or passenger) carrying unit. The lengths of individual wagons are typically 60–80 feet (18–25 m); this is again constrained by, see, for example, overhang when cornering. Wagon widths are limited to 2.5–3 m, mostly by platform and furniture clearance, and again cornering cut-in. In summary, wherever rail freight services operate the trains are ultimately constrained volumetrically by limits on train height and width; weight carrying is also constrained by motive power capability and axle weight loadings. Internationally, the volumetric and weight-carrying capabilities of freight railways are clearly very variable; trains can be comparable to feeder ships in capacity and cost per-tonne kilometre, but often they are configured for agility as much as for capacity to suit modern logistics requirements with high running speeds with medium sized trains. The result is that, on many routes, 100–130 kilometres per hour (65–80 miles per hour) with 50–100 containers is seen as close to optimum at least on heavily-utilised UK/European networks [38]. Such constraints are formalized in inter-regional or pan-regional legal frameworks.
For the cost model under discussion here, this clearly implies that, provided that distances are long enough and volumes large enough, unit costs of rail freight operations should be substantially lower pro-rata than trucking but significantly more expensive than shipping in most cases. The transport-cost line for rail should therefore be portrayed exhibiting an angle which is somewhere between that for road-haulage and that for shipping. However, intermodal movements involving road-rail combined transport must include a cost step in the model to acknowledge the effort put in and costs incurred in the intermodal transport operation.
Canal or inland water transport is similarly characterised by a combination of some unconstrained dimensions and some which are constrained. In practice, the mix of these varies according to region, type of waterway, seasonal factors, whether or not the waterway is bridged and local regulatory regimes. Lloyd’s Maritime Atlas [39] and Lloyd’s Ports of the World [37] summarise the navigational features and dimensional limits of the longer waterways of the world. For inland waterborne transport to adequately compensate for its slow operational speeds and its inability to offer door-to-door services, volumetric and weight carrying capabilities have to be substantially greater, perhaps an order of magnitude greater than those of trucks [11].
As is the case for freight trains, inland waterway vessels vary considerably in size, reflecting both local physical constraints and levels of demand. Research suggests that vessel draughts of around 9 feet (2.5 m) are required for large-scale, effective and competitive water transport [37][39]. Similarly, vessel beam, length and air draught constraints should not be so tight as to limit carrying capability (and vessel stability) to a level that, locally, trucking is more effective and lower cost [40]. In extremis, inland navigation is virtually unconstrained, e.g., on the Amazon where seagoing vessels with a draught of 11+ meters can sail in any season as far as Manaus [39]. On major European rivers, vessels with a draught 3 m and more, carrying 2000 tonnes of cargo are commonplace and the regulatory regime (e.g., banning truck operation at weekends over certain routes) strongly favours inland navigation [41].
Translating this complex mix of variations into a generality for the cost model, the steepness of the waterway cost curve will almost invariably be less than that of the trucking curve, but it will be steeper than the open-sea shipping curve. Whether its steepness is greater than, or less than that of the rail curve, will depend on particular physical, regulatory and commercial criteria, especially capacity utilisation. In the same way that rail terminals are very rarely available at cargo origins/destinations, so inland waterway ports are seldom true origins or destinations; in the model therefore, the waterway cost curve, like the rail curve should stop short of the vertical axis. For both rail and waterway, the precise logistics circumstances will ultimately determine how the cost curves should be portrayed in this regard.
The unimodal approach to transport choice in logistics is fundamentally flawed in the area of modal interaction. Even the paper by Frejinger et al. [42], which evaluates the environmental footprints of transport operations in Europe, fails to portray modal interchange accurately; rather, road, rail and waterway transport are portrayed in isolation. In reality, most, if not all, long supply chains are multimodal and at least one interface between modes is a critical component both of the chain structure itself and of the model development.
The theoretical model initially proposed by Beresford and Dubey [27] saw its first application in the study of European container logistics by Hosley and Beresford [43]. This captured both the freight movement (ship, road, rail) components and the intermodal transfer components (at ports or inland terminals) and scaled them according to cost. It emerged that port handling charges for containerised freight are typically 2–4 times as high as charges levied at inland terminals where infrastructure, equipment and manning costs appear to be much less; in the model therefore the cost step at the ports will typically be 2–4 times as high as the ‘step’ at inland terminals. At both locations, no material progress along the supply chain is made, but there may be value-addition or inventory management opportunities [8]. This has clear implications for complex multimodal chains both in the abstract and in the field: for a chain to be competitive, the economics of transferring freight between modes must be at least equaled by the cost/time savings or other benefits gained by using the additional mode or modes.
Where shipments are intercontinental, i.e., they involve land-sea or land-air combinations of necessity, many ‘cost-steps’ can be observed [44]. Jung [44] compared the Far East–Europe landbridge route with the shipping route using the framework under discussion here and demonstrated that the number of times a vessel or a train stops at intermediate points en-route can be critical in determining the competitive position of each route against the other. Furthermore, he showed that the total time spent at rail terminals (land bridge route) or ports (shipping routes) can be greater than the movement time if trains or ships stop even fairly frequently for cargo pick-up/drop-off. In the model, this is visibly evident from the large number of cost steps in the progress line, and the height of the steps give an at-a-glance view of the relative handling costs at respective terminals. In turn, this gives a first indication of each terminals’ efficiency relative to the others along the route.
The model depends fundamentally on an x/y comparison. Although x, y and z axes could be utilised and the model could therefore be presented in 3 dimensions, its value is probably greatest in pair-wise form. Classically, cost versus distance, and time versus distance invite comparison, but it could be contended that in many logistics environments, distance per se is not in itself important: rarely do logisticians, or the cargo owners, worry too much about distances shipments actually cover. It could be argued, however, that distance data should be obtained first to establish an invariant base for comparison. The early works of Pearson and Fossey [35] and Hayuth [4] demonstrate that, in landbridge operations at least, distances are critical to the relative competitiveness of the shipping and rail-based alternatives. Pearson and Fossey [35] refer to this critical distance measure as the ‘convexity ratio’.
On the other hand, it has widely been accepted that as goods become more valuable, time criticality increases, especially where shipments are tied into a manufacturing or assembly process. The very structure of logistics, especially the transport component, intimately ties certain costs, at least partly, to time (through driver’s wages) and other cost to distance (through vehicle fuel consumption). There is, therefore, a very strong argument for taking a pair-wise approach; thus distance/cost, time/distance or time/cost, are most easily handled in the model. The recent Freight Best Practice case studies published by the UK Government’s Department for Transport, which focus on multimodal transport solutions for internal and international freight consignments, confirm the practical value of this approach [45]. Whether distances matter or not, the model is flexible enough to employ a numeric scale or not, as preferred.
Banomyong and Beresford [31] widened the reach of the cost model, and increased its value, by including a ‘confidence’ index. Though crude, this provided a significant advancement as it demonstrated the roles not only of the quantifiable commercial elements of alternative routes in an international supply chain, but also of the ‘softer’ influences on decision-making. The focus of this research was the export of textile products from Indo-China to Europe, and various routeing options at the supply end were examined. Although the differences between the routes were not large, the cost-time-distance model gave the study the disciplined framework it needed for maximum clarity.
UNESCAP [46][47] followed a similar disciplined path in the rigorous examination of, respectively, trade routes linking Indo-China with central Asia, and overland trade between the Far East and Europe. These studies pushed the application of the cost model into yet more geographical areas, but perhaps more importantly, they developed the confidence index by following a ‘best performance–worst performance’ approach to corridor analysis. In this way, the model had now embraced supply chain variability in its framework and the disciplined approach followed by the model provides the opportunity to measure performance against the same parameters (Figure 2).


