1000/1000
Hot
Most Recent
 +1 point
Every year, plant diseases cause a significant loss of valuable food crops around the world. The plant and crop disease management practice implemented in order to mitigate damages have changed considerably. Today, through the application of new information and communication technologies, it is possible to predict the onset or change in the severity of diseases using modern big data analysis techniques. In this paper, we present an analysis and classification of research studies conducted over the past decade that forecast the onset of disease at a pre-symptomatic stage (i.e., symptoms not visible to the naked eye) or at an early stage. We examine the specific approaches and methods adopted, pre-processing techniques and data used, performance metrics, and expected results, highlighting the issues encountered. The results of the study reveal that this practice is still in its infancy and that many barriers need to be overcome.
Crop and plant diseases entail serious implications for food security and production losses. Over the years, the lasting global trade and the changing climate have not only exacerbated the existing favorable conditions for plant and crop disease but have also created new conditions with which agriculture must now contend. As the Food and Agriculture Organization of the United Nations (FAO)[1] asserts, plant pests and diseases are responsible for losses from 20% to 40% of annual global food production. This means that timely disease management will be necessary in order to address the increased food demand caused by population growth estimated by 2050[2].
To meet these challenges, several studies[3][4][5][6][7][8] have been conducted with the aim of increasing our understanding of the seasonal effect of environmental and weather conditions on diseases affecting major food crops. The recent employment of new information and communication technologies (ICT) such as the Internet of Things (IoT)[9], remote sensing[10], and cloud computing[11] are incentivizing the diffusion of Precision Agriculture (PA), defined as the application of technologies and principles to manage the spatial and temporal variability associated with all aspects of agricultural production for the purpose of improving crop performance and environmental quality[12].
The aforementioned digital technologies contribute to improving our understanding by continuously monitoring and measuring different physical phenomena[13][14], producing a huge amount of data, termed as Big Data[15]. Agricultural big data is successfully being used for various tasks, such as yield prediction [16], weed and pest/disease detection [17], crop and food detection[18], risk management, food safety[19] and spoilage prevention, and operational/ equipment management, including plant and disease prediction[3][4][20]. The analysis of Big Data by means of Machine Learning (ML) [21], Deep Learning (DL)[22], and Artificial Intelligence (AI)[3] techniques has only only recently begun to be applied[15].
A decade of research has generated considerable knowledge of the complex, interconnected, and dynamic process of crop management. It is well known that plant disease responds to different climatic and environmental variables in distinct ways [23][24], and so the outcome of any host–pathogen interaction in uncertain conditions is not readily predictable. However, according to Classen et al. [25], there is still a lack of models involved in determining plant health under a changing climate, as well as their direct and indirect effects and interactions.
As a consequence, more effort and research is urgently needed with the aim of developing novel solutions to prevent and mitigate the impact of crop and plant disease to food production, especially at an early stage.
Thus, the main contribution of this study is to present an analysis and classification of the algorithms applied in the prediction of crop and plant diseases by highlighting the problems encountered, the methods and techniques employed, and the data used. In the literature, plant diseases have been predicted in several ways. This review considers crop and plant disease prediction models that adopt AI, ML, and DL algorithms to predict symptoms before they appear in the field or in an early stage with mild and small lesions. To this end, detection techniques were not taken into consideration. Besides this, a critical discussion of open challenges and directions for future research is attempted.
The methodological design for this study’s bibliographic analysis involved two phases: (a) the collection of related research and (b) the analysis of these contributions. Data were collected from the scientific databases IEEE Xplore, ScienceDirect, MDPI, Hindawi, and from the web-based scientific indexing services Web of Science and Google Scholar. Regarding the search keywords, the following query was performed:
[“crop disease” OR “plant disease”] AND [“prediction” OR “forecasting”]
Only documents regarding conferences and journal articles published between 2010 to 2020 were considered. From the results, we filtered out the papers that did not provide sufficient descriptive elements for the method adopted. In this way, the number of documents was reduced to 46. Finally, each paper was analyzed considering the general approach, the AI, ML, or DL techniques employed, the sources, the type of data used, the predicted output, and the applied performance metrics.
To the best of our knowledge, this is the first study that focuses exclusively on predicting the symptoms of plant and crop diseases before they appear in the field or in an early stage with mild and minor lesions. A brief review of 10 scientific works related to pest detection and prediction is provided in [26], while other review works were conducted for different domains[22]and sub-domains[27][28][29][30] belonging to the agriculture sector.
The occurrence of plant and crop diseases is hugely dependent on weather and envi- ronmental fluctuations. The literature considers the conceptual model referred to as the disease triangle as a fundamental principle of the factors involved in disease causation. A disease occurs when a disease-causing agent, or pathogen, meets the right host organism under environmental conditions favorable to disease development. The drawing of the dis- ease triangle was most likely first published by Stevens[31]. When these three components are present at the same time, a disease (shaded region) will occur if a susceptible host plant is in intimate association with a virulent plant pathogen under favorable environmental conditions (see Figure 1). Over the years, as Francl[32] notes, some plant pathologists have elaborated on the disease triangle by adding one or more parameters[33], such as humans, vectors, and time. Since this time, plant biologists have devoted greater effort toward studying the interactions and direct/indirect impacts of various aspects of climate change on the development of plant disease epidemics. The majority of these studies show that it is essential to model the issue while including multiple climate change parameters. Newbery et al.[6] provide a graphical scheme of how climate, crop growth, and dis- ease models can be combined to produce projections of crop growth stages and disease incidence/severity for different climate change scenarios (Figure 2).
As described by Bock et al.[34] there are several ways to estimate or measure plant disease symptoms that quantify the intensity, prevalence, incidence, or severity of disease. The terms used to describe concepts and their interpretation are important in plant disease assessment, and are subject to redefinition as a result of advances made in other fields, including measurement science[35]. To avoid confusion, the following are the main disease assessment terms and concepts[34]:
- Disease intensity is a general term used to describe the amount of disease present in a population[36];
- Disease prevalence is the proportion (or percentage) of fields, counties, states, etc. in which the disease is detected, and reveals the disease at a grander scale than incidence[36];Disease incidence is the proportion (or percentage) of plants (or plant units, leaves, branches, etc.) that are diseased out of the total number assessed[35][36];
- Disease severity is the area (relative or absolute) of the sampling unit (leaf, fruit, etc.) showing symptoms of disease. It is most often expressed as a percentage or proportion[36].
The data used by the research works examined originated from several heteroge- neous sources; i.e., weather stations[3][20] field sensors, farmer field surveys, remote sensing [37], images captured by unmanned aerial vehicles (UAV)[38], pictures originating from cameras or multispectral and hyperspectral cameras, and on-line web services [39].To gather the available weather and environmental parameters, a large number of studies relied on third-party organizations, such as national/regional governmen- tal services [40][41][42][43] . Only a restricted number of these works gathered data with their own on-field IoT network [40][41][42][43][44][45]. The disease occurrence/severity under study was collected by performing field surveys or was provided by regional/local agricultural institutions[3][14][20][46][47][48]. The data analyzed differed in volume, and were represented in different types and formats.
As Gibert et al.[49] state, pre-processing is one of the critical steps of data analysis in any of its forms. Most of the studies reviewed at this stage removed the noise represented by incorrect and incomplete data to which feature selection was subsequently applied. The most common pre-processing procedure was data normalization[3][20][46][48][50][51][52], which transforms the characteristics into a similar scale in order to improve the performance and stability of the model training. Feature selection concerns the process of reducing a large number of features in order to identify those that contribute most to the prediction of the variable or output under examination. To this end, some papers used Pearson correlation [37][53], Principal Component Analysis (PCA) [38][41][52][54][55], and Linear Discriminant Analysis (LDA)[54]. Other operations involved different data balancing techniques. Many scientific papers, due to the limited size of the data [3][20], have addressed the problem of unbalanced data. To increase the number of examples in the training set and avoid overfitting situations that would have penalized performance and limited the ability of the model to generalize, the following methods were applied: Synthetic Minority Over-Sampling Technique (SMOTE)[3][14], Random Oversampling (RO) [56], Random Undersampling (RUS), and Importance Sampling (IMPS)[57].
Table 1 shows the techniques and approaches (column 4) adopted by the papers under review. All 46 scientific studies analyze Big Data according to a single technique or combination of methods, which model their particular cases as classification and regression problems. Considering the different factors that interact with the epidemiology of plant and crop diseases, and the different approaches employed by each study, the prediction models can be classified into three main groups based on the input parameters processed:
Almost half of the research works employed weather data (29 papers, 63%); of the remaining studies, 10 papers (29%) used image processing, and 7 papers (15%) performed a cross-analysis of different types of data such as meteorological variables, remote sensing images, biotic and abiotic factors. A brief summary of some of these works is provided below.
Forecast Models Based on Weather Data
A wide variety of economically important crop diseases are closely related to growing season weather conditions[20]. Researchers initially studied solutions based on analytical and simulation models[58]. However, the complexity of many plant disease processes and their dependence on several factors is such that our understanding, and thus the forecasting skill of many mathematical/statistical techniques, is inherently limited[59]. A detailed review of the mathematical models that have been widely explored in the literature for growing potatoes and rice can be found in [20][60], while a clearinghouse of information about models developed for economically important crop and turf diseases is provided in an online database named PestCast from the University of California[61]. Gradually, thanks to the widespread diffusion of recent ICT technologies in the agricultural sector, research has subsequently focused more on Machine Learning and Artificial Intelligence techniques in order to discover, understand, and evaluate new models and relationships that are too complex to find with defined mathematical relationships. Therefore, these are useful for improving agricultural management practices.Our literature study shows that the techniques adopted for the prediction of crop and plant diseases based on meteorological parameters include the Support Vector Machine (nine papers), Artificial Neural Network (seven papers), Random Forest (four papers), Long Short-Term Memory (three papers), the Extreme Learning Machine (three papers), and Multi-Layer Perceptron (two paper). Most of these contributions employed an average of five input parameters, where the most commonly used included the maximum tempera- ture, minimum temperature, humidity, rainfall, and wind speed, respectively. Besides the aforementioned variables, other models incorporated evaporation[42], brightness[46] and sunshine hours[48]. Generally, the studies preferred to process hourly weather data in- stead of daily weather data to produce more accurate predictions as well as to identify new patterns that are useful to understand the complex processes more completely. The study periods used in the research works ranged from two to five years.
Fenu and Malloci[20] investigated whether meteorological variables collected by regional weather stations could be used to predict potato late blight risk in southern Sardinia using a Machine Learning approach. When designing the potato late blight prediction model, such hourly historical weather data as temperature, humidity, rainfall, speed wind, and solar radiation collected from several locations over 4 years (2016–2019) were analyzed. A Feed-Forward Neural Network (FFNN) and Support Vector Machine Classification (SVC) were adopted and validated with a stratified k-fold cross algorithm. The results showed that SVM outperformed the ANN in classifying low and high risk levels, while ANN better discriminated the medium risk level. An extension of this work in[3] investigated the crop–weather–disease relationships for potato late blight onset. The findings revealed that temperature, humidity, and wind speed played a key role in the prediction. Later, the models were integrated into a Decision Support System (DSS) called LANDS (Laore Architecture Network Development for Sardinia) [14] to help farmers in decision-making.Malicdem and Fernandez[46] employed an Artificial Neural Network and a Sup- port Vector Machine algorithm to forecast rice blast disease occurrence and severity in specific rice growth stages based on the weather conditions of the same year. They pre- processed data using PCA to determine the most important weather information. Their results showed that precipitation was the greatest influencing variable (48%) in rice blast disease onset, followed by minimum temperature (31%), maximum temperature (17%), and humidity (3%). Best performances were obtained with SVM for both problems.
A different approach was adopted by Kim et al. [48] to develop a region-specific model to predict rice blast indices for 17 cultivars. In this study, temporal patterns of the weather variables were considered during modeling. The authors applied a Long Short-Term Memory network (LSTM) to the past degree of blast onset data, and historical climatic data, unlike previous studies that required climate information in the same year as the forecasting time. In addition, the influences of the LSTM input factors—i.e., rice blast disease scores, air temperature, relative humidity, and sunshine hours—on the predictive accuracy were analyzed combining the input variables. The prediction accuracies were not very high; furthermore, some individual cultivars were predicted better than others. Specifically, the accuracy ranged between 40% and 79% across different sites. However, regardless of the cultivar, this study indicated that an early prediction of rice blast occurrence based on climate data for the past three years is possible.Bhatia et al.[56] developed a hybrid of the Support Vector Machine (SVM) and Logistic Regression (LR) algorithms to predict powdery mildew disease in tomato plant. The SVM was used to minimize the noise in data with the help of the Adaptive Sampling-Based Noise Reduction (ANR) method. The resultant training set obtained from the SVM–ANR method was further fed into the LR classifier for the development of the classification model. The proposed hybrid SVM–LR method obtained higher accuracy in predicting powdery mildew disease compared to the SVM and LR algorithms alone. However, the work did not use any feature selection algorithm to identify the most important features. An extended study was later proposed by the authors implementing an Extreme Learning Machine (ELM) algorithm[57].Xiao et al.[42] treated the problem of cotton diseases and pests occurrence as a time series classification problem using an LSTM network. They compared the LSTM architecture with other machine learning methods such as KNN, SVC, and Random Forest to predict Bollworm disease. The results showed that the LSTM model outperformed other traditional prediction models.Nettleton et al.[62] compared four models for predicting rice blast disease: two operational process-based models (Yoshino and the Water Accounting Rice Model (WARM)) and two approaches based on Machine Learning algorithms (M5Rules and LSTM). The results proved that Machine Learning methods approximated the performances of two process-based models used for years in operational contexts.Another approach followed by Sannakki et al. [39] also envisaged the combination of the regression model for crop forecasting with the weather prediction performed by an Artificial Neural Network with a modified K-Nearest-Neighbor validation. The authors designed a system tjat was able to predict powdery mildew of grape based on forecasted weather data such as humidity and temperature.Ahmadi et al. [63]applied the Artificial Neural Network analysis technique to discrim- inating and classifying fungal infections in oil palm trees at an early stage using raw, first, and second derivative spectroradiometer datasets. The results confirmed that the ANN has the capacity to identify the presence of dynamic relationships that exist between the variables tested in the work, achieving relevant classification accuracy for mildly infected palms that were not yet manifesting visible symptoms using raw individual spectral data.Yeh et al.[64] studied the development of strawberry leaf anthracnose by analyzing hyperspectral images and determining a group of spectral bands that serve to differentiate between a healthy and an asymptomatic leaf, obtaining classification results of 88% through a progressive discriminant analysis.The studies described above concerned single plots, but agricultural production also involves greenhouses. An interesting case study applied to this work environment was conducted by Ghaffari et al. [52]. In this context, a major challenge is to detect and quantify diseases within a plant population before they spread throughout a greenhouse to allow control within a short timeframe. Often, this preventive action is carried out through laboratory tests. The goal of the scientific work was to determine whether it was possible to replace existing biological and laboratory diagnostic systems with an electronic nose. The volatile organic compounds (VOCs), humidity, and temperatures were analyzed with MLP, LVQ and RBF neural network techniques. From the findings, the use of the electronic nose played an important role in discriminating between healthy and infected tomato plants, and this method can therefore be used as a potential early disease detection tool for tomato crops in commercial greenhouses.
Forecast Models Based on Image Processing
Regarding the models based on image processing, researchers used Machine Learning and Deep Learning algorithms such as Multi-Layer Perceptron (MLP), Extreme Learning Machine (ELM), Convolutional Neural Networks (CNNs), Random Forest (RF), Support Vector Regression (SVR) and Logistic Regression.Duarte-Garvajalino et al.[38] investigated an early warning model to forecast potato late blight symptoms at early stages using 126 multi-spectral images captured with un- manned aerial vehicles (UAV) 85 days after planting. The study compared two Machine Learning models—Support Vector Regression and Random Forest—with two types of arti- ficial neural networks—MLP and CNN. The experiments carried out considering spectral differences, Normalized Difference Vegetation Index (NDVI), and dimension reduction methods indicated that Deep Learning Convolutional Neural Networks outperformed Multi-Layer Perceptron and Support Vector Regression in predicting the severity of P. infes- tans infection of potato crops; Random Forests also performed remarkably well, followed by MLP using band differences.Zhang et al.[37] studied a powdery mildew (PM) disease forecasting model at a regional scale, adopting multiple sources of remote sensing information. The authors carried out a feature selection to identify the vegetation indices/phases that were most sensitive to PM for model establishment based on Logistic Regression analysis. This step led to a total of nine variables as input variables of the model. The results varied under different thresholds, but reached a generally satisfactory accuracy of 72%.Rumpf et al. [65] demonstrated the feasibility of the presymptomatic identification of foliar sugar beet diseases. This study combined different vegetation indices together with the SVM algorithm (I) to discriminate diseased from non-diseased sugar beet leaves, (II) to differentiate between the diseases Cercospora leaf spot, leaf rust, and powdery mildew, and (III) to identify diseases even before specific symptoms became visible. Regarding the third point, the classifier achieved significant results; e.g., leaves inoculated with C. beticola were correctly classified with an accuracy range from 65% to 80%, even before symptoms became visible. In order to additionally improve the detection, the authors suggested finding wavelengths or combinations of wavelengths that were more specific for the given task.Zhu et al. [66] investigated the presymptomatic detection of tobacco disease using hyperspectral imaging, combined with the variable selection method and Machine Learn- ing classifiers such as the Back-Propagation Neural Network (BPNN), Extreme Learning Machine (ELM), and Least Squares Support Vector Machine (LS-SVM). The majority of the models gave satisfactory results with classification accuracies of prediction of over 85%.
Forecast Models Based on Distinct Types of Data Coming from Various Heterogeneous Sources
Similarly, the prediction models that were used to perform cross-analysis included Regression Analysis (three papers), Machine Learning (three papers), and Deep Learning (one paper) methods. Among these, different approaches were identified. Three studies combined weather data with images captured by various sources.Zhang et al. [67] integrated meteorological data (precipitation, temperature, radiation, and humidity) and remotely-sensed variables (RG, Rr, RNIR, Triangular Vegetation Index (TVI), Soil Adjusted Vegetation Index (SAVI), Disease Water Stress Index Shortwave(DSWI), Infrared Water Stress Index (SIWSI), Land Surface Temperature (LST) to forecast powdery mildew (PM) on wheat at the regional scale. The authors examined the feasibility of integrating multi-source data for disease prediction through a Logistic Regression model. The comparison between the model constructed with meteorological data only and the integrated model constructed with both remote sensing and meteorological data showed an increase in overall accuracy from 69% to 78% when using the integrated model. In particular, a considerable improvement was evident for the years with high disease prevalence, which was less obvious with a low level of presence. Among the variables, a significant influence on PM pathogen occurrence prediction was exerted by four meteorological parameters— precipitation, temperature, sun radiation, and humidity—as well as by two remotely sensed features including Rr and LST.Zhao et al. [68] conducted a study at the provincial scale to forecast four levels of infection (healthy, mild, moderate, and severe) of wheat powdery mildew using the Decision-Tree algorithm. The overall forecasting accuracy achieved when analyzing NDVI, LST, rainfall, and temperature factors was 83.33%. The limitations that affected the results were traced to the restriction of spatial resolution and to the imaging quality of optical remote sensing imagery, as well as distinguishing between healthy and mild positions, especially at the early infection stage.Kaur and Kaur [69] employed k-means clustering and Deep Neural Network learning to detect seven orange diseases and to predict the names of diseases based on image data and weather features.Finally, four works predicted disease occurrence by analyzing weather data, abiotic, and biotic factors. Badnakhe et al.[70] focused on developing a Citrus Gummosis predic- tion model using Support Vector Regression (SVR) and Multi-Linear Regression (MLR) analyzing various plant, soil, and environmental parameters. Among these, soil moisture (SM), soil temperature (ST), Leaf Area Index (LAI) and chlorophyll (Cab) were included, where LAI and (Cab) values were retrieved through the Inverse PROSAIL model and were subsequently validated with the field data. The results showed that the SVR model gave fairly good performance as compared to MLR. In addition to the separate models, the au- thors proposed a combined scenario approach (the Integrated Gummosis Disease Forecast Model (IGDFM)) to determine the interconnectivity of the parametric conditions (weather– soil–plant parameters) with disease physiology with respect to the different age groups of the plants. The RMSE values of their integrated approach for higher age-group plants (i.e., 11–15 years) in the combined scenario were 0.9061 and 0.8518 for SVR and MLR methods, respectively. This research yielded the discovery of the months in which the rate of disease occurrence is high, but also which factors are crucial in the predictions. They found that the disease occurrence increases with an increase in humidity and soil moisture and a decrease in soil temperature. The soil parameter played a key role in quantifying the disease predic- tion with the models. Lu et al.[71] developed a novel probabilistic model (i.e., the Bayesian network model) to forecast the risk of PM in vineyards based on environmental (weather, climate), pathogenic (development stages), and host (crop cultivar-specific susceptibil- ity) factors. The model was tested using 13 years of data for three susceptible cultivars. Wang et al. [72] adopted a Wavelet Transformation and a Support Vector Machine to esti- mate the occurrence of three diseases that affect cucumber using 13 variables, divided into soil data, weather data, and disease data. Yang et al.[73] employed a Bayesian network model with four meteorological variables and one phonological parameter to forecast yellow rust of winter wheat at a regional scale. The performance of the model was evalu- ated against a weekly survey data during wheat’s key growth stages (the reviving stage, jointing stage, heading stage, and milk stage) from 2010 to 2012. The disease forecasting results showed that the model was able to produce a reasonable risk map to indicate the disease pressure across the region. In addition, the Bayesian network outperformed the BP neural network and the Fisher Linear Discriminant Analysis (FLDA) in terms of accuracy, especially in the prediction of the heading stage and milk stage, which are important time points for disease prevention.
For the analyzed research contributions, the authors modeled the problem following different scientific approaches. Most of the studies dealt with the issue as a binary or multi-class classification, while other authors preferred to predict continuous numerical values (see Table 1). The binary classification models were adopted to estimate the disease occurrence using labels such as disease did not occur and disease occurred. On the other hand, the multi-class classification models were designed to forecast the disease severity with labels ranging from 3 to 5 classes[20][40][48]. Similarly, continuous numerical values were used for the last purpose mentioned above[41][43]. Finally, only one paper predicted the first date of disease occurrence [47].
Crop and plant disease forecast models were evaluated by means of various metrics. As emerged from the study of kamilaris and Prenafeta-Boldú[22], in the present sub- domain, it is confirmed that accuracy was the most adopted metric, as it was used in 72% of papers examined, followed by confusion matrix (11 papers), precision (nine papers), recall (seven papers), and F1 measures (seven papers). In total, 46 papers combined different metrics to evaluate the predictions, while 11 studies used accuracy as the only performance metric. Some research involved the root mean square error (six papers), R squared (six papers), mean absolute error (three papers), mean squared error (three papers), and others (see Table 1).
Regarding the frameworks used, most of the research works adopted the following programming languages and tools:
Tensorflow: https://www.tensorflow.org/.
A delicate aspect of this work is to examine the computational efficiency of each study in relation to other papers, as multiple techniques, datasets, and parameters were used and different approaches were considered; furthermore, various diseases and crops were analyzed under different conditions. According to Wang and Ma [40], under different conditions, the key factors of disease epidemics may be different. Therefore, we focus only on the comparisons made in the same paper using the same experimental conditions. In al- most all cases, the Support Vector Machine outperformed other implemented approaches. Malicdem and Fernandez [46] compared the ANN and SVM to predict disease severity as well as the occurrence or non-occurrence of rice blast within each growth stage of the rice crop. The first task was modeled as a classification problem, while the second one was considered a regression problem. Both the ANN and SVM classifiers produced an average accuracy above 90%, with the SVM scoring at least 93% on each of the different growth stages. Using the paired t-test in the results statistically showed that the difference of the accuracy of the Machine Learning algorithms was significant (p-value < 0.01). This implies that the built SVM classifier was significantly more accurate than the corresponding ANN classifier. Likewise, SVM outperformed ANN in the investigation of the regression problem (p-value < 0.02). SVM seems to be superior to the regression model when employed with an RBF or polynomial function as a kernel in the prediction of wheat stripe rust disease [40]. However, similar results were obtained in two studies. Fenu and Malloci [20] compared the SVM and ANN to forecast late blight disease severity in potato crop. In this paper, the SVM was more accurate in distinguishing the low and high severity levels, while ANN classified the medium severity level better. In the prediction of powdery mildew disease in tomato plant [56], the SVM achieved an accuracy of 89.31%, and Linear Regression recorded an accuracy of 87.02%. However, both models were found to be efficient when using a hybrid approach involving two steps: the first was noise removal by ANR and SVM techniques, and the second was the training of the LR model followed by 10-fold cross validation of the modified dataset. The proposed hybrid SVM–LR classifier performed 3.06% better than SVM and 5.35% better than LR, with an accuracy of 92.37%. Furthermore, when predicting the first date of occurrence [47], Support Vector Re- gression achieved better results than the other three statistical methods of pace regression, linear regression and the NICS moving-average method, the last of which is the most-often used of the existing conventional models for the prediction of late blight. The accuracy of prediction was 64.3%, thus showing a higher degree of accuracy compared with 42.9% by the conventional moving-average method, 42.9% by pace regression and 35.7% by linear regression. The NICS moving-average method was able to predict only six of 14 years. In contrast, SVR was able to predict nine years—21.4% better than the NICS moving-average method. Fair performances were also confirmed in the analysis of various climate–soil– plant factors in the prediction of citrus gummosis disease, where SVM obtained 0.9061 (RMSE) in contrast to 0.8518 (RMSE) obtained with the Multi-Linear Regression model [70].Worse performance was found when SVR was used in image processing. The authors in [38] compared Support Vector Regression and Random Forest with MLP and CNN. SVR suffered from high dimensionality and the computational complexity required to process images. Random Forest was found to be the most stable (lower standard error) estimator, but CNN obtained the lowest slope and intercept regression estimator and achieved the lowest mean MAE (11.72%) and RMSE (15.09%). From these results, CNNs seem to be better than RF and MLP using band differences.Finally, the SVM was evaluated in [66] with a broad set of classifiers, including Partial Least Squares-Discrimination Analysis (PLS-DA), Random Forest (RF), Back-Propagation Neural Network (BPNN), Extreme Learning Machine (ELM) and Least Squares Support Vector Machine (LS-SVM). In this case study, the models were investigated using hyperspec- tral images as input in order to classify disease stages with effective wavelengths, texture features, and data fusion, respectively. The performance of chemometric models with data fusion gave better results, with classification accuracies of calibration and prediction all above 80%, compared with those only using effective wavelengths or texture features. A high accuracy was achieved by RF (93.33%), BPNN (95.00%), LS-SVM (96.67%), and ELM (90.00%), while slightly lower results were obtained by PLS-DA (81.67%) and SVM (88.33%).
In the present section, we discuss the plant and crop disease predictions carried out through data analysis techniques, which fall into three computer areas known as AI, ML, and DL. The review considered 46 scientific papers, which predicted the onset of the disease at a pre-symptomatic (i.e., symptoms not visible to the naked eye) or at an early stage, which was done by adopting the methodology described in Section 2.1.
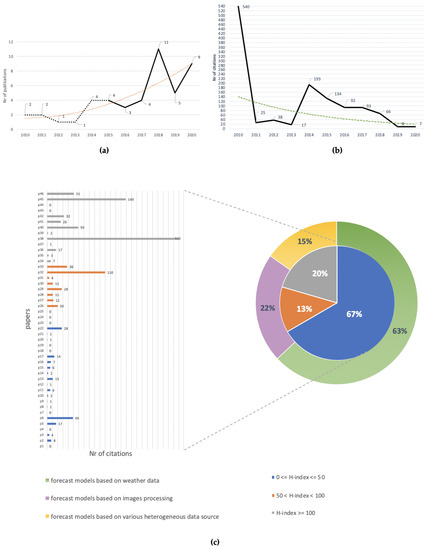
Figure 3a shows the trend line of publications. From 2010 to 2020, there was an incremental trend (orange line).The majority of the papers were published after 2015, indicating how recent this sub-domain is in agriculture. More precisely, 22% of papers from 2010 to 2015 excluded (dashed line) and 78% from 2015 to 2020 (solid line). Figure 3b shows the number of citations for each year considered. As can be seen, the resulting line does not show a uniform trend, with a maximum in 2010 and a minimum between 2011–2013. However, to better understand this trend, it is necessary to evaluate the impact index of the conference proceedings and journals. To this end, a bar graph was constructed (Figure 3c) which shows the number of citations for each paper, with works grouped according to the journal’s H-index. Three clusters were identified: 0 ≤ H-Index ≤ 50 (blue), 50 < H-Index < 100 (orange), H-Index ≥ 100 (gray). The information relating to the citations was retrieved from the Google Scholar service, while the H-index was taken from the Scimago (https://www.scimagojr.com/) online service. The graph shows that 67% of publications were related to an impact index lower than 50, 13% to an impact index between 50 and 100 and the remaining 20% to an impact index higher than 100. Therefore, the graph shows that the number of citations is closely linked to how often the conference proceedings/journal is consulted.
Our study shows that the approaches used in the literature to tackle the problem under examination can be divided into three categories: forecast models based on weather data (the first category), forecast models based on image processing (the second category), and forecast models based on distinct types of data coming from various heterogeneous sources (the third category). The first and second categories are the most explored, with an adoption rate of 63% and 22%, against 15% for the third category (see Figure 3c). Generally, RMs, ANNs, SVMs, and CNNs are the most used techniques. Due to the high heterogeneity of the experimental conditions (i.e., approaches, datasets, parameters, and performance metrics), it is difficult—if not unreliable—to perform a systematic comparison of the performance of each paper. Therefore, our comparisons are strictly limited to the techniques used in each paper. Taking these factors into account, we observe that the SVM and SVR when applied to the first category of models outperform ANNs and traditional regression models. As underlined by the various studies, the advantage given by the use of the SVM lies in its good ability to learn the representations of data in non-linear problems, with large dimensions and small samples. Likewise, the ANNs were favored for their ability to learn representations from past events to predict the future probability of occurrence of an event based on the conducive condition. The main obstacles encountered by the studies of the first category that used these techniques concerned the reduced size and imbalance of the classes in the dataset as well as overfitting. These problems had a major impact on the ANNs [59]. In fact, performance was limited by their trend of requiring more time and more data for training. Another disadvantage shown by the analyzed works that unites both techniques relates to the concept of the “black box”. The relationship between input and output is difficult to explain and derive. As indicated by Gu et al. [47], the purpose of SVR is to make predictions rather than to provide explanations. Therefore, there are limitations in explaining the effects that variables have on other variables. Although SVM showed superior performance in weather-based classification and regression problems, it did not perform as well in terms of image processing methodology.
Models belonging to this category conducted spectral analysis using optical and thermal remote sensing images as well as multispectral and hyperspectral images. The multispectral images were found to be relevant for the detection of the disease at an early stage, as demonstrated in [38]. Besides this, the hyperspectral images most used by the studies reviewed (six papers) allowed the prediction of disease in a presymptomatic stage; i.e., even before the symptom was visible to the naked eye. This difference is due to the spectral resolution used by the two remote sensing technologies. Multispectral imaging collects spectral signals in a few discrete bands, each spanning a broad spectral range from tens to hundreds of nanometers. In contrast, hyperspectral imaging detects spectral signals in a series of continuous channels with a narrow spectral bandwidth (e.g., typically below 10 nm); therefore, it can capture fine-scale spectral features of targets that otherwise could be compromised [30]. Multispectral images compared to hyperspectral images provide less data complexity and information content [85]. However, the analysis of hyperspectral images brings with it various limitations. Several authors underlined the high dimensionality of the data as being among the difficulties encountered. As Mahlein et al. [85] pointed out, the high degree of inter-band correlation results in information redundancy, which can cause convergence instability in the multivariate prediction models. Therefore, most papers focused a great deal of effort on identifying the effective wavelengths for the extraction of the target properties; i.e., the visible patterns in the spectrum that characterize a healthy leaf from a pre-symptomatic diseased leaf. Image resolution also affects model performance. Zhang et al. [37] crossed weather data with MODIS images. The authors observed that the forecasting accuracy was affected by restricting the spatial resolution and imaging quality of optical remote sensing images.
From the results obtained in the literature, we infer that remote sensing data represent a wealth of information that is useful for the development of autonomous non-invasive systems for the prediction of biotic and abiotic stress in plants. In this context, recent Deep Learning models, such as CNNs, seem capable of properly addressing many of the technical challenges related to perceptual problems, as seen in other use cases; e.g., yield prediction [16], land cover classification [86], and plant and weed recognition [87]. In particular, spectral images can be an aid to conventional adversity management techniques that are often time-consuming, destructive, expensive, and impractical. An ideal system approach requires precision, speed, and non-destructive practices.
In general, the studies of the first and second categories show that the exclusive use of a single data source is not sufficient to build models capable of capturing and predicting the variability of a disease in the field. To increase the stability and generalization capabilities of the algorithms, several authors suggest the integration of multiple data sources, as well as the inclusion of more information such as plant age, cultivar, growth phase, and soil characteristics. In fact, the results obtained from the third category of models confirm this. Zhang et al. [67], by combining meteorological data with remote sensing data, recorded an increase in accuracy from 69% to 78%. Most works have focused on forecasting a disease by analyzing mainly meteorological parameters. Variables such as temperature, humidity, and precipitation emerge as the variables that contribute most to the onset of the disease. Each of these have different effects depending on the disease and the crop under examination. Rowlandson et al. [88] observed that leaf wetness, together with the variables mentioned above, is a parameter that should not be neglected. The authors pointed out that the analysis of leaf wetness periods of a specific time duration is necessary, as this variable interacts with the propagule germination of most phytopathogens. Badnakhe et al. [70] demonstrated that soil temperature plays a crucial role in gummosis disease prediction.
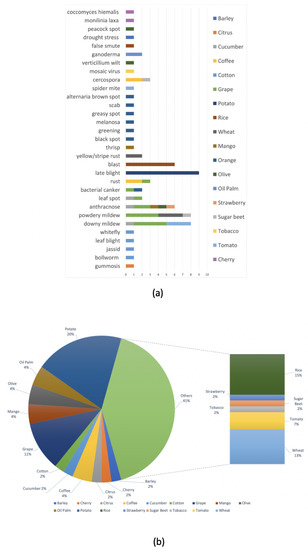
As Section 2.3.3 illustrates, a large variety of algorithms and techniques have been employed to predict the occurrence or severity of diseases affecting different crops and plants. From these, we observed that many scientific contributions focused on predicting the main diseases affecting rice, wheat, and potato crops such as late blight [3,20], powdery mildew [37,67,68], downy mildew, and blast [46,48,55], as shown in Figure 4a,b.
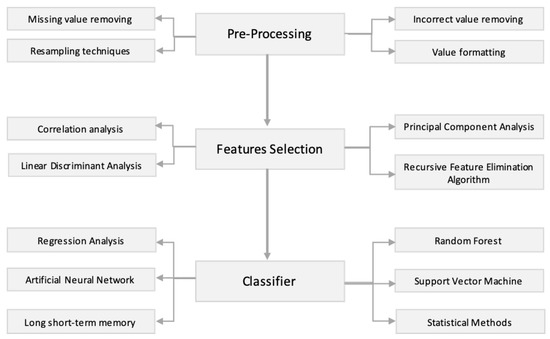
Overall, related to the approaches adopted by the works surveyed, we can generalize that a prediction model for plant and crop disease should consist of three mandatory steps: pre-processing, feature selection, and classification. The flow diagram of our survey is shown in Figure 5.
The Support Vector Machine, followed by the Artificial Neural Network and Random Forest, were the most employed techniques. Nevertheless, although te aforementioned techniques and others produced promising results, a restricted number of studies tested their solutions in different datasets. This underlying trend may be influenced by the restricted availability of open-data. To obtain available weather and environmental parameters, a large number of studies relied on third-party organizations, such as national/regional governmental services. Only a restricted number of these works gathered data with their own on-field IoT networks. According to Kamilaris et al. [15], more big data repositories should become publicly available.
Furthermore, we noticed that there is a shortage of model validation in real-world scenarios. Appropriate validation is needed for studies to have an accurate and broad impact. This can be inferred from the fact that such studies require an extensive observation time as well as requiring the involvement of human resources with different expertise.
4. Conclusions
In this paper, we performed an analysis and classification of forecasting models for plant and crop disease over the past 10 years (2010–2020). Forty-six research works were identified and reviewed, with an examination of the approaches adopted as well as the pre-processing techniques and data used. Issues and concerns were discussed in Section 2.4.
As we have seen in this study, the prediction of plant and crop disease is a complex problem to be solved due to the interaction of several environmental and climatic factors. Over the last 10 years, the literature has presented considerable advancements in understanding these dynamic processes by adopting different scientific approaches. As we observed, the problem under study requires high-quality, labeled data. However, the lack of open data is slowing the advance of knowledge in this agricultural sub-domain.
Indeed, regarding the state of the art, only a limited number of contributions has been presented in the literature from 2010 to today. The majority of these have focused on few pathogens and crops; furthermore, only a few of these have considered data from various heterogeneous sources to predict disease occurrence. These gaps are hindering progress in achieving development goals and creating products that are able to face realworld scenarios, and so more effort is required in data collection and in developing novel solutions to prevent and mitigate the impact of crop and plant disease to food production, especially for those crops which represent staple foods for millions of people who live in the least developed countries.


