News and Events
More >>
Ongoing
20 Mar 2024
Today, we are thrilled to announce the launch of our professional video production services.
Do you find yourself admiring the professionally crafted video abstracts in your colleagues' articles? Are you eager to showcase your own cutting-edge research to a broader audience? Do you face challenges in effectively conveying complex knowledge to students in a dynamic and visually appealing way?
Now, Encyclopedia MDPI offers all users a complimentary trial to bring your research or knowledge to life! During this stage of testing, our service is completely free. We prioritize user experience and feedback over revenue. Click the following link to apply:
https://encyclopedia.pub/video_material
Notes:
1. For video production inquiries, kindly provide us with your email address and name in the application form. Upon clicking the "submit" button, our team will promptly reach out to you.
2. We also provide free script-writing service for those who are pressed for time. Simply provide us with your requirements, and we will handle the script development process. Rest assured, you will have the opportunity to review and provide feedback at each stage of the script and video creation process.
3. To access our extensive library of example videos, please navigate to the Encyclopedia Video Section.
Journal Encyclopedia
More >>
Peer Reviewed
Encyclopedia 2024, 4(2), 682-694; https://doi.org/10.3390/encyclopedia4020042
Peer Reviewed
Encyclopedia 2024, 4(2), 672-681; https://doi.org/10.3390/encyclopedia4020041
Encyclopedia 2024, 4(2), 630-671; https://doi.org/10.3390/encyclopedia4020040
Featured Images
More >>
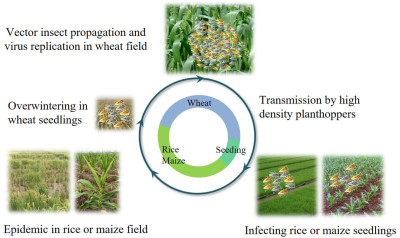
Nan Wu, Lu Zhang, Yingdang Ren, and Xifeng Wang
- 25 Jan 2024
See what people are saying about us
Hicham Wahnou
I've found your platform to be an ideal space for sharing knowledge and illustrations within the scientific community. Encyclopedia MDPI has been overwhelmingly positive, primarily because of its user-friendly interface, the wide array of subjects it covers, and the engaging events.
Hassan II University
Patricia Jovičević-Klug
I am really impressed by the final video (produced by Encyclopedia Video team). I was a little bit worried about what the final video would be like, because of the topic, but you made the magic come true again with this video.
Department of Interface Chemistry and Surface Engineering, Max-Planck-Institute for Iron Research, Max-Planck-Str. 1, 40237 Düsseldorf, Germany
Bjørn Grinde
I believe research should be brought to the public and that videos are important for getting there. A warm thanks to Encyclopedia for making it happen and to the video crew for doing an excellent job.
Division of Physical and Mental Health, Norwegian Institute of Public Health, Oslo, Norway
Patricia Takako Endo
I have followed up the Encyclopedia initiative and I think it is a good alternative where researchers can share their works and results with the community.
Programa de Pós-Graduação em Engenharia da Computação Pernambuco, Universidade de Pernambuco, Brazil
Sandro Serpa
With the precious and indispensable active participation of scholars from all over the world, in articulation with the Editorial Office Team, will certainly continue to give a positive response to the new challenges emerging.
Department of Sociology, Faculty of Social and Human Sciences, University of the Azores, Portugal
Hsiang-Ning Luk
I received a feedback from a particular reader and now we intend to collaborate on a paper together. I appreciate the MDPI provides such a good platform to make it happen.
Department of Anesthesia, Hualien Tzu-Chi Hospital, Hualien, Taiwan
Melvin R. Pete Hayden
Thank the video production crew for making such a wonderful video. The narrations have been significantly added to the video! Congratulations on such an outstanding job of Encyclopedia Video team.
University of Missouri School of Medicine, United States
 Encyclopedia


