Submitted Successfully!
To reward your contribution, here is a gift for you: A free trial for our video production service.
Thank you for your contribution! You can also upload a video entry or images related to this topic.
Version Summary Created by Modification Content Size Created at Operation
1 + 2765 word(s) 2765 2021-09-22 08:22:11

Video Upload Options

Do you have a full video?

Confirm

Are you sure to Delete?
Cite
If you have any further questions, please contact Encyclopedia Editorial Office.
Capitain, C. GC-IMS. Encyclopedia. Available online: https://encyclopedia.pub/entry/15702 (accessed on 24 April 2024).
Capitain C. GC-IMS. Encyclopedia. Available at: https://encyclopedia.pub/entry/15702. Accessed April 24, 2024.
Capitain, Charlotte. "GC-IMS" Encyclopedia, https://encyclopedia.pub/entry/15702 (accessed April 24, 2024).
Capitain, C. (2021, November 03). GC-IMS. In Encyclopedia. https://encyclopedia.pub/entry/15702
Capitain, Charlotte. "GC-IMS." Encyclopedia. Web. 03 November, 2021.
GC-IMS
Edit

Gas chromatography-ion mobility spectrometry (GC-IMS) is a powerful technique for the separation and sensitive detection of volatile organic compounds (VOCs). It is a rapid, robust and easy-to-handle technique, which has recently gained attention for targeted as well as non-targeted screening (NTS) approaches. In this article, the general working principles of GC-IMS are presented.

gas chromatography ion mobility spectroscopy (GC-IMS) volatile organic compounds (VOCs) non-targeted screening (NTS) using machine learning

1. Introduction

Quality control and early detection of hazard chemicals, allergens, or biological contaminants are a critical measure to ensure product safety. Environmental pollutants, pesticides, or toxins, among others, can compromise food safety and pose a public health risk [1]. Furthermore, food adulteration and food fraud, accelerated by globalization, continue to cause economic losses and customer dissatisfaction and emphasize the need for robust, inexpensive, and fast analytical methods [2]. Due to the inherent diversity of biogenic samples, as observed in food analysis, and the chemical complexity of the sample matrices, analytical approaches covering a multitude of parameters in parallel paired with strong discrimination power are required [3]. Analysis of the volatile organic compounds (VOCs) of samples, also known as VOC profiling, allows for the detection of compounds in complex sample matrices without the need for detailed a priori knowledge of the molecular composition. Furthermore, VOC profiling can be performed without advanced sample preparation and without the need for detailed knowledge of the molecular composition. Gas chromatography-mass spectrometry (GC-MS) is commonly used for VOC analysis, however, typically requires specific laboratory infrastructure, such as helium gas supply and vacuum technology. As an alternative with significantly less demand on infrastructure, ion mobility spectrometry (IMS) has gained more and more popularity over the last years. Due to its high sensitivity and resolving power on the one hand and its simplicity and robustness on the other, IMS has become a powerful tool for VOC based trace analyses [4]. Moreover, gas chromatography coupled to ion mobility spectroscopy (GC-IMS) has been shown to be an easy-to-handle and yet highly effective tool for VOC profiling [5]. The complexity of biological samples results from the presence of a variety of compounds, which in their entirety provide a characteristic GC-IMS spectrum, often referred to as the VOC profile or “fingerprint” [1][2]. Due to the large amount of data obtained by VOC profiling based on GC-IMS, machine learning tools are required for data analysis. In literature, these are often differentiated into targeted screening and non-targeted screening (NTS) approaches. In short, targeted analysis is based on defining specific markers before analysis, while NTS of GC-IMS data usually does not require prior knowledge and the entire spectral fingerprint is subject to data analysis.

2. Operating principles of IMS

Since the 1970s, when IMS was first known as ‘plasma chromatography’, IMS has developed into a highly sensitive technique for the analysis of VOCs at ultra trace concentration levels, which accounts for additional information regarding the ion’s mobility [6][7][8]. Due to the robust and easy-to-handle instrumentation, a wide range of application fields have been found for IMS today, such as food flavor analysis [4], process monitoring [9][10], and quality control [11], as well as detection and quantification of warfare agents [12] and explosives [13][14].

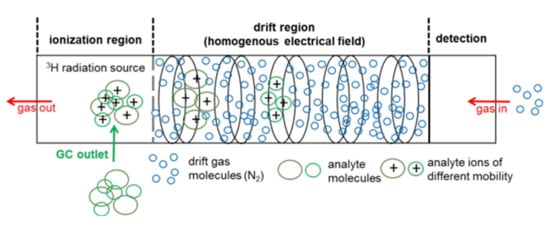
With IMS, analytes are first ionized in the ionization region of the instrument. The most common ionization method is the atmospheric pressure chemical ionization [15] by beta emitters, such as nickel-63 [3][4][5][6] or the less hazardous beta-emitting tritium [7], or alpha-emitting americium-241 [8][9]. Other ionization methods are atmospheric pressure photo ionization (APPI) [10], corona discharge (CD) atmospheric pressure chemical ionization [1][2][5][11], or laser desorption/ionization technique (LDI) [12].

According to the European Union directive, the exemption limit for the total activity of ionization sources was set to 1 GBq [16]. Therefore, the usage of low-radiation tritium ion sources with an activity of 300 MBq or less is not subject to authorization, hence leading to a broad adoption of tritium ion sources in a number of commercially available systems on the market [17][18][19][20][21]. Beta particles, which are emitted by the tritium source, initiate a gas-phase reaction cascade of the drift gas (nitrogen or air), resulting in predominant proton-water clusters H+[H2O]n, which are commonly referred to as ‘reactant ions’ [22]. The number of water molecules (n) depends on the gas temperature and the moisture content of the gas atmosphere [7]. Depending on the proton affinity, molecules entering the ionization region react with the reactant ions to protonated monomers MH+[H2O]n‑x, which leads to an intensity decrease of the reactant ion peak (RIP). At higher analyte concentrations, proton-bound dimers M2H+[H2O]m‑x are formed by the attachment of additional analyte molecules. When the concentration further increases, the formation of higher molecular cluster ions, such as trimers or tetramers, is possible; however, due to their low stability and short lifetime, higher molecular cluster ions are rarely observed [23]. In general, nonlinear behaviors are observed for the ratio of the RIP and the distribution between the protonated monomer and the proton-bound dimer [23][24]. The principles of a drift-time IMS including a tritium ionization source are shown in Figure 1 .

Figure 1. Setup of a drift-time IMS with a tritium (H-3) ionization source, adopted from [25] with permission (ID5138730886281).

After ionization, the analyte ions are transferred into the drift region through a gating mechanism based on a charged electrode. For precise control of the ion pulse width admitted into the drift tube, complex gating systems, such as Bradbury-Nielsen or field switching shutters are employed [13]. In the drift tube, ions are accelerated towards the detector, a Faraday plate, and subsequently separated by their drift time (or mobility) in an electrical field at ambient pressure. The ions are slowed down by collision with counter flowing drift gas molecules in the collision cross section (CCS). The equilibrium of the acceleration by an electric field and deceleration by collision with the drift gas molecules results in ions to move with a constant velocity towards the detector. Depending on mass, charge and spatial structure, the ions are separated in the drift tube and reach the detector at different drift times [8]. The drift time may be used to calculate the reduced ion mobility K0 via the Mason-Schamb equation [9].

To avoid clustering in the ionization or drift region, IMS devices are commonly hyphenated to chromatographic techniques, such as liquid chromatography (LC) or gas chromatography (GC). Column separation coupled to drift time IMS separates analytes into two orthogonal “features”, the retention time through chromatography and following, drift time or mobility through IMS, resulting in a highly resolved, two dimensional (2D) GC-IMS spectrum [10][14]. While hyphenation to LC is still more challenging, mainly due to the high dependence on sample preparation as a critical step for the data quality [26], GC-based IMS is typically easier to realize, mainly due to fact that the mobile phase is nearly inert. In particular, headspace (HS)-based techniques allow for the analysis of nearly untreated samples, which reduces the need for time-consuming sample pre-treatment steps [27] and furthermore, minimizes formation of handling-associated artifacts.

3. Targeted screening approaches and GC-IMS

To address the large amount of data obtained by GC-IMS measurements, specific markers may be selected prior to data analysis. As prior knowledge is often included in the selection process, this strategy is commonly referred to as targeted screening. The markers used for targeted screening can be either handpicked or mathematically determined [20][28]. One-way analysis of variance (ANOVA), using for example a Tukey’s test, is often applied to identify volatile compounds which exhibit significant differences, commonly quantified at a 5% significance level (p ≤ 0.05) [29]. Various other methods, such as Gabor filters, local binary pattern, Haar, and histograms of oriented gradients (HOG), have been proposed for feature extraction [30][31]. Chen and coworkers applied MPCA and HOG for feature extraction and data reduction of multicapillary column (MCC)-IMS data, with subsequent canonical discriminant analysis for the generation of nonlinear boundaries, for the successful quantification of the adulteration degree of canola oil. A predictive accuracy of more than 95.2% was reported for a partial least squares model, which was obtained using a train–test split of 70 to 30 [32]. Using targeted approaches and applying principal component analysis together with a k-nearest neighbors classifier (PCA-kNN), the same authors reported a successful classification of rapeseed oils according to their quality (grade 1–4) and a successful determination of vegetable oil according to its botanical origin (sesame oil, canola oil, and camellia oil). For the classification of the canola oil quality, the colorized differences method was applied to capillary column (CC)-IMS data, resulting in 34 peaks of interest and a predictive accuracy of 100% [33]. Furthermore, Otsu’s method and colorized differences method was used for automatic peak detection, resulting in 88 peaks of interest and a predictive accuracy of 98.3% for the classification of vegetable oil using MCC-IMS data [34]. The advantage of preselecting markers with significant differences is the simultaneous reduction of noise in the data, which, however, includes the risk of overlooking valuable information. Still, a targeted approach might be preferable in cases where the identification and quantitation of few marker compounds is sufficient to characterize a product in its quality or state.

4. NTS approaches and GC-IMS

Targeted screening approaches, which focus on the detection, identification and quantitation of a particular compound or class of compounds, may lack the ability to detect anomalies in form of new or unknown compounds. However, new scientific findings continuously identify potential hazardous or allergenic compounds [35]. Therefore, for systematic monitoring of product quality, it is therefore desirable to develop analytical methods capable of highlighting unknown or non-targeted compounds from the complex sample matrices. This approach, also referred to as NTS, requires comprehensive extraction and analysis of potential compounds of interest.

NTS aims to identify the compounds of unknown molecular composition. Similar to targeted approaches, the workflow for NTS generally consists of sample preparation, instrumental analysis, and post acquisition data processing [36]. A detailed overview about the NTS-Workflow using GC-IMS is described by Capitain and Weller (2021) [37]. The first step, data acquisition, involves sample preparation and subsequent extraction and separation of VOCs. Since little or no a priori knowledge of the chemical structures and behavior of compounds is required, NTS approaches benefit from gentle sample preparation, robust instrumental analysis, and standardized data processing. The collected data are then preprocessed and analyzed in the data-processing step. Since no pre-existing knowledge is used, the entire spectral fingerprint obtained by HS-GC-IMS analysis is subject to data analysis and classification or quantification models being built using machine learning tools. Exploratory methods, such as principal component analysis (PCA) are often used  for data reduction and pattern recognition [38]. The information extracted from a data matrix is explained by principal components (PCs), which are orthogonal (i.e. mathematically independent) to each other. Since PCA models are predicted without labels or validation by test data, they are generally considered unsupervised. Unsupervised statistical methods are exploratory methods that can be used to study data structures and search for clusters of samples [39]. Hierarchical cluster analysis (HCA) of PCA models in a tree-like diagram (dendrogram) is, e.g. used for the visualization of multivariate association and sample similarities [40]. An extension of PCA for processing three-dimensional (3D) data is provided by multiway principal component analysis (MPCA) [41], which has been applied for the feature extraction of GC-IMS matrices, without prior transformation of the 2D data [32].

Compared to unsupervised techniques, which provide predictions without labels or target variables, supervised techniques aim to build models able to predict target variables. In supervised learning, several data points or samples are described using predictor variables or features and target variables. For classification tasks, the scores obtained by the unsupervised exploratory analysis are combined with subsequent supervised pattern recognition techniques to distinguish samples according to defined categories. Among PCA-based qualitative methods are linear discriminant analysis (LDA) and k-nearest neighbors (kNN). Whereas PCA-LDA maximizes the interclass variance, kNN assigns the category most common among the k-nearest neighbors. The downside of using PCA-based methods is that the correlation between dependent and independent variables are not considered during PCA analysis, which can result in the loss of information included in higher PCs [38]. An alternative is provided by partial least squares (PLS), where the scores are calculated by considering the relationship between the independent and dependent variables.

For quantification tasks, partial least squares regression (PLSR) has become the standard method used in chemometrics, including the fields of sensorial analysis in food chemistry [38][42]. PLSR is used to describe the relationship between two data matrices, X (experimental data) and Y (actual concentrations), which are decomposed into X = TPT + E und Y = UQT + F, by finding the maximum covariance and linear relationship between the score matrices T and U. One limitation to PLSR is the typically lower performance on nonlinear and heteroscedastic data, as is partially the case for IMS data. Several studies have analyzed nonlinear IMS data [6][25]. Nonlinear relationships between the matrices T and U can be described by kernel PLSR (also known as nonlinear PLSR), where the data are transformed into higher-dimensional spaces using the kernel trick [43].

In the final step of NTS, model interpretation, key compounds are identified, which can be extracted through back projection of loadings. Due to the complexity of biological matrices, the substance identification with GC-IMS data alone can be challenging, which is why stand-alone IMS are rarely used to investigate the sample composition. Complementary techniques, such as GC-MS  [44] or 1H NMR [45], are often used to provide further insight into sample composition and to identify decisive marker substances [46]. Lastly, the model coherency is evaluated and finally applied for benchtop profiling.

A plethora of studies have shown the potential of HS-GC-IMS in combination with NTS for monitoring food quality or confirmation of geographical or botanical origin, despite the complexity of the samples. For example, HS-GC-IMS with NTS has been widely applied for the classification of olive oil between high-priced type 1 extra-virgin olive oil (EVOO), medium-priced type 2 virgin olive oil (VOO or OO), and non-edible type 3 olive oil, also known as pomace olive oil (POO) or lampante (virgin) olive oil (L(V)OO) [19][20][47][48]. Furthermore, HS-GC-IMS with NTS was successfully used for reliable classification of geographical origins for both olive oil (EVOO) [21][49][50] and wine [17]. Moreover, HS-GC-IMS with NTS was applied for the classification of honey according to botanical origin [50][51][52], as well as for the detection and quantification of honey adulterated with sugar cane or corn syrups [53][54]. Recently, HS-GC-IMS with NTS has been applied to assess the freshness of food [55] and for the detection of mold formation on milled rice [56], peanut kernels [57], and wheat kernels [58].

5. Comparison of targeted strategies and NTS 

NTS approaches (spectral fingerprinting) have been directly compared to targeted approaches (extraction of specific markers) for the analysis of IMS data. Garrido-Delgado and coworkers compared targeted and NTS approaches for the classification of olive oil into EVOO, OO, and LVOO, using data obtained by MCC coupled to IMS [47]. A PCA-LDA model was used for data reduction and data clustering, followed by kNN (k = 3) for classification, obtaining a prediction percentage of 79% for the targeted strategy and 85% for NTS strategy. For the classification of olive oil harvested in 2014–15, Contreras and coworkers obtained a prediction percentage of 56.9% for the targeted strategy and 67.8% for the NTS strategy [20]. An improved prediction success was achieved for models built with olive oil samples from 2014–15 and 2015–16, obtaining 74.3% for the targeted strategy and 79.4% for the NTS, hence suggesting superior abilities of the NTS approach versus the selection of specific markers. By contrast, the authors also reported that a targeted model built with samples from the years 2014–15 (prediction success of 51.6%) was superior to the NTS approach (prediction success of 36.0%) when applied to the years 2015–16. Both models built with the data from the years 2014–15 show weak prediction abilities for the prediction of samples from the following year, revealing some fundamental challenges in data science: the predictive ability of a model is highly dependent on the number of samples as well as on the sample diversity. Both approaches include the risk of overfitting to a specific problem [20].

Arroyo-Manzanares and coworkers likewise obtained superior classification accuracy using HS-GC-IMS for a model based on a targeted marker selection (100%) compared to a model based on the whole spectral fingerprint (90%) for the distinction between dry-cured Iberian ham from pigs fattened on acorns and pasture or on feed [59]. However, the model based on marker selection was built using orthogonal PLS-DA, while kNN (k = 3) and PCA-LDA were used for the model based on spectral fingerprints; hence, the differences in the predictability of the models may result from the use of different mathematical tools and do not provide inferences about targeted and non-targeted approaches. Gu and coworkers by contrast obtained better classification results with the NTS versus a targeted approach for distinguishing between fungal infections of wheat kernels, as well as for the quantification of fungal colony counts [58]. In conclusion, NTS and targeted screening approaches are both effective tools for data analysis, with different challenges and application areas.

References

  1. Jackson, L.S. Chemical food safety issues in the United States: Past, present, and future. J. Agric. Food Chem. 2009, 57, 8161–8170.
  2. Moore, J.C.; Spink, J.; Lipp, M. Development and application of a database of food ingredient fraud and economically motivated adulteration from 1980 to 2010. J. Food Sci. 2012, 77, R118–R126.
  3. Vuckovic, D. Current trends and challenges in sample preparation for global metabolomics using liquid chromatography-mass spectrometry. Anal. Bioanal. Chem. 2012, 403, 1523–1548.
  4. Li, J.; Yuan, H.; Yao, Y.; Hua, J.; Yang, Y.; Dong, C.; Deng, Y.; Wang, J.; Li, H.; Jiang, Y.; et al. Rapid volatiles fingerprinting by dopant-assisted positive photoionization ion mobility spectrometry for discrimination and characterization of Green Tea aromas. Talanta 2019, 191, 39–45.
  5. Rodríguez-Maecker, R.; Vyhmeister, E.; Meisen, S.; Rosales Martinez, A.; Kuklya, A.; Telgheder, U. Identification of terpenes and essential oils by means of static headspace gas chromatography-ion mobility spectrometry. Anal. Bioanal. Chem. 2017, 409, 6595–6603.
  6. Cohen, G.; Rudnik, D.D.; Laloush, M.; Yakir, D.; Karpas, Z. A Novel Method for Determination of Histamine in Tuna Fish by Ion Mobility Spectrometry. Food Anal. Methods 2015, 8, 2376–2382.
  7. Borsdorf, H.; Eiceman, G.A. Ion Mobility Spectrometry: Principles and Applications. Appl. Spectrosc. Rev. 2006, 41, 323–375.
  8. Cumeras, R.; Figueras, E.; Davis, C.E.; Baumbach, J.I.; Gràcia, I. Review on ion mobility spectrometry. Part 2: Hyphenated methods and effects of experimental parameters. Analyst 2015, 140, 1391–1410.
  9. Schmidt, C.; Jaros, D.; Rohm, H. Ion Mobility Spectrometry as a Potential Tool for Flavor Control in Chocolate Manufacture. Foods 2019, 8, 460.
  10. Karpas, Z.; Guamán, A.V.; Calvo, D.; Pardo, A.; Marco, S. The potential of ion mobility spectrometry (IMS) for detection of 2,4,6-trichloroanisole (2,4,6-TCA) in wine. Talanta 2012, 93, 200–205.
  11. Tzschoppe, M.; Haase, H.; Höhnisch, M.; Jaros, D.; Rohm, H. Using ion mobility spectrometry for screening the autoxidation of peanuts. Food Control 2016, 64, 17–21.
  12. Rearden, P.; Harrington, P.B. Rapid screening of precursor and degradation products of chemical warfare agents in soil by solid-phase microextraction ion mobility spectrometry (SPME–IMS). Anal. Chim. Acta 2005, 545, 13–20.
  13. Cook, G.W.; LaPuma, P.T.; Hook, G.L.; Eckenrode, B.A. Using gas chromatography with ion mobility spectrometry to resolve explosive compounds in the presence of interferents. J. Forensic Sci. 2010, 55, 1582–1591.
  14. Zalewska, A.; Pawłowski, W.; Tomaszewski, W. Limits of detection of explosives as determined with IMS and field asymmetric IMS vapour detectors. Forensic Sci. Int. 2013, 226, 168–172.
  15. Council Directive 2013/59/Euratom of 5 December 2013 Laying Down Basic Safety Standards for Protection against the Dangers Arising from Exposure to Ionising Radiation. Off. J. Eur. Union 2013. Available online: https://eur-lex.europa.eu/legal-content/EN/TXT/HTML/?uri=CELEX:32013L0059&rid=6 (accessed on 14 May 2021).
  16. Chen, T.; Qi, X.; Chen, M.; Lu, D.; Chen, B. Discrimination of Chinese yellow wine from different origins based on flavor fingerprint. Acta Chromatogr. 2020, 32, 139–144.
  17. Zhu, W.; Benkwitz, F.; Kilmartin, P. Assessment of Sauvignon Blanc Aroma and Quality Gradings Based on Static Headspace-Gas Chromatography-Ion. Mobility Spectrometry (SHS-GC-IMS): Merging Analytical Chemistry with Machine Learning; Cambridge University Press & Assessment: Cambridge, UK, 2020.
  18. Garrido-Delgado, R.; Del Dobao-Prieto, M.M.; Arce, L.; Valcárcel, M. Determination of volatile compounds by GC-IMS to assign the quality of virgin olive oil. Food Chem. 2015, 187, 572–579.
  19. Del Contreras, M.M.; Jurado-Campos, N.; Arce, L.; Arroyo-Manzanares, N. A robustness study of calibration models for olive oil classification: Targeted and non-targeted fingerprint approaches based on GC-IMS. Food Chem. 2019, 288, 315–324.
  20. Gerhardt, N.; Birkenmeier, M.; Sanders, D.; Rohn, S.; Weller, P. Resolution-optimized headspace gas chromatography-ion mobility spectrometry (HS-GC-IMS) for non-targeted olive oil profiling. Anal. Bioanal. Chem. 2017, 409, 3933–3942.
  21. Griffin, G.W.; Dzidic, I.; Carroll, D.I.; Stillwell, R.N.; Horning, E.C. Ion mass assignments based on mobility measuremets. Validity of plasma chromatographic mass mobility correlations. Anal. Chem. 1973, 45, 1204–1209.
  22. Pomareda, V.; Guamán, A.V.; Mohammadnejad, M.; Calvo, D.; Pardo, A.; Marco, S. Multivariate curve resolution of nonlinear ion mobility spectra followed by multivariate nonlinear calibration for quantitative prediction. Chemom. Intell. Lab. Syst. 2012, 118, 219–229.
  23. Ewing, R.G.; Eiceman, G.A.; Stone, J. Proton-bound cluster ions in ion mobility spectrometry. Int. J. Mass Spectrom. 1999, 193, 57–68.
  24. Brendel, R.; Schwolow, S.; Rohn, S.; Weller, P. Comparison of PLSR, MCR-ALS and Kernel-PLSR for the quantification of allergenic fragrance compounds in complex cosmetic products based on nonlinear 2D GC-IMS data. Chemom. Intell. Lab. Syst. 2020, 205, 104128.
  25. Martín-Gómez, A.; Arroyo-Manzanares, N.; Rodríguez-Estévez, V.; Arce, L. Use of a non-destructive sampling method for characterization of Iberian cured ham breed and feeding regime using GC-IMS. Meat Sci. 2019, 152, 146–154.
  26. Garrido-Delgado, R.; Dobao-Prieto, M.M.; Arce, L.; Aguilar, J.; Cumplido, J.L.; Valcárcel, M. Ion mobility spectrometry versus classical physico-chemical analysis for assessing the shelf life of extra virgin olive oil according to container type and storage conditions. J. Agric. Food Chem. 2015, 63, 2179–2188.
  27. Chatterji, B.N. Feature Extraction Methods for Character Recognition. IETE Tech. Rev. 1986, 3, 9–22.
  28. Lowe, D.G. Distinctive Image Features from Scale-Invariant Keypoints. Int. J. Comput. Vis. 2004, 60, 91–110.
  29. Chen, T.; Chen, X.; Lu, D.; Chen, B. Detection of Adulteration in Canola Oil by Using GC-IMS and Chemometric Analysis. Int. J. Anal. Chem. 2018, 2018, 3160265.
  30. Chen, T.; Qi, X.; Chen, M.; Chen, B. Gas Chromatography-Ion Mobility Spectrometry Detection of Odor Fingerprint as Markers of Rapeseed Oil Refined Grade. J. Anal. Methods Chem. 2019, 2019, 3163204.
  31. Chen, T.; Qi, X.; Lu, D.; Chen, B. Gas chromatography-ion mobility spectrometric classification of vegetable oils based on digital image processing. Food Meas. 2019, 13, 1973–1979.
  32. Kessler, W. Multivariate Datenanalyse: Für die Pharma-, bio- und Prozessanalytik: Ien Lehrbuch; Wiley-VCH: Weinheim, Germany, 2007.
  33. Maimon, O.; Rokach, L. Data Mining and Knowledge Discovery Handbook; Springer: New York, NY, USA, 2005.
  34. Granato, D.; Santos, J.S.; Escher, G.B.; Ferreira, B.L.; Maggio, R.M. Use of principal component analysis (PCA) and hierarchical cluster analysis (HCA) for multivariate association between bioactive compounds and functional properties in foods: A critical perspective. Trends Food Sci. Technol. 2018, 72, 83–90.
  35. Wold, S.; Geladi, P.; Esbensen, K.; Öhman, J. Multi-way principal components-and PLS-analysis. J. Chemom. 1987, 1, 41–56.
  36. Rosipal, R. Nonlinear Partial Least Squares An Overview. In Chemoinformatics and Advanced Machine Learning Perspectives; Lodhi, H., Yamanishi, Y., Eds.; IGI Global: Hershey, PA, USA, 2011; pp. 169–189.
  37. Tang, Z.-S.; Zeng, X.-A.; Brennan, M.A.; Han, Z.; Niu, D.; Huo, Y. Characterization of aroma profile and characteristic aromas during lychee wine fermentation. J. Food Process. Preserv. 2019, 43, e14003.
  38. Gerhardt, N.; Birkenmeier, M.; Kuballa, T.; Ohmenhaeuser, M.; Rohn, S.; Weller, P. Differentiation of the botanical origin of honeys by fast, non-targeted 1H-NMR profiling and chemometric tools as alternative authenticity screening tool. In Proceedings of the XIII International Conference on the Applications of Magnetic Resonance in Food Science, Karlsruhe, Germany, 7–10 June 2016; IM Publications: Charlton, UK, 2016; p. 33.
  39. Guo, Y.; Chen, D.; Dong, Y.; Ju, H.; Wu, C.; Lin, S. Characteristic volatiles fingerprints and changes of volatile compounds in fresh and dried Tricholoma matsutake Singer by HS-GC-IMS and HS-SPME-GC-MS. J. Chromatogr. B Anal. Technol. Biomed. Life Sci. 2018, 1099, 46–55.
  40. Garrido-Delgado, R.; Arce, L.; Valcárcel, M. Multi-capillary column-ion mobility spectrometry: A potential screening system to differentiate virgin olive oils. Anal. Bioanal. Chem. 2012, 402, 489–498.
  41. Gerhardt, N.; Schwolow, S.; Rohn, S.; Pérez-Cacho, P.R.; Galán-Soldevilla, H.; Arce, L.; Weller, P. Quality assessment of olive oils based on temperature-ramped HS-GC-IMS and sensory evaluation: Comparison of different processing approaches by LDA, kNN, and SVM. Food Chem. 2019, 278, 720–728.
  42. Garrido-Delgado, R.; Mercader-Trejo, F.; Sielemann, S.; de Bruyn, W.; Arce, L.; Valcárcel, M. Direct classification of olive oils by using two types of ion mobility spectrometers. Anal. Chim. Acta 2011, 696, 108–115.
  43. Schwolow, S.; Gerhardt, N.; Rohn, S.; Weller, P. Data fusion of GC-IMS data and FT-MIR spectra for the authentication of olive oils and honeys-is it worth to go the extra mile? Anal. Bioanal. Chem. 2019, 411, 6005–6019.
  44. Gerhardt, N.; Birkenmeier, M.; Schwolow, S.; Rohn, S.; Weller, P. Volatile-Compound Fingerprinting by Headspace-Gas-Chromatography Ion-Mobility Spectrometry (HS-GC-IMS) as a Benchtop Alternative to 1H NMR Profiling for Assessment of the Authenticity of Honey. Anal. Chem. 2018, 90, 1777–1785.
  45. Wang, X.; Rogers, K.M.; Li, Y.; Yang, S.; Chen, L.; Zhou, J. Untargeted and Targeted Discrimination of Honey Collected by Apis cerana and Apis mellifera Based on Volatiles Using HS-GC-IMS and HS-SPME-GC-MS. J. Agric. Food Chem. 2019, 67, 12144–12152.
  46. Wang, X.; Yang, S.; He, J.; Chen, L.; Zhang, J.; Jin, Y.; Zhou, J.; Zhang, Y. A green triple-locked strategy based on volatile-compound imaging, chemometrics, and markers to discriminate winter honey and sapium honey using headspace gas chromatography-ion mobility spectrometry. Food Res. Int. 2019, 119, 960–967.
  47. Arroyo-Manzanares, N.; García-Nicolás, M.; Castell, A.; Campillo, N.; Viñas, P.; López-García, I.; Hernández-Córdoba, M. Untargeted headspace gas chromatography–Ion mobility spectrometry analysis for detection of adulterated honey. Talanta 2019, 205, 120123.
  48. Cavanna, D.; Zanardi, S.; Dall’Asta, C.; Suman, M. Ion mobility spectrometry coupled to gas chromatography: A rapid tool to assess eggs freshness. Food Chem. 2019, 271, 691–696.
  49. Gu, S.; Chen, W.; Wang, Z.; Wang, J.; Huo, Y. Rapid detection of Aspergillus spp. infection levels on milled rice by headspace-gas chromatography ion-mobility spectrometry (HS-GC-IMS) and E-nose. LWT 2020, 132, 109758.
  50. Gu, S.; Chen, W.; Wang, Z.; Wang, J. Rapid determination of potential aflatoxigenic fungi contamination on peanut kernels during storage by data fusion of HS-GC-IMS and fluorescence spectroscopy. Postharvest Biol. Technol. 2021, 171, 111361.
  51. Gu, S.; Wang, Z.; Chen, W.; Wang, J. Targeted versus Nontargeted Green Strategies Based on Headspace-Gas Chromatography-Ion Mobility Spectrometry Combined with Chemometrics for Rapid Detection of Fungal Contamination on Wheat Kernels. J. Agric. Food Chem. 2020, 68, 12719–12728.
  52. Arroyo-Manzanares, N.; Martín-Gómez, A.; Jurado-Campos, N.; Garrido-Delgado, R.; Arce, C.; Arce, L. Target vs spectral fingerprint data analysis of Iberian ham samples for avoiding labelling fraud using headspace–gas chromatography–ion mobility spectrometry. Food Chem. 2018, 246, 65–73.
  53. Kessler, W. Multivariate Datenanalyse: Für die Pharma-, bio- und Prozessanalytik: Ien Lehrbuch; Wiley-VCH: Weinheim, Germany, 2007.
  54. Maimon, O.; Rokach, L. Data Mining and Knowledge Discovery Handbook; Springer: New York, NY, USA, 2005.
  55. Granato, D.; Santos, J.S.; Escher, G.B.; Ferreira, B.L.; Maggio, R.M. Use of principal component analysis (PCA) and hierarchical cluster analysis (HCA) for multivariate association between bioactive compounds and functional properties in foods: A critical perspective. Trends Food Sci. Technol. 2018, 72, 83–90.
  56. Wold, S.; Geladi, P.; Esbensen, K.; Öhman, J. Multi-way principal components-and PLS-analysis. J. Chemom. 1987, 1, 41–56.
  57. Chen, T.; Chen, X.; Lu, D.; Chen, B. Detection of Adulteration in Canola Oil by Using GC-IMS and Chemometric Analysis. Int. J. Anal. Chem. 2018, 2018, 3160265.
  58. Bro, R. PARAFAC. Tutorial and applications. Chemom. Intell. Lab. Syst. 1997, 38, 149–171.
  59. Kroonenberg, P.M.; Ten Berge, J.M.F. The equivalence of Tucker3 and Parafac models with two components. Chemom. Intell. Lab. Syst. 2011, 106, 21–26.
  60. Rosipal, R. Nonlinear Partial Least Squares An Overview. In Chemoinformatics and Advanced Machine Learning Perspectives; Lodhi, H., Yamanishi, Y., Eds.; IGI Global: Hershey, PA, USA, 2011; pp. 169–189.
  61. Tang, Z.-S.; Zeng, X.-A.; Brennan, M.A.; Han, Z.; Niu, D.; Huo, Y. Characterization of aroma profile and characteristic aromas during lychee wine fermentation. J. Food Process. Preserv. 2019, 43, e14003.
  62. Gerhardt, N.; Birkenmeier, M.; Kuballa, T.; Ohmenhaeuser, M.; Rohn, S.; Weller, P. Differentiation of the botanical origin of honeys by fast, non-targeted 1H-NMR profiling and chemometric tools as alternative authenticity screening tool. In Proceedings of the XIII International Conference on the Applications of Magnetic Resonance in Food Science, Karlsruhe, Germany, 7–10 June 2016; IM Publications: Charlton, UK, 2016; p. 33.
  63. Guo, Y.; Chen, D.; Dong, Y.; Ju, H.; Wu, C.; Lin, S. Characteristic volatiles fingerprints and changes of volatile compounds in fresh and dried Tricholoma matsutake Singer by HS-GC-IMS and HS-SPME-GC-MS. J. Chromatogr. B Anal. Technol. Biomed. Life Sci. 2018, 1099, 46–55.
  64. Klein, L.A. Sensor and Data Fusion: A Tool for Information Assessment and Decision Making; SPIE Press: Bellingham, WA, USA, 2010.
  65. Borràs, E.; Ferré, J.; Boqué, R.; Mestres, M.; Aceña, L.; Busto, O. Data fusion methodologies for food and beverage authentication and quality assessment—a review. Anal. Chim. Acta 2015, 891, 1–14.
  66. Kuncheva, L.I. Combining Pattern Classifiers: Methods and Algorithms; John Wiley & Sons: New York, NY, USA, 2010.
  67. Martín-Gómez, A.; Arroyo-Manzanares, N.; Rodríguez-Estévez, V.; Arce, L. Use of a non-destructive sampling method for characterization of Iberian cured ham breed and feeding regime using GC-IMS. Meat Sci. 2019, 152, 146–154.
  68. Garrido-Delgado, R.; Dobao-Prieto, M.M.; Arce, L.; Aguilar, J.; Cumplido, J.L.; Valcárcel, M. Ion mobility spectrometry versus classical physico-chemical analysis for assessing the shelf life of extra virgin olive oil according to container type and storage conditions. J. Agric. Food Chem. 2015, 63, 2179–2188.
  69. Chatterji, B.N. Feature Extraction Methods for Character Recognition. IETE Tech. Rev. 1986, 3, 9–22.
  70. Lowe, D.G. Distinctive Image Features from Scale-Invariant Keypoints. Int. J. Comput. Vis. 2004, 60, 91–110.
  71. Chen, T.; Qi, X.; Chen, M.; Chen, B. Gas Chromatography-Ion Mobility Spectrometry Detection of Odor Fingerprint as Markers of Rapeseed Oil Refined Grade. J. Anal. Methods Chem. 2019, 2019, 3163204.
  72. Chen, T.; Qi, X.; Lu, D.; Chen, B. Gas chromatography-ion mobility spectrometric classification of vegetable oils based on digital image processing. Food Meas. 2019, 13, 1973–1979.
  73. Arroyo-Manzanares, N.; Martín-Gómez, A.; Jurado-Campos, N.; Garrido-Delgado, R.; Arce, C.; Arce, L. Target vs spectral fingerprint data analysis of Iberian ham samples for avoiding labelling fraud using headspace–gas chromatography–ion mobility spectrometry. Food Chem. 2018, 246, 65–73.
  74. Razieh Parchami; MahdiE Kamalabadi; Naader Alizadeh; Determination of biogenic amines in canned fish samples using head-space solid phase microextraction based on nanostructured polypyrrole fiber coupled to modified ionization region ion mobility spectrometry. Journal of Chromatography A 2017, 1481, 37-43, 10.1016/j.chroma.2016.12.046.
  75. Ali Sheibani; Mahmoud Tabrizchi; Hassan S. Ghaziaskar; Determination of aflatoxins B1 and B2 using ion mobility spectrometry. Talanta 2008, 75, 233-8, 10.1016/j.talanta.2007.11.006.
  76. Eiceman, GA, Karpas, Z. Ion Mobility Spectrometry ; Eiceman, GA, Karpas, Z, Eds.; CRC Press: Boca Raton, 2005; pp. 368.
  77. Christopher Browne; Thomas P. Forbes; Edward Sisco; Detection and identification of sugar alcohol sweeteners by ion mobility spectrometry. Analytical Methods 2016, 8, 5611-5618, 10.1039/c6ay01554a.
  78. Nathaly Reyes-Garcés; German Augusto Gómez-Ríos; Érica A. Souza Silva; Janusz Pawliszyn; Coupling needle trap devices with gas chromatography–ion mobility spectrometry detection as a simple approach for on-site quantitative analysis. Journal of Chromatography A 2013, 1300, 193-198, 10.1016/j.chroma.2013.05.042.
  79. Ching Wu; William F. Siems; Jr Herbert H. Hill; Rich M. Hannan; Analytical determination of nicotine in tobacco by supercritical fluid chromatography–ion mobility detection. Journal of Chromatography A 1998, 811, 157-161, 10.1016/s0021-9673(98)00223-4.
  80. Olavi Raatikainen; Ville Reinikainen; Pentti Minkkinen; Tiina Ritvanen; Petri Muje; Juha Pursiainen; Teri Hiltunen; Paula Hyvönen; Atte von Wright; Satu-Pia Reinikainen; et al. Multivariate modelling of fish freshness index based on ion mobility spectrometry measurements. Analytica Chimica Acta 2005, 544, 128-134, 10.1016/j.aca.2005.02.029.
  81. Kent B. Pfeifer; Arthur N. Rumpf; Measurement of Ion Swarm Distribution Functions in Miniature Low-Temperature Co−Fired Ceramic Ion Mobility Spectrometer Drift Tubes. Analytical Chemistry 2005, 77, 5215-5220, 10.1021/ac050149z.
  82. Seyed Mohammad Seyed Khademi; Ursula Telgheder; Younes Valadbeigi; Vahideh Ilbeigi; Mahmoud Tabrizchi; Direct detection of glyphosate in drinking water using corona-discharge ion mobility spectrometry: A theoretical and experimental study. International Journal of Mass Spectrometry 2019, 442, 29-34, 10.1016/j.ijms.2019.05.002.
  83. Jaakko Laakia; Alexey Adamov; Matti Jussila; Christian S. Pedersen; Alexey A. Sysoev; Tapio Kotiaho; Separation of different ion structures in atmospheric pressure photoionization-ion mobility spectrometry-mass spectrometry (APPI-IMS-MS). Journal of the American Society for Mass Spectrometry 2010, 21, 1565-1572, 10.1016/j.jasms.2010.04.018.
  84. Carsten Illenseer; Hans-Gerd Löhmannsröben; Investigation of ion–molecule collisions with laser-based ion mobility spectrometry. Physical Chemistry Chemical Physics 2001, 3, 2388-2393, 10.1039/b009880i.
  85. Norris E. Bradbury; Russell A. Nielsen; Absolute Values of the Electron Mobility in Hydrogen. Physical Review 1936, 49, 388-393, 10.1103/physrev.49.388.
  86. Wolfgang Vautz; Jörg Ingo Baumbach; Johannes Jung; Beer Fermentation Control Using Ion Mobility Spectrometry - Results of a Pilot Study. Journal of the Institute of Brewing 2006, 112, 157-164, 10.1002/j.2050-0416.2006.tb00245.x.
  87. Zeev Karpas; Applications of ion mobility spectrometry (IMS) in the field of foodomics. Food Research International 2013, 54, 1146-1151, 10.1016/j.foodres.2012.11.029.
  88. St. Sielemann; J. I. Baumbach; H. Schmidt; P. Pilzecker; Quantitative analysis of benzene, toluene, and m-xylene with the use of a UV-ion mobility spectrometer. Field Analytical Chemistry & Technology 2000, 4, 157-169, 10.1002/1520-6521(2000)4:4<157::aid-fact2>3.0.co;2-#.
  89. F.J. van de Brug; N.B. Lucas Luijckx; H.J. Cnossen; G.F. Houben; Early signals for emerging food safety risks: From past cases to future identification. Food Control 2014, 39, 75-86, 10.1016/j.foodcont.2013.10.038.
  90. J.-P. Antignac; F. Courant; G. Pinel; Emmanuelle Bichon; F. Monteau; C. Elliott; Bruno LE Bizec; Mass spectrometry-based metabolomics applied to the chemical safety of food. TrAC Trends in Analytical Chemistry 2011, 30, 292-301, 10.1016/j.trac.2010.11.003.
  91. Charlotte Capitain; Philipp Weller; Non-Targeted Screening Approaches for Profiling of Volatile Organic Compounds Based on Gas Chromatography-Ion Mobility Spectroscopy (GC-IMS) and Machine Learning. Molecules 2021, 26, 5457, 10.3390/molecules26185457.
  92. Svante Wold; Paul Geladi; Kim Esbensen; Jerker Öhman; Multi-way principal components-and PLS-analysis. Journal of Chemometrics 1987, 1, 41-56, 10.1002/cem.1180010107.
More
Information
Contributor MDPI registered users' name will be linked to their SciProfiles pages. To register with us, please refer to https://encyclopedia.pub/register :
View Times: 2.3K
Revision: 1 time (View History)
Update Date: 03 Nov 2021
1000/1000