In 2018, according to EUROSTAT, the estimated final energy consumption by the agricultural sector in EU-27, mainly due to direct fuel and electricity costs, was 27.251 million tons of oil equivalents (Mtoe, unit of energy describing energy content of all fuels when in a large scale), with the highest energy balances registered in France (4.089 Mtoe), Poland (3.918 Mtoe), Germany (3.342 Mtoe), the Netherlands (3.647), Italy (2.798 Mtoe), and Spain (2.458 Mtoe).
3. Consumption of Fertilizers in Traditional and in Organic Agriculture
Looking at the use of fertilizers in Italy as a measure of the amount of required nutrients for plants applied per unit of arable land, a significant decline was observed compared to twenty years ago (210.0 kg/ha in 1998 and 130.6 kg/ha in 2018). In the last decade it was always below the average of the European member states, which has settled at around 150 kg/ha in the last few years
[19]. Based on the dataset reported in
Table 2, Ireland represents the top EU fertilizer-using country, registering up to 1444.9 kg/ha in 2018, followed by Belgium, the Netherlands, and Slovenia, showing values close to 300 kg/ha. In the last twenty years, from 1998 to 2018, only a few EU countries (Denmark, Finland, Italy, the Netherlands, and Slovenia) showed a constant decline of fertilizer use every ten years. Some others (e.g., Belgium and Greece) showed a remarkable reduction in the middle, followed by an increase after ten years. Others (Ireland in particular, but also Bulgaria, Hungary, Latvia, Lithuania, Poland, Portugal, and Romania) showed an impressive increase which was related, at least partially, to the demand for higher agricultural production.
Table 2. Annual consumption of fertilizers z in kilogram per hectare (kg/ha) of agricultural land in the 27 member states of the European Union in 1998, 2008, and 2018.
| EU Member Country |
Consumption of Fertilizers (kg/ha) |
EU Member Country |
Consumption of Fertilizers (kg/ha) |
| 1998 |
2008 |
2018 |
1998 |
2008 |
2018 |
| Austria |
175.9 |
110.0 |
135.1 |
Italy |
210.0 |
143.5 |
130.6 |
| Belgium |
354.0 |
224.5 |
293.4 |
Latvia |
46.5 |
66.9 |
101.2 |
| Bulgaria |
47.8 |
111.2 |
126.9 |
Lithuania |
48.4 |
80.7 |
133.5 |
| Croatia |
162.0 |
495.2 |
221.0 |
Luxembourg |
267.5 y |
250.5 |
234.7 |
| Cyprus |
202.7 |
112.0 |
157.7 |
Malta |
187.4 |
74 |
167.8 |
| Czechia |
92.0 |
87.3 |
174.4 |
Netherlands |
535.3 |
267.7 |
265.9 |
| Denmark |
174.1 |
147.7 |
108.1 |
Poland |
110.8 |
157.7 |
177.6 |
| Estonia |
36.5 |
100.4 |
87.7 |
Portugal |
140.1 |
155.5 |
198.5 |
| Finland |
142.6 |
122.9 |
91.6 |
Romania |
38.6 |
45.6 |
59.2 |
| France |
264.1 |
152.4 |
172.7 |
Slovakia |
77.8 |
75.1 |
129.3 |
| Germany |
247.4 |
159.6 |
166.5 |
Slovenia |
445.3 |
279.8 |
261.8 |
| Greece |
169.5 |
119.1 |
133.3 |
Spain |
173.0 |
106.5 |
157.7 |
| Hungary |
76.9 |
96.7 |
150.7 |
Sweden |
105.7 |
99.0 |
100.4 |
| Ireland |
656.2 |
857.2 |
1544.9 |
|
|
|
|
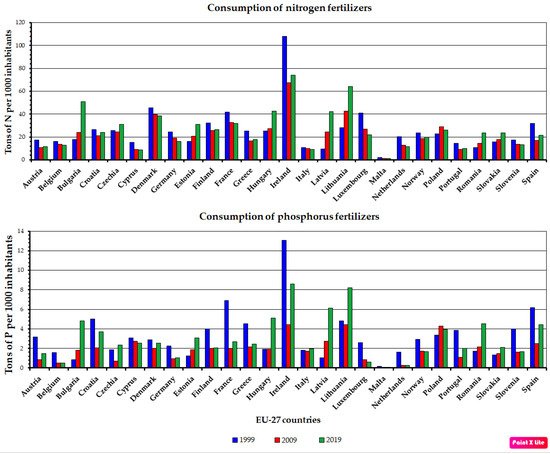
According to EUROSTAT, looking at the amounts of fertilizers spread over the EU countries by considering the sum of the total nitrogen and phosphorus, France, Germany, Spain, and Poland represent the EU member states spreading the largest fertilizer amounts to their land, with, respectively, 2.1, 1.3, 1.0, and 0.9 million tons of N, and 181.6, 87.8, 209.4, and 150.0 thousand tons of P, in 2019
[20]. The primacy of Ireland in the consumption of fertilizers is also evident when looking at the tons of nitrogen and the tons of phosphorus utilized for every 1000 inhabitants, respectively, 74 and 9 in 2019, showing a sharp decrease compared to twenty years earlier (
Figure 1).
Figure 1. Consumption of nitrogen and phosphorus fertilizer in the EU-27 members states in 1999 (blue bars), in 2009 (red bars), and in 2019 (green bars). Tons of N-based fertilizers expressed as tons of N consumed by 1000 inhabitants in the upper graph; tons of P-based fertilizers expressed as tons of P consumed by 1000 inhabitants in the lower graph. Data source: EUROSTAT (Datasets: “Consumption of inorganic fertilizers” [AEI_FM_USEFERT] and “Population on 1 January by age and sex” [DEMO_PJAN]).
The trends of N and P consumption by 1000 inhabitants with respect to more than twenty years ago in the European countries are represented in Figure 1. Here, each country showed a peculiar trend. In most cases, however, and when focusing particularly on 1999 and 2019, the trends were declining (except for several Eastern countries such as Bulgaria, Czechia, Estonia, Hungary, Latvia, Lithuania, Poland, Romania, and Slovakia). This evidence fits well with the increase in the agricultural demand and related land used occurring in these countries. Interestingly, similar trends can be observed for N and P fertilizers.
The limited or absent use of mineral fertilization represents the main feature of organic farming, and several organic farming systems are more energy efficient than their conventional counterparts (although there are some notable exceptions)
[21]. Consequently, there is still much to be done, and it is particularly recommended to improve fertilizer (N) management in organic production to ameliorate its energetic and economic performance
[22][23]. In 2019, Europe invested 8.5% of the utilized agricultural area (UAA) in organic farming, and is foreseen to increase in coming years. In this general scenario, Italy performed very well with 15.2% of the UAA in organic, and was the fourth country for the highest shares of organic land after Austria (25.3%), Estonia (22.3%), and Sweden (20.4%). Several major EU countries showed lower percentages of UAA under organic cultivation, including Ireland (1.6%), Bulgaria (2.3%), the Netherlands (3.7%), Norway (4.6%), and France and Germany (both with 7.7%)
[20][24].
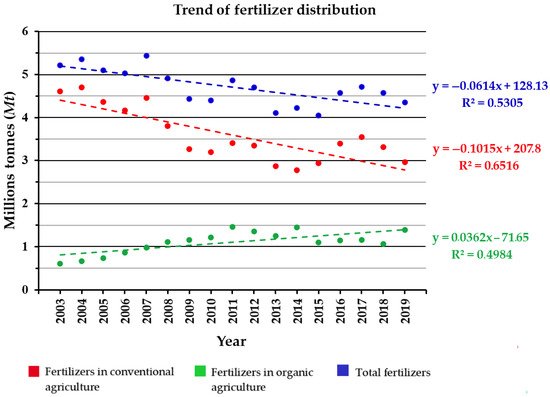
In Italy, the increase in organic agriculture is the major cause of the reduction of total fertilizer distribution, as can be noted in Figure 2, which shows the trend of fertilizer application in Italy from 2003 to 2019, referring to the amounts of fertilizers used in traditional and in organic agriculture, respectively.
Figure 2. Trends of the fertilizer distribution, in million tons of the main nutrient elements, in Italy from 2003 to 2019. The upper blue line is for total fertilizer consumption and is equivalent to the sum of all kinds of fertilizer products used in both conventional (red line) and organic (green line) agriculture. The equation and the R-square value of the linear regression trendlines are displayed on the right of the graph. Total fertilizers include all types of fertilizers reported in
Table 3. Data source: ISTAT (
https://www.istat.it/en/legal-notice (accessed on 20 June 2020)),
[25].
According to the Italian National Institute of Statistic (ISTAT), in 2019 more than 2.4 million tons of fertilizers were applied for agricultural use (or more than 4.5 million tons when including other products, such as amendments, correctives, growing substrates, and specific action products) (Table 3). The amount of mineral fertilizers was about 1.7 million tons. Of these, more than 65% were simple minerals (N, K, P) and more than 30% were more complex minerals. Organic farming use of mineral fertilizers mainly concerned those containing meso and micro-nutrients. In fact, these types of fertilizers applied more in organic farming than in traditional farming. It is worth noting that the total distribution of organic and organo-mineral fertilizers on Italian land was about 0.37 and 0.33 million tons, respectively, meaning that the 93% of total organic fertilizers and the 33% of total organo-mineral fertilizers were applied in organic farming (Table 3). From 2009 to 2019, the use of organic fertilizers in organic farming showed an increase of about 28%, while the use of amendments was just 7%.
Table 3. Use of the different types of fertilizers in Italy, in tons (t) of the main nutrient elements in 2009 and 2019.
| |
|
2009 |
2019 |
| Use in Conventional Agriculture |
Use in Organic Agriculture |
Total |
Use in Conventional Agriculture |
Use in Organic Agriculture |
Total |
| Fertilizers |
Mineral fertilizers |
Simple |
Nitrogen |
1,055,523 |
0 |
1,055,523 |
1,001,488 |
0 |
1,001,488 |
| Phosphate |
122,608 |
564 |
123,172 |
77,458 |
4184 |
81,642 |
| Potassic |
53,693 |
10,792 |
64,485 |
51,701 |
13,344 |
65,035 |
| Compound |
Binary |
386,801 |
2861 |
389,662 |
270,474 |
2936 |
273,410 |
| Ternary |
452,369 |
0 |
452,369 |
266,974 |
9265 |
276,239 |
| Containing meso-elements |
2082 |
3612 |
5693 |
592 |
4345 |
4937 |
| Micronutrient fertilizers |
2800 |
10,625 |
13,425 |
3581 |
9399 |
12,980 |
| Organic fertilizers |
14,172 |
269,992 |
284,164 |
23,823 |
345,758 |
369,581 |
| Organo-mineral fertilizers |
215,660 |
36,060 |
251,756 |
220,221 |
110,957 |
331,178 |
| TOTAL FERTILIZERS |
2,305,769 |
334,506 |
2,640,250 |
1,916,312 |
500,188 |
2,416,490 |
| Other products |
Amendments |
835,378 |
763,052 |
1,598,430 |
503,289 |
817,281 |
1,320,570 |
| Correctives |
122,723 |
65,683 |
188,405 |
352,509 |
58,254 |
410,763 |
| Growing substrates |
9607 |
0 |
9607 |
128,352 |
4663 |
133,015 |
| Specific action products |
1348 |
0 |
1675 |
54,947 |
9618 |
64,565 |
| TOTAL OTHER PRODUCTS |
969,056 |
828,735 |
1,798,117 |
1,039,097 |
889,816 |
1,928,913 |
| TOTAL FERTILIZERS & OTHER PRODUCTS |
3,274,800 |
1,163,240 |
4,438,040 |
2,955,409 |
1,389,994 |
4,345,403 |
Besides a wider adoption of organic farming strategies, the other main reasons leading to the reduction of fertilizer consumption in Italy are related to the rationalization of the use of chemical products in agriculture, as a consequence of the reception of the Council Directive 91/676/EEC (Nitrates Directive) by the Italian Legislative Decree 152/2006 (Environmental Protection Code). The diffusion of the model of bio-agriculture, which enhances the use of amendments (soil improvers), correctives, and sustainable renewable products at the expense of the conventional model of “chemical agriculture”, and the reduction of the UAA due to desertification and soil contamination, also contributed to this effect. The Italian National Research Council (CNR) estimates very high percentages of land undergoing or at risk of degradation, particularly in internal rural areas of Southern Italy (up to 70% in Sicily) due to heavy soil erosion. However, desertification represents a major threat that extensively affects the Mediterranean, Central, and Eastern European countries
[26].
The significant decrease in fertilizer consumption per hectare of cultivated land, in terms of UAA, that Italy has experienced over recent decades (see Table 2) is strongly related to the steady increase of the land area and the number of producers dedicated to the cultivation of organic goods (Table 4).
Table 4. Fertilizer distribution, Utilized Agricultural Area (UAA) and number of farms in conventional and in organic agriculture, in 2010, 2013, 2016, and 2017 in Italy. Total fertilizers include all types of fertilizers (see Table 4).
| |
Unit of Measure |
2010 |
2013 |
2016 |
2017 |
| Fertilizers in conventional agriculture |
Million tons of the main
nutrient/s (Mt) |
3.20 |
2.90 |
3.40 |
3.60 |
| Fertilizers in organic agriculture |
1.21 |
1.25 |
1.15 |
1.16 |
| Total fertilizers |
4.40 |
4.11 |
4.58 |
4.71 |
| UAA in conventional agriculture |
Hectares
(ha) |
12,856,048 |
12,425,996 |
12,598,161 |
12,777,044 |
| UAA in organic agriculture |
N.A. |
961,594 |
1,555,522 |
N.A. |
| Total (conventional + organic) UAA |
N.A. |
13,387,590 |
14,153,683 |
N.A. |
| Number of farms in conventional agriculture |
- |
N.A. |
1,471,185 |
1,145,705 |
N.A. |
| Number of farms in organic agriculture |
N.A. |
47,075 |
132,299 |
N.A. |
Previously, European Regulation No. 2003/2003 (
https://eur-lex.europa.eu/eli/reg/2003/2003/ (accessed on 20 June 2021)) defined the various mineral fertilizers, such as those that provide main nutrients, secondary nutrients, microelements, inhibitors, and calcination substances. In a different way, in Italy, national legislation (Legislative Decree 75/2010) regulates all categories of fertilizers, i.e., mineral fertilizers, organic fertilizers, organic-mineral fertilizers, soil amendments, corrective substances, substrates, and specific action products including biostimulants. The latter are generally extracts of algae, plant or animal hydrolysates, or mycorrhizae, which add substances to another fertilizer, soil or directly to the plant that assists the absorption of nutrients. Europe is, globally, the largest market for biostimulant products, which is dominated by Germany, followed by Spain and Italy, for innovative products as well as for constant investments in R&D (Assofertilizzanti, Federchimica). On 5 June 2019, a new EU Regulation 2019/1009 of the European Parliament
[27] was published to replace No. 2003/2003, specifying all categories of fertilizers at the EU level and introducing new limit values for contaminants, such as cadmium, permitted in each fertilizing product. Finally, this included fertilizers proceeding from recycled or organic materials (in line with a circular economic vision) and biostimulants (as products which enhance plant nutrition processes, independent of the product nutrient content), with the aim of improving properties such as nutrient use efficiency, tolerance to abiotic stress, quality traits, etc., embracing products based on microorganisms.
Regarding pesticides, these are substances that interfere, hinder, or destroy living organisms (microorganisms, animals, and plants), used in intensive industrial-agriculture, and include fungicides, insecticides, herbicides, etc. Pesticide use encompasses 2–4% of the total energy used in crop production
[28], and on average the manufacture of pesticides which is a highly complex process takes four to five times more energy per kg than N fertilizer production
[29]. Even though nowadays several alternative intervention and prevention techniques are available, pesticide employment in agriculture is still widespread, and laboratory analyses of fresh or processed fruit and vegetable samples often highlight quite high traces (residues) deriving from their use
[30]. Good Agricultural Practices (GAPs) should respect the maximum residue level (MRL, in mg/kg) for several pesticides in food commodities and animal feeds as established by the EU Commission.
The use of pesticides and, in general, of chemical products in agricultural soils also has a negative effect on soil biodiversity by altering faunistic and floristic ecosystems
[31]. Last but not least, pesticides disrupt soil biotic communities
[32][33].
In this complex framework, it is necessary to mention the practice of precision agriculture, with its wide range of new emerging technologies, that allow for precise fertilization based on in-field crop phenotypic performance
[34], as well as on soil properties
[35], which can be monitored in real-time, leading to notable savings in fertilizer application and an ensuing reduction of the environmental impact of NPK chemicals
[36].
As a perspective for agricultural fertilization at the global level, the demand for fertilizer use of nitrogen (N), phosphorus (P), and potassium (K) will reach more than 166 million tons in 2022, with an increase of about 9% with respect to 2016 (FAO, 2019;
[37]). In the European Union, changes in annual fertilizer consumption, forecast by Fertilizers Europe for the decade 2016–2026, are projected as -5.0% in nitrogen, +0.7% in phosphate, and +1.8% in potash. In Italy, in recent years, the trend of fertilizer consumption is showing a decrease in line with the increase in organic farming.
 +1 point