TATI, also known as pancreatic secretory trypsin inhibitor (PSTI) or serine peptidase inhibitor Kazal 1 type (SPINK1), is a trypsin inhibitor that functions mainly in the pancreas, where it serves as a suppressor of premature trypsinogen activation.
1. Introduction
The incidence of OPSCC has been increasing in recent years, particularly in Western countries
[1]. Although over 100,000 new cases of oropharyngeal cancers are diagnosed yearly worldwide, the majority is diagnosed in developed countries
[2][3]. Squamous cell carcinomas form over 90% of the newly diagnosed oropharyngeal cancers
[2][3][4][5][6]. The median overall 5-year survival in Finland is 64% among men and 70% among women
[7]. The most significant risk factors for OPSCC are smoking, heavy alcohol use, and HPV infection. Today, more than half of the new OPSCC cases are associated with HPV
[8] and HPV-positive OPSCC and HPV-negative OPSCC are considered as separate disease entities. In HPV-positive OPSCC, the symptom profile and tumor characteristics differ from HPV-negative OPSCC, and the treatment response and the prognosis are usually substantially more favorable in HPV-related disease
[9][10][11]. The prognosis for HPV-negative OPSCC remains relatively poor
[12][13], and the explanation for poor survival rates remains unclear. To improve treatments and diagnostics, it is important to discover novel information on previously undiscovered prognostic factors and mechanisms affecting survival.
Various biomarkers have previously been associated with OPSCC, such as p16
[9][14][15]. Other potential biomarkers with possible prognostic value in OPSCC include Cyclin D1 and matrix metalloproteinases 1 and 2
[16][17][18][19]. Furthermore, recent studies have shown that HPV16 E6 and E7 serum antibody levels may predict OPSCC in advance
[20][21]. However, to our knowledge there are currently no prognostic biomarkers or diagnostic serological biomarkers that are used for individualization of treatments for head and neck squamous cell cancers. Thus, further research on promising biomarkers is warranted. This study is focused on a biomarker known as tumor-associated trypsin inhibitor (TATI), which is associated with multiple malignancies, but has rarely been studied in oropharyngeal cancer
[22][23].
TATI, also known as pancreatic secretory trypsin inhibitor (PSTI) or serine peptidase inhibitor Kazal 1 type (SPINK1), is a trypsin inhibitor that functions mainly in the pancreas, where it serves as a suppressor of premature trypsinogen activation
[24]. The mechanisms regulating extrapancreatic TATI secretion are only partially known. The reference range of TATI concentration in serum (S-TATI) is 3.2–16 μg/L in healthy individuals
[25]. S-TATI has been shown to increase in several non-malignant conditions, such as acute pancreatitis and various other severe inflammatory diseases. Elevated secretion of TATI in cancer patients was first found in the urine of patients with ovarian cancer
[26][27] and it has since been detected in serum and tumor tissue in various malignancies
[25].
In addition to the role if TATI as a diagnostic tumor marker, it may have value as a prognostic marker
[28], and as a target for cancer treatment
[29].
2. TATI Serum Concentrations and Clinical Characteristics
S-TATI was determined in 90 serum samples. Based on a selected cut-off value of 17 µg/L, 21 (23.3%) of the patients were considered TATI positive and 69 (76.7%) S-TATI negative. The crosstab comparisons of S-TATI according to clinical parameters are presented in .
Table 1. Clinicopathological data according to S-TATI.
| Variable |
S-TATI− |
% |
S-TATI+ |
% |
p-Value |
Missing/%
(n = 90) |
| Number of patients |
69 |
76.7 |
21 |
23.3 |
|
|
| Age |
60.8 |
|
65.1 |
|
0.054 |
|
| Gender |
|
|
|
|
|
|
| Male |
52 |
78.8 |
14 |
21.2 |
|
|
| Female |
17 |
70.8 |
7 |
29.2 |
0.4 |
|
| Smoking |
|
|
|
|
|
|
| Never |
27 |
96.4 |
1 |
3.6 |
|
|
| Former |
25 |
83.3 |
5 |
16.7 |
|
|
| Current |
17 |
53.1 |
15 |
46.9 |
<0.001 ** |
|
| Heavy alcohol use |
|
|
|
|
|
16/17.8 |
| Never |
36 |
83.7 |
7 |
16.3 |
|
|
| Former |
6 |
60.0 |
4 |
40.0 |
|
|
| Current |
13 |
61.9 |
8 |
38.1 |
0.09 |
|
| T class |
|
|
|
|
|
|
| T1-T2 |
46 |
51.1 |
12 |
13.3 |
|
|
| T3-T4 |
23 |
25.6 |
9 |
10.0 |
0.4 |
|
| N class |
|
|
|
|
|
|
| N0–N1 |
59 |
79.7 |
15 |
20.3 |
|
|
| N2–N3 |
10 |
62.5 |
6 |
37.4 |
0.2 |
|
| Stage |
|
|
|
|
|
|
| I-II |
52 |
82.5 |
11 |
17.5 |
|
|
| III-IV |
17 |
63.0 |
10 |
37.0 |
0.04 * |
|
| Grade |
|
|
|
|
|
|
| I |
1 |
33.3 |
2 |
66.7 |
|
|
| II |
8 |
53.3 |
7 |
46.7 |
|
|
| III |
60 |
83.3 |
12 |
16.7 |
0.009 * |
|
| Localization |
|
|
|
|
|
|
| Tonsil |
48 |
90.6 |
5 |
9.4 |
|
|
| Base of tongue |
17 |
77.3 |
5 |
22.7 |
|
|
| Soft palate |
3 |
30.0 |
7 |
70.0 |
|
|
| Posterior wall of oropharynx |
1 |
20.0 |
4 |
80.0 |
<0.001 ** |
|
| HPV |
|
|
|
|
|
|
| HPV− |
21 |
56.8 |
16 |
43.2 |
|
|
| HPV+ |
48 |
90.6 |
5 |
9.4 |
<0.001 ** |
|
The correlation between S-TATI and HPV status was statistically significant (p < 0.001). Most (90.60%) of the HPV-positive patients were S-TATI negative. Furthermore, S-TATI negativity was linked to lower cancer stage and higher histological grade (82.5% of the patients had cancer stages I-II and 83.3% of the patients were grade III). In addition, S-TATI negativity correlated with tonsil as tumor site (90.6% of the patients).
A majority (96.4%) of the non-smokers were S-TATI negative. Additionally, most (83.3%) of the former smokers were S-TATI negative. Among the smokers, 53.3% were S-TATI negative and 46.6% were S-TATI positive.
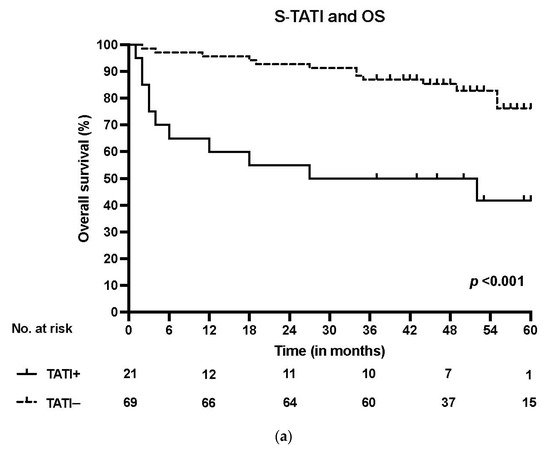
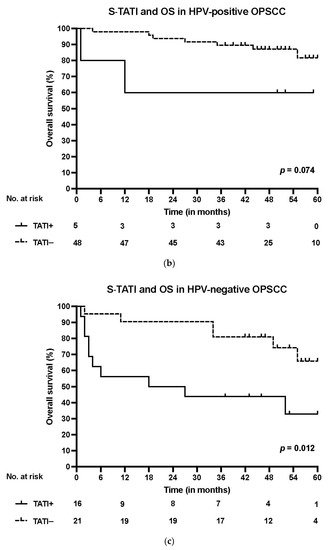
S-TATI positive patients had reduced OS during the 5-year follow-up and S-TATI positivity was linked to poor OS (p < 0.001) and DSS (p = 0.04) in the whole cohort. Furthermore, S-TATI positivity correlated with poor OS (p = 0.01) and DSS (p = 0.05) in HPV-negative patients and with poor DSS (p = 0.01) in HPV-positive patients. The survival curves according to S-TATI and OS are presented in .
Figure 1. (a) Overall survival (OS) according to positive (>17 µg/L) and negative (<17 µg/L) S-TATI in the whole patient cohort. (b) Overall survival (OS) according to positive and negative S-TATI in HPV-positive OPSCC patients. (c) Overall survival (OS) according to positive and negative S-TATI in HPV-negative OPSCC patients.
In the multivariate Cox regression analysis, poorer OS correlated significantly with age (adjusted Hazard ratio (HR) 1.08, 95% Confidence interval (CI) 0.03–1.13,
p = 0.004) and S-TATI (adjusted HR 2.47, 95% CI 1.26–4.84,
p = 0.009). In addition, poorer DSS was associated with age (adjusted HR 1.07, 95% CI 0.01–1.14,
p = 0.018) and S-TATI (adjusted HR 2.54, 95% CI 1.07–6.02,
p = 0.034) in the Cox regression multivariate model. The results of the multivariable analysis are presented in . In the multivariate Cox regression analysis with p16 as a separate variable, S-TATI correlated significantly with OS (adjusted HR 2.49, 95% CI 1.28–4.83,
p = 0.007) and DSS (adjusted HR 2.54, 95% CI 1.09–5.94,
p = 0.031) and the results are presented in
Table S2.
Table 2. Multivariate Cox regression analysis for overall-survival (OS) and disease-specific survival (DSS).
| Variable |
OS |
DSS |
| HR |
95% CI |
p-Value |
HR |
95% CI |
p-Value |
| Age |
1.08 |
1.03–1.13 |
0.004 * |
1.07 |
1.01–1.14 |
0.018 * |
| Smoking |
|
|
0.034 * |
|
|
0.205 |
| Ex-smoker versus never |
1.20 |
0.27–5.40 |
0.816 |
0.62 |
0.10–3.98 |
0.615 |
| Current smoker versus never |
4.14 |
1.22–14.06 |
0.023 * |
2.43 |
0.64–9.18 |
0.192 |
| Stage III–IVversusStage I–II |
1.71 |
0.70–4.20 |
0.243 |
2.19 |
0.72–6.64 |
0.168 |
| HPV-versus HPV+ |
1.01 |
0.36–2.83 |
0.988 |
0.96 |
0.27–3.43 |
0.955 |
| S-TATI |
2.47 |
1.26–4.84 |
0.009 * |
2.54 |
1.07–6.02 |
0.034 * |
3. TATI Immunoexpression and Clinical Characteristics
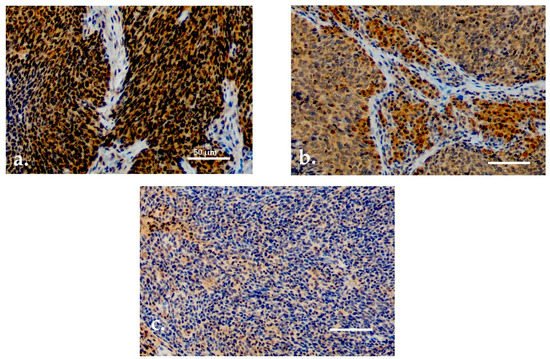
Both serum and tissue data were available for 90 patients. For TATI IHC, adequate samples with HPV status determination were available for 77 (85.6%) patients. TATI was assessed in the tumor tissue in all 77 samples and in the tumor-adjacent lymphocytes in 76 samples (a–c). Most of the samples showed moderate or strong IHC staining of TATI in both the tumor (63.3%) and in the peritumoral lymphocytes (60.5%). TATI-immunopositivity was cytoplasmic. TATI expression in IHC was associated with certain patient characteristics but not with S-TATI. Crosstab comparisons of TATI IHC and clinical characteristics are presented in and .
Figure 2. (a) Moderate/strong TATI expression in tumor tissue. (b) Moderate/strong TATI expression in peritumoral lymphocytes and mild expression in the tumor tissue. (c) Negative TATI expression in the tumor tissue. Scale bar length 50 µm. Magnification ×200.
Table 3. Clinicopathological data according to TATI expression in tumor tissue.
| Variable |
TATI in
Tumor 0–1 |
% |
TATI in
Tumor 2–3 |
% |
p-Value |
Missing/%
(n = 77) |
| Number of patients |
20 |
26.0 |
57 |
63.3 |
|
|
| Age |
64.4 |
|
61.1 |
|
0.2 |
|
| Gender |
|
|
|
|
|
|
| Male |
15 |
25.4 |
44 |
74.6 |
|
|
| Female |
5 |
27.8 |
13 |
72.2 |
0.8 |
|
| Smoking |
|
|
|
|
|
|
| Never |
8 |
33.3 |
16 |
66.7 |
|
|
| Former |
7 |
28.0 |
18 |
72.0 |
|
|
| Current |
5 |
17.9 |
23 |
82.1 |
0.4 |
|
| Heavy alcohol use |
|
|
|
|
|
14/18.2 |
| Never |
14 |
35.9 |
25 |
64.1 |
|
|
| Former |
1 |
16.7 |
5 |
83.3 |
|
|
| Current |
4 |
22.2 |
14 |
77.8 |
0.4 |
|
| T class |
|
|
|
|
|
|
| T1–T2 |
11 |
22.4 |
38 |
77.6 |
|
|
| T3–T4 |
9 |
32.1 |
19 |
67.9 |
0.4 |
|
| N class |
|
|
|
|
|
|
| N0–N1 |
12 |
19.0 |
51 |
81.0 |
|
|
| N2–N3 |
8 |
57.1 |
6 |
42.9 |
0.006 * |
|
| Stage |
|
|
|
|
|
|
| I–II |
9 |
17.0 |
44 |
83.0 |
|
|
| III–IV |
11 |
45.8 |
13 |
54.1 |
0.007 * |
|
| Grade |
|
|
|
|
|
|
| I |
0 |
0.0 |
2 |
100.0 |
|
|
| II |
3 |
23.0 |
10 |
77.0 |
|
|
| III |
17 |
27.4 |
45 |
72.6 |
0.7 |
|
| Localization |
|
|
|
|
|
|
| Tonsil |
10 |
21.7 |
36 |
78.3 |
|
|
| Base of tongue |
6 |
35.3 |
11 |
64.7 |
|
|
| Soft palate |
3 |
33.3 |
6 |
66.7 |
|
|
| Posterior wall of oropharynx |
1 |
20.0 |
4 |
80.0 |
0.7 |
|
| HPV |
|
|
|
|
|
|
| HPV− |
9 |
29.0 |
22 |
71.0 |
|
|
| HPV+ |
11 |
23.9 |
35 |
76.1 |
0.6 |
|
Table 4. Clinicopathological data according to TATI expression in tumor-adjacent lymphocytes.
| Variable |
TATI in Lymphocytes 0–1 |
% |
TATI in Lymphocytes 2–3 |
% |
p-Value |
Missing/%
(n = 76) |
| Number of patients |
30 |
39.5 |
46 |
60.5 |
|
|
| Age |
62.6 |
|
61.3 |
|
0.6 |
|
| Gender |
|
|
|
|
|
|
| Male |
23 |
39.7 |
35 |
60.3 |
|
|
| Female |
7 |
38.9 |
11 |
61.1 |
0.9 |
|
| Smoking |
|
|
|
|
|
|
| Never |
10 |
43.5 |
13 |
56.5 |
|
|
| Former |
5 |
20.0 |
20 |
80.0 |
|
|
| Current |
15 |
53.6 |
13 |
46.4 |
0.04 * |
|
| Heavy alcohol use |
|
|
|
|
|
14/18.4 |
| Never |
17 |
44.7 |
21 |
55.3 |
|
|
| Former |
1 |
16.7 |
5 |
83.3 |
|
|
| Current |
9 |
50.0 |
9 |
50.0 |
0.4 |
|
| T Class |
|
|
|
|
|
|
| T1–T2 |
14 |
28.6 |
35 |
71.4 |
|
|
| T3–T4 |
16 |
59.3 |
11 |
40.7 |
0.009 * |
|
| N Class |
|
|
|
|
|
|
| N0–N1 |
23 |
36.5 |
40 |
63.5 |
|
|
| N2–N3 |
7 |
53.8 |
6 |
46.2 |
0.2 |
|
| Stage |
|
|
|
|
|
|
| I–II |
16 |
30.2 |
37 |
69.8 |
|
|
| III–IV |
14 |
60.9 |
9 |
39.1 |
0.01 * |
|
| Grade |
|
|
|
|
|
|
| I |
1 |
50.0 |
1 |
50.0 |
|
|
| II |
6 |
46.2 |
7 |
53.8 |
|
|
| III |
23 |
37.7 |
38 |
62.3 |
0.8 |
|
| Localization |
|
|
|
|
|
|
| Tonsil |
15 |
32.6 |
31 |
67.4 |
|
|
| Base of tongue |
6 |
37.5 |
10 |
62.5 |
|
|
| Soft palate |
6 |
66.7 |
3 |
33.3 |
|
|
| Posterior wall of oropharynx |
3 |
60.0 |
2 |
40.0 |
0.2 |
|
| HPV |
|
|
|
|
|
|
| HPV− |
18 |
60.0 |
12 |
40.0 |
|
|
| HPV+ |
12 |
33.3 |
34 |
66.6 |
0.003 * |
|
 +1 point