Submitted Successfully!
To reward your contribution, here is a gift for you: A free trial for our video production service.
Thank you for your contribution! You can also upload a video entry or images related to this topic.
Version Summary Created by Modification Content Size Created at Operation
1 + 4209 word(s) 4209 2021-05-31 05:06:20 |
2 format correction Meta information modification 4209 2021-06-01 03:53:35 |

Video Upload Options

Do you have a full video?

Confirm

Are you sure to Delete?
Cite
If you have any further questions, please contact Encyclopedia Editorial Office.
Hayden, M. Leptin Cellular Signaling in Brain. Encyclopedia. Available online: https://encyclopedia.pub/entry/10329 (accessed on 18 April 2024).
Hayden M. Leptin Cellular Signaling in Brain. Encyclopedia. Available at: https://encyclopedia.pub/entry/10329. Accessed April 18, 2024.
Hayden, Melvin. "Leptin Cellular Signaling in Brain" Encyclopedia, https://encyclopedia.pub/entry/10329 (accessed April 18, 2024).
Hayden, M. (2021, June 01). Leptin Cellular Signaling in Brain. In Encyclopedia. https://encyclopedia.pub/entry/10329
Hayden, Melvin. "Leptin Cellular Signaling in Brain." Encyclopedia. Web. 01 June, 2021.
Leptin Cellular Signaling in Brain
Edit

The triad of obesity, metabolic syndrome (MetS), Type 2 diabetes mellitus (T2DM) and advancing age are currently global societal problems that are expected to grow over the coming decades. This triad is associated with multiple end-organ complications of diabetic vasculopathy (maco-microvessel disease), neuropathy, retinopathy, nephropathy, cardiomyopathy, cognopathy encephalopathy and/or late-onset Alzheimer’s disease. 

adipose tissue blood-brain barrier blood-cerebrospinal fluid barrier endothelial cell endothelial glycocalyx permeability aging insulin resistance leptin resistance neurovascular unit obesity microglia ultrastructure

1. Introduction

Obesity may be considered a chronic disease and is a global problem [1]. Obesity is primarily driven by high caloric diets (Western or cafeteria diet) and sedentary lifestyles [2]. The Western diet and sedentary lifestyles have contributed to the aging baby-boom generation of our global society of obesity and Type 2 diabetes mellitus (T2DM). Additionally, the post-World War II baby boom generation is aging, a trend that is expected to continue over the next two to three decades (2020 to 2050). Importantly, we may be currently living in one of the oldest-living global populations with T2DM and late-onset Alzheimer’s disease (LOAD) each being age-related diseases [3].
In addition to diet and physical activity, genetic predisposition plays an important role in weight gain and obesity [4]. The genetically induced hyperphagia and obesity in db/db mice, ob/ob mice, BTBR.Cg-Lepob/WiscJ ob/ob (BTBR ob/ob) mice and Zucker obese fa/fa rats are associated with the development of insulin resistance, Type 2 diabetes mellitus (T2DM), and altered leptin signaling. In the human population, genetic variation contributes to the polygenic and multifactorial etiologies associated with obesity, metabolic syndrome (MetS), insulin resistance, and T2DM [3][4]. These, in turn, contribute to multiple end-organ aberrant remodeling and end-organ disease complications such as diabetic vasculopathy (macro-microvessel disease), neuropathy, retinopathy, nephropathy, cardiomyopathy, diabetic cognopathy, and late-onset Alzheimer’s disease (LOAD). In this review, the role of the adipocyte-derived hormone (adipokine) leptin in multiple end-organ diabetic-opathies and especially in aberrant ultrastructure remodeling of the brain will be emphasized. Early on, even prior to the clinical diagnosis of T2DM, there may be variable degrees of obesity, insulin and leptin resistance and impaired glucose tolerance. Therefore, one can model MetS or T2DM as a clinical spectrum disease that in combination with disease duration, aging, and other variables evolves over time [5].
Two position statements by the American Association of Clinical Endocrinologists (AACE) include important views on prediabetes or impaired glucose tolerance and overt T2DM as “dysglycemia-based chronic disease” and obesity or adiposity-based chronic disease. These statements include a more broad-based view of each of these two chronic diseases that are now considered of global importance regarding their pathophysiology and progression, such that they are often referred to as a common chronic disease of “diabesity” [6][7][8].
Preclinical rodent models have played an important role in studying the effects of impaired leptin signaling. Therefore, it is important to place in perspective a historical timeline of preclinical models used in research and development to study the effects of leptin in obesity and T2DM (Figure 1) [9][10][11][12][13][14][15][16][17][18][19]. Preclinical research and discovery take a considerable amount of time and patience as noted in the progression of discovery in the following timeline (Figure 1).
Figure 1. Timeline for discovery and development of key mouse models in obesity and Type 2 diabetes mellitus (T2DM) research. The dashed timeline illustrates important discoveries and models from 1949 to date. References are inserted below the dates of each model. The central importance of leptin is emphasized. FFA = free fatty acids; VAT = visceral adipose tissue; WAT = white adipose tissue.
Occasionally, a marked development or discovery is made which changes the way we think. Some discoveries may even result in a paradigm shift in how we view a certain clinical disease state, such as that of leptin by Friedman and colleagues [13][14][15][20]. Figure 1 illustrates the historical timeline regarding animal models of obesity and T2DM, including the discovery of leptin. These models are central to understanding the role leptin plays in ultrastructural remodeling of the brain’s neurovascular unit, the capillary bed of the brain, which forms the blood-brain barrier (BBB), and the choroid plexus which forms the blood-cerebrospinal fluid barrier (BCSFB).
The BTBR ob/ob model described by Hudkins et al. is a recent model, mostly used to study diabetic nephropathy [19]. Briefly, the BTBR.Cg-Lepob/WiscJ ob/ob mouse (BTBR ob/ob) is characterized by early insulin resistance with elevated insulin levels, pancreatic islet hypertrophy, and the development of hyperglycemia by six-weeks of age. Crossing the BTBR strain with the ob/ob mutation results in the BTBR ob/ob model, characterized by diabetes with glucose levels in the range of 350 to 400 mg/dl. Unlike the ob/ob model, hyperglycemia in the BTBR ob/ob mouse is sustained and by 20-weeks of age, both sexes show similar levels of glucotoxicity. The BTBR ob/ob model, highly preferred for study of diabetic nephropathy, is largely unexplored regarding brain remodeling [19].

2. Leptin

Leptin (derived from the Greek leptos meaning “thin”) is an adipokine-polypeptide hormone with a molecular mass of 16kD consisting of 167 amino acids encoded by the obesity (ob) gene. It is primarily synthesized and secreted by the subcutaneous white adipose tissue (WAT) and the organ centric omental-visceral adipose tissue (VAT), which includes the perivascular adipose tissue (PVAT) or tunica adiposa adipocytes [13][14][15][21][22]. Interestingly, subcutaneous WAT produces more leptin than VAT and is now considered an endocrine tissue in addition to its earlier known role as a storage depot for excess energy intake [13][14][15][21][22]. Leptin expression is regulated by a variety of hormones, including insulin, glucocorticoids (corticosterone in rodents and cortisol in humans) and even leptin itself [21][22]. Circulating leptin levels are known to be in proportion to body adipose mass and thought to serve as an adiposity signal of total body energy stores to the brain hypothalamic nuclei [23][24]. Leptin is proposed to act as an afferent signal in the negative feedback loop to the hypothalamus that inhibits food-intake, controls energy homeostasis and thermogenesis, and regulates adipose tissue mass. Importantly, leptin is capable of autocrine (self), paracrine (adjacent) and endocrine signaling to distant tissues including the brain [14][15][16][17][25][26][27].
The concept of leptin resistance (LR) is important to the understanding of obesity in humans as well as in the diet-induced obesity (DIO) Western and db/db models. Indeed, hyperleptinemia is thought to result from LR resulting from deficient cellular signaling by leptin [27][28].
Gruzdeva et al. have suggested that various mechanisms may underlie LR in the brain and include a number of possible molecular and functional alterations, which may be characterized by structural changes to the leptin molecule, its transport across brain barriers, and leptin-receptor dysfunction/impaired signaling [28]. Deficient leptin cellular signaling, whether because of deficient leptin secretion, faulty leptin transport at the BBB and BCSFB interfaces, genetic abnormalities of leptin receptors, or post-leptin receptor signaling defects, results in loss of leptin’s neuroprotective effects and results in changes in brain function and remodeling [27][28][29].
The receptor for leptin (LepR or OB-R) is a Type I cytokine receptor protein encoded by the rather ubiquitous LEPR gene and is present in adipose tissue, brain, cardiovascular tissue, liver, kidney, skeletal muscle, and other tissues [30][31]. Splicing variants give rise to several forms of the leptin receptor, but it is the long isoform (LepRb) that participates in intracellular signaling. LepRb is highly expressed in the hypothalamus, where energy homeostasis and neuroendocrine function is regulated [31][32]. The short isoform of LepR has been proposed to mediate the transport of leptin across the blood-brain barrier, but currently there is evidence both for and against this proposal [33][34].
The leptin receptor is widely distributed and leptin has multiple pleiotropic effects [14][15][16][17][25][26][27]. As examples, leptin is important in the embryologic development of the brain and modulates glucose homeostasis, neuroendocrine axes, the autonomic nervous system, memory, and neural plasticity [35]. Leptin is capable of modulating multiple non-satiety processes, which include thermogenesis, reproduction, angiogenesis, osteogenesis, hematopoiesis, immune functions, cardio-cerebrovascular functions at the level of the myocardial capillaries and brain capillary endothelial NVUs, and renal glomeruli [19][20][21][22][23][24][25][26][27][28][29][30][31][32][33][34][35][36]. As discussed later in Section 4.1.2, these functions may importantly extend to regulation of the brain endothelial cell(s) (BEC) glycocalyx.

3. Central Nervous System (CNS) Roles of Leptin in Diet induced Obesity (DIO), db/db and BTBR ob/ob: Genetic Preclinical Models

Over the past few years, we have studied the effects of leptin on brain ultrastructural remodeling [3][37][38][39][40][41][42][43]. This work is reviewed in the following sections. In obese rodent models (including the DIO-Western, db/db, and BTBR ob/ob), the effects of leptin signaling in the brain and peripheral tissues has been studied. Herein, we also include the streptozotocin (STZ) induced diabetes model (STZ-induced DM) in which animals have little adipose tissue, insulin, or leptin. It is important to note that to date, the only published work in this field on the BTBR ob/ob model is a poster presentation at the 2019 ADA poster presentations [44]; however, in this review, we will illustrate some ultrastructural remodeling changes, noting that the BTBR ob/ob mouse has an increased permeability (i.e., leakiness of the BBB) in most regions of the brain (Figure 2A,B and Figure 3) [44]. Figure 2 compares three obesity models with dysglycemia (DIO, db/db, BTBR ob/ob) to their non-diabetic controls and to the STZ-induced model of T1DM.
Figure 2. Brain ultrastructural remodeling in obesity models studied to date with insulin and leptin levels for comparison. Panel A depicts the importance of obesity, insulin resistance-deficient leptin cellular signaling in regards to the development of age-related diseases such as late onset Alzheimer’s disease (LOAD) and neurodegeneration (left-hand side blue coloration). Boxes 1, 3, and 4 (right-hand side) all share deficient cellular leptin signaling. Box 2 depicts the streptozotocin induced insulinopenic diabetes mellitus (DM). Panel B illustrates the increased (upward arrows) and decreased (downward arrows) of insulin and leptin in each model discussed in Panel A. AC = astrocyte; AJ = adherens junction; AKT = protein kinase B; EC = endothelial cell; IFG = impaired fasting glucose; IGT = impaired glucose tolerance; i.p. = intraperitoneal; IRS−1 = insulin receptor substrate−1; LAN = lanthanum nitrate; NVU = neurovascular unit; PI3Kinase = phosphoinositide 3-kinase; T2DM = Type 2 diabetes mellitus; SQ = subcutaneous fat; TJ = tight junction; VAT = visceral adipose tissue; WAT = white adipose tissue.
Figure 3. Venn diagram illustrates the shared importance of leptin in diet-induced obesity (DIO), Western, db/db and BTBR ob/ob models. Deficient cellular leptin signaling is common in all three models, but through different mechanisms. All models are obese and there is dysglycemia in the diet induced obesity (DIO) model, overt T2DM in the db/db, and elevated blood glucose levels in the BTBR ob/ob. IGT = impaired glucose tolerance; IR = insulin resistance; LR = leptin resistance; T2DM = Type 2 diabetes mellitus.

4. Neurovascular Unit (NVU) as an Anatomical Ultrastructural and Functional Unit

The NVU includes the brain endothelial cells which form the blood-brain barrier (BBB), basement membranes (BM), pericytes (Pc) vascular smooth muscle cells in arterioles, microglia, astrocytes (AC), and neurons (myelinated and/or unmyelinated). The cell types forming the NVU are in cross-talk with one another, influencing one another’s behavior. Oligodendrocytes and myelinated and unmyelinated neuronal axons can exist in the BM, especially in the subcortical and white matter regions of the brain (Figure 4). Various cells within the NVU are responsible for BBB formation and autoregulation of blood oxygen level dependent (BOLD) regional cerebral blood flow (CBF), measurable by positron emission tomography and functional magnetic resonance imaging [3][37][38][39][40][41][42][43].
Figure 4. The neurovascular unit (NVU) in healthy control C57BL/6J mice at 20 weeks of age from cortical Layer III. Panel A astrocyte foot processes (AC) are pseudo-colored golden to emphasize their important anatomical location. Note the ramified microglial cell (rMGC) (yellow arrow) surveilling the NVU in Panel A. Panel B illustrates a horizontal image of the NVU (contrasting with the cross-section image in Panel A) to better illustrate the electron dense tight and adherens junctions (TJ/AJ) (yellow arrows) within the paracellular regions and emphasize the clear zone or corona of electron lucent AC foot processes (ACfp). Panel C depicts a NVU within the hippocampus where a myelinated axon bundle is present. Additionally, oligodendrocytes may exist in the NVU basement membrane (BM) especially in the subcortical and white matter regions (not shown). Note that the BM splits to encompass the pericyte foot processes (Pcfp). Magnification ×4000; scale bar = 1 µm. Panels A and B are adapted with permission from reference [39]. AC = astrocyte; ACfp = astrocyte foot processes; BM = basement membrane; Cap L and CL = capillary Lumen of the NVU; CKC = control C57BL/6J model; EC = endothelial cell; Mt = mitochondria; rMGC = ramified MGC; Pc = pericyte; Pcfp = pericyte foot processes.

5. Microglia (MGC)

As noted above, aMGC encroaching into the NVU and encompassing the BEC are a frequent finding in the BTBR ob/ob model in the hippocampus. In the cortex, ramified microglia were increased compared to controls, but there was no activation in cortical Layer III of microglia. Ramified microglial cells (rMGCs) protect brain functions by phagocytosing cellular debris. MGCs are of mesodermal (yolk sac derived) origin and serve the brain as resident innate immune cells. They are responsive to many cytokines, chemokines, and signaling molecules, producing free radicals (superoxide, reduced nicotinamide adenine dinucleotide phosphate (NADPH Ox), inducible nitric oxide and mitochondrial-derived reactive oxygen/nitrogen (mtROS). The aMGCs are able to return to their surveilling-ramified phenotype once the invaders or danger–damage signals have been eradicated. Additionally, MGCs are important in brain development and play an important role shaping and pruning neuronal synaptic connectivity in formative and adult years [41][45][46][47][48][49][50][51][52][53][54][55]. MGCs are distinct from bone marrow derived peripheral monocyte-macrophage cells in that they are the brain resident inflammatory immune cells and not dependent on recruitment from the peripheral systemic circulation but are capable of undergoing proliferation and activation as needed [56]. Multiple toxicities in obesity and T2DM including the absence of leptin cellular signaling may result in aMGCs in the db/db models to a much greater extent as compared to the BTBR ob/ob models (Figure 5) [3][41][43].
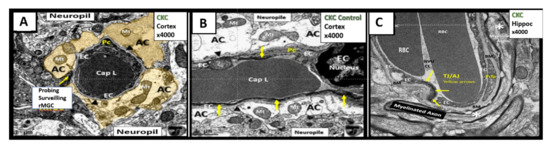
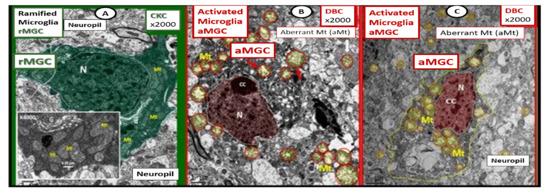
Figure 5. Comparison of ramified microglia (rMGC) in control mice to activated microglia (aMGC) in obese Type 2 diabetes mellitus (T2DM) db/db model. Panel A illustrates the normal appearance of ramified microglia (rMGC-pseudo-colored green) (see Figure 5A,C). In addition, note the insert in Panel A and the presence of cristae in rMGC at higher magnification ×6000). Panels B and C depict aMGCs (pseudo-colored red) with swollen electron lucent aberrant mitochondria (aMt) (pseudo-colored yellow) the db/db diabetic mice. Magnification ×2000; scale bar = 1 µm in A and B and 2 µm in Panel C. These images are adapted with permission from references [3][39]. CC = chromatin condensation; CKC = control C57BL/6J female non-diabetic model; DBC = female diabetic db/db model.
We observed an increase in the number of rMGCs in the cortical Layer III of the BTBR ob/ob as compared to control models and this may be due to an increase in metabolic neuronal and NVU activity in these regions. In the hippocampal regions of the BTBR ob/ob, we not only observed a marked increase in rMGCs in excess of the cortical regions as compared to control models, but also noted the encroaching aMGCs (Figure 5).
Our results in the BTBR ob/ob model strongly suggest that these models are a pro-neuroinflammatory phenotype, especially in the hippocampal regions. Interestingly, the difference between the level of activation of the microglia in the db/db and BTBR ob/ob suggests a difference in their genetic background even though both models were obese and developed T2DM with hyperglycemia at 20-weeks. In the original publication describing the BTBR ob/ob model, Hudkins et al. [19] noted that glucose levels were in the 300 mg/dL range and that in the db/db the mean glucose at a similar age were in the range of 500 mg/dL [3][41][43][57][58]. This difference in the amount of glucotoxicity could be at least one reason the activation of MGC were not as prevalent in the female BTBR ob/ob as compared to the db/db models [19]. Additionally, BTBR ob/ob fetuses, unlike db/db fetuses, will have leptin stimulation probably until weaning. Ultrastructural observations in the db/db and BTBR ob/ob certainly implicate the activation of resident microglia and encroachment of the NVU by aMGCs may be one of the mechanisms for impaired NVU capillary dilation due to regional neuron signal or NVU uncoupling associated with decreased regional cerebral blood flow within the hypothalamus [3][41]. This NVU uncoupling could certainly be related to a decrease in CBF and neuronal ischemia resulting in synaptic dysfunction and/or neuronal loss with ensuing impaired cognition and regional brain atrophy. However, brain atrophy has only been reported in the db/db models by Ramos-Rodrigues et al. [59] and was not found to be present in this current BTBR ob/ob study (Figure 6).
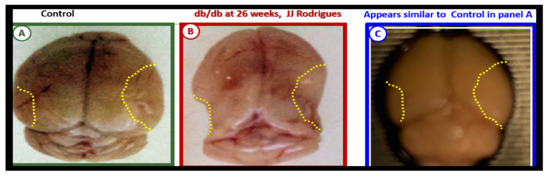
Figure 6. Gross brain atrophy in the db/db model but not in the diabetic BTBR ob/ob model. Panel B illustrates the brain atrophy at the time of surgical removal of the diabetic db/db models as compared to control models in Panel A. Panel B depicts the marked atrophy or loss in the cortical-parietal-hippocampal regions (outlined by the yellow dashed lines) in comparison to the control in Panel A at 26-weeks. Panel C demonstrates the BTBR ob/ob model at 20-weeks without atrophy in the parietal-hippocampal regions of the whole brain when compared to the db/db model in Panel B at 26-weeks. This may correlate with the less severe ultrastructural remodeling of the neurovascular unit and less microglial neuroinflammation in BTBR ob/ob mice as compared to db/db mice. Panels A and B CC by NC-ND [59].
Ramos-Rodriguez et al. [59] have demonstrated that the db/db models have abnormal gross morphological findings with decreased brain weights, including grossly evident cortical parietal-hippocampal atrophy, a finding not present in the BTBR ob/ob model (Figure 6). These findings suggest an interaction of genetic background with obesity and T2DM in regards to brain morphology as well as the role of leptin receptor deficiency vs deficient leptin production as in the BTBR ob/ob models. Whether this atrophy relates to differences in neurogenesis, decreased CBF, or neuronal ischemia with loss of synapses and neurons is unknown.

6. Blood-Cerebrospinal Fluid Barrier (BCSFB), Choroid Plexus, Median Eminence of Third Ventricle, Tanycytes, Circumventricular organ(s) (CVOs) and Hypothalamic Nuclei

The brain’s ventricular system (two lateral and third, aqueduct, and fourth ventricles) contain the cerebrospinal fluid (CSF) and are lined primarily by cuboidal epithelial cells termed ependymal (EPY) cells (Figure 7) [60].
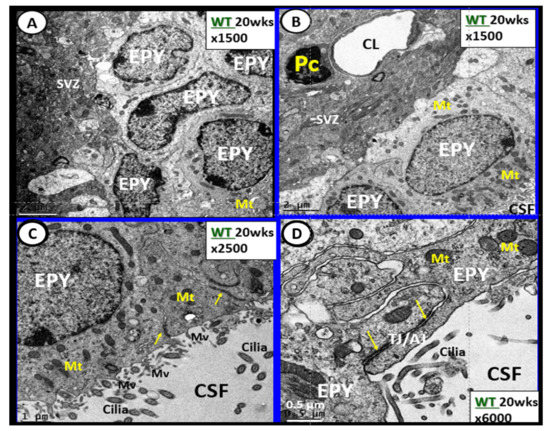
Figure 7. Ependymal cells lining the ventricular cerebrospinal fluid (CSF) system of the aqueduct in female control 20 week old models. Panel A illustrates that not all ependymal cells (EPY) are cuboidal but may lie flattened and be multilayered at the subventricular zone (SVZ) region of the adjacent neuropil. Panel B demonstrates the more classical cuboidal morphologic phenotype of the EPY cells that line the CSF ventricles. Note the close 5 µm distance between the EPY cells and fenestrated capillary within the SVZ neuropil. The adjacent capillary neurovascular units (NVU) in the SVZ do not have a similar coverage by astrocytes as in the cortical regions but pericytes (Pc) are frequently noted and this capillary appears to be fenestrated due the thinning of the ECs. Panel C depicts the ependymal cilia with the classical 9:2 arrangements of cytoskeletal proteins within them in addition to multiple microvilli (Mv) on the apical surface facing the CSF. Panel D demonstrates the overlapping and interdigitations of EPY cells, and also the staining of the very electron dense tight and adherens junction (TJ/AJ) proteins (arrows) and desmosomes that create the barrier functions of the EPY cells in some regions of the ependymal lining of the CSF. While these EPY cells are located in the aqueduct they also are representative of the EPY cells found throughout each of the four ventricles and lining of choroid plexus (CP) that provides the CP with its barrier function. As noted in these images, the EPY cells form the structural and functional barrier of the choroid plexus. CL = capillary lumen.
EPYs have CSF apical microvilli that increase their surface area and cilia to aid the movement of CSF within the ventricles. EPYs have a genetic linkage to the neuroepithelial cells of the developing neural tube of the embryo. CSF within the ventricles is thought to serve as a sink for the deposition of toxic metabolic byproducts created by the high metabolic neuronal activity within the brain and their subsequent removal into the systemic venous pathway (including the toxic amyloid beta proteins). The CSF from the ventricles enters the subarachnoid space to be drained by the subarachnoid granulations and nasal lymphatics into the systemic circulation [61][62][63][64][65].
The rather uniform coverage of the ventricles by EPYs gives way to a specialized covering of the choroid plexus (CP) in the floor of the lateral ventricles and the roof of the third ventricle. The CP is supplied by the choroid arterial system and these end in a plexus of capillaries that are fenestrated. These fenestrated capillaries produce a plasma filtrate that is separated from the CSF by the EPYs that form the CP. Importantly, these EPYs of the CP possess TJ/AJ and secrete the bulk of CSF (Figure 8) [66][67].
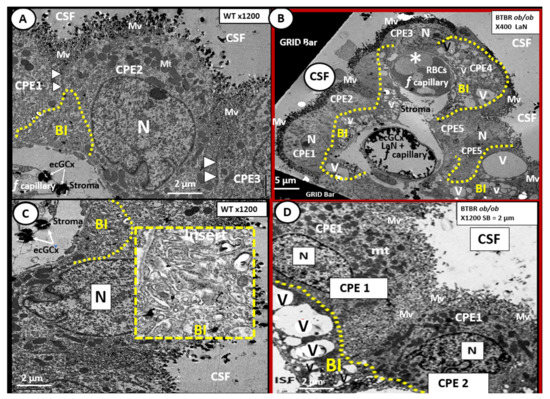
Figure 8. Choroid plexus (lateral ventricle) with aberrant vacuolization of the basilar infoldings of ependymal cells in obese diabetic female BTBR ob/ob models. Panel A demonstrates the normal ultrastructural morphology of the choroid plexus ependymal cell(s) (CPE) in the control heterozygous model, characterized by compact basilar infoldings (BI) (yellow dashed line), tight and adherens junctions (TJ/AJ) (arrowheads), microvilli (Mv) of the brush border at the apical cerebrospinal fluid (CSF) interface, and the multiple electron dense mitochondria (Mt) in a highly polarized ependymal cell. Panel B depicts aberrant remodeling changes of the (BI) at lower magnification to include multiple CPEs (CPE 1–5) which consist of vesiculation (v)/vacuolization (V) of the BI (yellow dashed lines). Importantly, note the lower fenestrated (f) capillary with positive staining for lanthanum nitrate (LaN) of the endothelial glycocalyx (ecCGx) and the upper capillary (*) that is filled with multiple red blood cells (RBCs) that is highly suggestive of capillary micro-thrombosis and without evidence of LaN staining. Panel C also illustrates the control heterozygote CPEs and this image contains an exploded insert of the BI (outlined in yellow dashed lines). This insert illustrates the compactness of the BIs without v/V. Panel D depicts the v/V of the BI as compared to the control models in Panels A and C. Magnification ×400; scale bar = 5 µm in Panel B and magnification ×1200; scale bar = 2 µm in Panels A–D. n = nucleus.
The CP is primarily responsible for two-thirds of the CSF production along with the EPY cells and cells lining the subarachnoid space [68]. Of significant importance is the recent report that insulin is synthesized in the EPY cells of the choroid plexus, which is regulated by serotonergic signaling [69]. The CP regions are covered by the EPY cells as previously imaged and each of these adjacent EPY cells are known to contain TJ/AJ, forming the barrier function of the CP and the BCSFB (Figure 7 and Figure 8).
As one traces the ciliated EPY cells to the median eminence of the hypothalamus, the EPY cells give way to tanycytes, which are highly specialized ependymal cells, and lose their cilia, supposedly to better sense the multiple hormonal and non-hormonal proteins and polypeptide contents in the CSF. Importantly, the tanycytes also have elongated subventricular zone (SVZ) cytoplasmic processes that may directly interact with the portal fenestrated capillaries of the CVOs and are also capable of connecting the median with the hypothalamus.
Tanycytes were originally documented and named by Horstmann in 1954 [70]. Further, tanycytes have been discussed in detail by Rodriguez et al. [71] with more recent discussions provided by Gao et al. and Balland et al. [72][73], as well as in regards to the neuroimmune axis of the barriers [73][74]. Currently there are thought to be at least four types of tanycytes (alpha1, 2 and beta 1, 2-dorsal β1d, ventral β1v, lateral β2la and medial β2me) which have varied functions. The tanycytes are not only responsible for glucose sensing via their glucose transporters but also leptin sensing via its leptin receptors (LepRs) [74][75]. As one follows the lining EPYs of the CSF ventricles to the region of the median eminence the lining EPYs differentiate to become tanycytes, which are one mechanism for the uptake and distribution of leptin to the hypothalamus.
Intraventricular CSF lining tanycytes are highly specialized bipolar ependymal cells that line the ventrolateral wall and the floor of the third ventricle and play a significant role in leptin uptake at the level of the median eminence of the hypothalamus. Tanycytes also play a key role in our obesity and T2DM models in this review (DIO Western, db/db and BTBR ob/ob) as they sense leptin and glucose [76][77]. Therefore, tanycytes play a necessary and essential role in regulating peripheral metabolic signals and energy balance since leptin is considered to be the afferent arm of the brain’s negative feedback control of this delicate balance between peripheral WAT adiposity and the CNS response [75][76]. The above dual vascular supply of leptin via the pial BBB capillaries and the choroid capillaries of the CP; BCSFB are very important for leptin brain hypothalamic signaling and maintaining leptin CNS homeostasis [66][78].
In the BTBR ob/ob females, we found evidence of remodeling of the ventricular system (Figure 8). In particular, the basilar infoldings were highly vacuolated and vesiculated. The presence of microthrombosis illustrates the risk of vascular to the CP as well as to brain parenchyma.

References

  1. Rippe, J.M.; Crossley, S.; Ringer, R. Obesity as a chronic disease: Modern medical and lifestyle management. J. Am. Diet. Assoc. 1998, 98 (Suppl. 2), S15–S19.
  2. Aroor, A.R.; Jia, G.; Sowers, J.R. Cellular mechanisms underlying obesity-induced arterial stiffness. Am. J. Physiol. Regul. Integr. Comp. Physiol. 2018, 314, R387–R398.
  3. Hayden, M.R. T2DM increases the risk of late-onset Alzheimer’s disease: Ultrastructural Remodeling of the Neurovascular Unit and Diabetic Gliopathy. Brain Sci. 2019, 9, 262.
  4. Jiang, S.Z.; Lu, W.; Zong, X.F.; Ruan, H.Y.; Liu, Y. Obesity and hypertension. Exp. Ther. Med. 2016, 12, 2395–2399.
  5. Hayden, M.R. An immediate and Long-Term Complication of COVID-19 May Be Type 2 Diabetes Mellitus: The Central Role of beta-Cell Dysfunction, Apoptosis and Exploration of Possible Mechanisms. Cells 2020, 9, 2475.
  6. Mechanick, J.I.; Garber, A.J.; Grunberger, G.; Handelsman, Y.; Garvey, W.T. Dysglycemia-based chronic disease: An American Association of Clinical Endocrinologists position statement. Endocr. Pract. 2018, 24, 995–1011.
  7. Mechanick, J.I.; Hurley, D.L.; Garvey, W.T. Adiposity-based chronic disease as a new diagnostic term: The American Association of Clinical Endocrinologists and American College of Endocrinology position statement. Endocr. Pract. 2017, 23, 372–378.
  8. Sims, E.A.; Danforth, E.; Horton, E.S., Jr.; Bray, G.A.; Glennon, J.A.; Salans, L.B. Endocrine and metabolic effects of experimental obesity in man. Recent. Prog. Horm. Res. 1973, 29, 457–496.
  9. Ingalls, A.M.; Dickie, M.M.; Snell, G.D. Obese, a new mutation in the house mouse. J. Hered. 1950, 41, 317–318.
  10. Zucker, L.M.; Zucker, T.F. Fatty, a new mutation in the rat. J. Hered. 1961, 52, 275–278.
  11. Hummel, K.P.; Dickie, M.M.; Coleman, D.L. Diabetes, a new mutation in the mouse. Science 1966, 153, 1127–1128.
  12. Peterson, R.G.; Shaw, W.N.; Neel, M.A.; Little, L.A.; Eichberg, J. Zucker Diabetic Fatty Rat as a Model for Non-insulin-dependent Diabetes Mellitus. Ilar J. 1990, 32, 16–19.
  13. Zhang, Y.; Proenca, R.; Maffei, M.; Barone, M.; Leopold, L.; Friedman, J.M. Positional cloning of the mouse obese gene and its human homologue. Nature 1994, 372, 425–432.
  14. Friedman, J. Leptin at 20: An overview. J. Endocrinol. 2014, 223, 1.
  15. Friedman, J. The long road to leptin. J. Clin. Investig. 2016, 126, 4727–4734.
  16. Scherer, P.E.; Williams, S.; Fogliano, M.; Baldini, G.; Lodish, H.F. A novel serum protein similar to C1q, produced exclusively in adipocytes. J. Biol. Chem. 1995, 170, 26746–26749.
  17. Trujillo, M.E.; Scherer, P.E. Adiponectin—Journey from an adipocyte secretory protein to biomarker of the metabolic syndrome. J. Int. Med. 2005, 257, 167–175.
  18. Wang, Z.V.; Scherer, P.E. Adiponectin, the past two decades. J. Mol. Cell Biol. 2016, 8, 93–100.
  19. Hudkins, K.L.; Pichaiwong, W.; Wietecha, T.; Kowalewska, J.; Banas, M.C.; Spencer, M.W.; Mühlfeld, A.; Koelling, M.; Pippin, J.W.; Shankland, S.J.; et al. BTBR Ob/Ob mutant mice model progressive diabetic nephropathy. J. Am. Soc. Nephrol. 2010, 21, 1533–1542.
  20. Flier, J.S.; Maratos-Flier, E. Lasker lauds leptin. Cell Metab. 2010, 143, 9–12.
  21. Zhou, Y.; Rui, L. Leptin signaling and leptin resistance. Front. Med. 2013, 7, 207–222.
  22. Margetic, S.; Gazzola, C.; Pegg, G.G.; Hill, R.A. Leptin: A review of its peripheral actions and interactions. Int. J. Obes. Relat. Metab. Disord. 2002, 26, 1407–1433.
  23. Frederich, R.C.; Hamann, A.; Anderson, S.; Lollmann, B.; Lowell, B.B.; Flier, J.S. Leptin levels reflect body lipid content in mice: Evidence for diet-induced resistance to leptin action. Nat. Med. 1995, 1, 1311–1314.
  24. Maffei, M.; Halaas, J.; Ravussin, E.; Pratley, R.E.; Lee, G.H.; Zhang, Y.; Fei, H.; Kim, S.; Lallone, R.; Ranganathan, S.; et al. Leptin levels in human and rodent: Measurement of plasma leptin and ob RNA in obese and weight-reduced subjects. Nat. Med. 1995, 1, 1155–1161.
  25. Vázquez-Vela, M.E.; Torres, N.; Tovar, A.R. White adipose tissue as endocrine organ and its role in obesity. Arch. Med. Res. 2008, 39, 715–728.
  26. Park, H.K.; Ahima, R.S. Physiology of leptin: Energy homeostasis, neuroendocrine function and metabolism. Metabolism 2015, 64, 24–34.
  27. Ahima, R.S.; Flier, J.S. Leptin. Annu. Rev. Physiol. 2000, 62, 413–437.
  28. Gruzdeva, O.; Borodkina, D.; Uchasova, E.; Dyleva, Y.; Barbarash, O. Leptin resistance: Underlying mechanisms and diagnosis. Diabetes Metab. Syndr. Obes. 2019, 12, 191–198.
  29. Tang, B.L. Leptin as a neuroprotective agent. Biochem. Biophys. Res. Commun. 2008, 368, 181–185.
  30. Winick, J.D.; Stoffel, M.; Friedman, J.M. Identification of microsatellite markers linked to the human leptin receptor gene on chromosome 1. Genomics 1966, 36, 221–222.
  31. Tartaglia, L.A.; Dembski, M.; Weng, X.; Deng, N.; Culpepper, J.; Devos, R.; Richards, G.J.; Campfield, L.A.; Clark, F.T.; Deeds, J.; et al. Identification and expression cloning of a leptin receptor, OB-R. Cell 1955, 83, 1263–1271.
  32. Kelesidis, T.; Kelesidis, I.; Chou, S.; Mantzoros, C.S. Narrative review: The role of leptin in human physiology: Emerging clinical applications. Ann. Intern. Med. 2010, 152, 93–100.
  33. Banks, W.A.; Niehoff, M.L.; Martin, D.; Farrell, C.L. Leptin transport across the blood-brain barrier of the Koletsky rat is not mediated by a product of the leptin receptor gene. Brain Res. 2002, 950, 130–136.
  34. Di Spiezio, A.; Sandin, E.S.; Dore, R.; Müller-Fielitz, H.; Storck, S.E.; Bernau, M.; Mier, W.; Oster, H.; Jöhren, O.; Pietrzik, C.U.; et al. The LepR-mediated leptin transport across brain barriers controls food reward. Mol. Metab. 2018, 8, 13–22.
  35. Bjørbæk, C.; Elmquist, J.K.; Michl, P.; Ahima, R.S.; Van Bueren, A.; McCall, A.L.; Flier, J.S. Expression of leptin receptor isoforms in rat brain microvessels. Endocrinology 1998, 139, 3485–3491.
  36. Ramos-Lobo, A.M.; Donato, J., Jr. The role of leptin in health and disease. Temperature 2017, 4, 258–291.
  37. Hayden, M.R.; Banks, W.A.; Shah, G.N.; Gu, Z.; Sowers, J.R. Cardiorenal metabolic syndrome and diabetic cognopathy. Cardiorenal Med. 2013, 3, 265–282.
  38. Salameh, T.S.; Shah, G.N.; Price, T.O.; Hayden, M.R.; Banks, W.A. Blood-Brain Barrier Disruption and Neurovascular Unit Dysfunction in Diabetic Mice: Protection with the Mitochondrial Carbonic Anhydrase Inhibitor Topiramate. J. Pharmacol Exp. Ther. 2016, 359, 452–459.
  39. Hayden, M.R.; Grant, D.G.; Aroor, A.; Demarco, V.G. Ultrastructural Remodeling of The Neurovascular Unit in The Female Diabetic db/db Model—Part I: Astrocyte. Neuroglia 2018, 1, 15.
  40. Hayden, M.R.; Grant, D.; Aroor, A.; Demarco, V.G. Ultrastructural Remodeling of The Neurovascular Unit in The Female Diabetic db/db Model—Part II: Microglia and Mitochondria. Neuroglia 2018, 1, 21.
  41. Hayden, M.R.; Grant, D.G.; Aroor, A.; Demarco, V.G. Ultrastructural Remodeling of the Neurovascular Unit in the Female Diabetic db/db Model—Part III: Oligodendrocyte and Myelin. Neuroglia 2018, 1, 24.
  42. Hayden, M.R.; Grant, D.G.; Aroor, A.R.; DeMarco, V.G. Empagliflozin Ameliorates Type 2 Diabetes-Induced Ultrastructural Remodeling of the Neurovascular Unit and Neuroglia in the Female db/db Mouse. Brain Sci. 2019, 9, 57.
  43. Hayden, M.R. Hypothesis: Astrocyte Foot Processes Detachment from the Neurovascular Unit in Female Diabetic Mice May Impair Modulation of Information Processing-Six Degrees of Separation. Brain Sci. 2019, 9, 83.
  44. Salameh, T.S.; Mortell, W.; Hayden, M.R.; Banks, W.A. Role of Leptin in Blood-Brain Barrier Dysfunction. In Poster Session Presented at: American Diabetes Association. Poster Number 1958-P 2019 June 7–10; American Diabetes Association: San Francisco, CA, USA, 2019; Available online: (accessed on 19 April 2021).
  45. Ransohoff, R.M.; Perry, V.H. Microglial physiology: Unique stimuli, specialized responses. Annu. Rev. Immunol. 2009, 27, 119–145.
  46. Tambuyzer, B.R.; Ponsaerts, P.; Nouwen, E.J. Microglia: Gatekeepers of the central nervous system immunology. J. Leukoc. Biol. 2009, 85, 352–370.
  47. Glass, C.K.; Saijo, K.; Winner, B.; Marchetto, M.C.; Gage, F.H. Mechanisms underlying inflammation in neurodegeneration. Cell 2010, 140, 918–934.
  48. Ransohoff, R.M. A polarizing question: Do M1 and M2 microglia exist? Nat. Neurosci. 2016, 19, 987–991.
  49. Crotti, A.; Ransohoff, R.M. Microglial physiology and pathophysiology: Insights from genome-wide transcriptional profiling. Immunity 2016, 44, 505–515.
  50. Orihuela, R.; McPherson, C.A.; Harry, G.J. Microglial M1/M2 polarization and metabolic states. Br. J. Pharmacol. 2016, 173, 649–665.
  51. Tang, Y.; Le, W. Differential roles of M1 and M2 microglia in neurodegenerative diseases. Mol. Neurobiol. 2016, 53, 1181–1194.
  52. Liu, Y.; Li, M.; Zhang, Z.; Ye, Y.; Zhou, J. Role of microglia-neuron interactions in diabetic encephalopathy. Ageing Res. Rev. 2017, 42, 28–39.
  53. Koellhoffer, E.C.; McCullough, L.D.; Ritzel, R.M. Old maids: Aging and its impact on microglia function. Int. J. Mol. Sci. 2017, 18, 769.
  54. Pósfai, B.; Cserép, C.; Orsolits, B.; Dénes, Á. New Insights into microglia-neuron interactions: A neuron’s perspective. Neuroscience 2019, 405, 103–117.
  55. Tang, Y. Editorial: Microglial polarization in the pathogenesis and therapeutics of neurodegenerative diseases. Front. Aging Neurosci. 2019, 13, 542.
  56. Sousa, C.; Biber, K.; Micheluccie, A. Cellular and molecular characterization of microglia: A unique immune cell population. Front. Immunol. 2017, 8, 198.
  57. Lin, B.; Koibuchi, N.; Hasegawa, Y.; Sueta, D.; Toyama, K.; Uekawa, K.; Ma, M.; Nakagawa, T.; Kusaka, H.; Kim-Mitsuyama, S. Glycemic control with empagliflozin, a novel selective SGLT2 inhibitor, ameliorates cardiovascular injury and cognitive dysfunction in obese and type 2 diabetic mice. Cardiovasc. Diabetol. 2014, 13, 148.
  58. Habibi, J.; Aroor, A.R.; Sowers, J.R.; Jia, G.; Hayden, M.R.; Garro, M.; Barron, B.; Mayoux, E.; Rector, R.S.; Whaley-Connell, A.; et al. Sodium glucose transporter 2 (SGLT2) inhibition with empagliflozin improves cardiac diastolic function in a female rodent model of diabetes. Cardiovasc. Diabetol. 2017, 16, 9.
  59. Ramos-Rodriguez, J.J.; Ortiz, O.; Jimenez-Palomares, M.; Kay, K.R.; Berrocoso, E.; Murillo-Carretero, M.I.; Perdomo, G.; Spires-Jones, T.; Cozar-Castellano, I.; Lechuga-Sancho, A.M.; et al. Differential central pathology and cognitive impairment in pre-diabetic and diabetic mice. Psychoneuroendocrinology 2013, 38, 2462–2475.
  60. Jiménez, A.J.; Domínguez-Pinos, M.D.; Guerra, M.M.; Fernández-Llebrez, P.F.; Pérez-Fígares, J.M. Structure and function of the ependymal barrier and diseases associated with ependyma disruption. Tissue Barriers 2014, 2, e28426.
  61. Iliff, J.J.; Wang, M.; Liao, Y.; Plogg, B.A.; Peng, W.; Gundersen, G.A.; Benveniste, H.; Vates, G.E.; Deane, R.; Goldman, S.A.; et al. A Paravascular Pathway Facilitates CSF Flow Through the Brain Parenchyma and the Clearance of Interstitial Solutes, Including Amyloid β. Sci. Transl. Med. 2012, 4, 147ra111.
  62. Iliff, J.J.; Nedergaard, M. Is there a cerebral lymphatic system? Stroke 2013, 44, S93–S95.
  63. Jessenm, N.A.; Munk, A.S.; Lundgarrd, I.; Nedergaard, M. The glymphatic system—A beginner’s guide. Neurochem. Res. 2015, 40, 2583–2599.
  64. Kida, S.; Pantazis, A.; Weller, R.O. CSF drains directly from the subarachnoid space into nasal lymphatics in the rat. Anatomy, histology and immunological significance. Neuropathol. Appl. Neurobiol. 1993, 19, 480–488.
  65. Weller, R.O.; Sharp, M.M.; Christodoulides, M.; Carare, R.O.; Mollgard, K. The meninges as barriers and facilitators for the movement of fluid, cells and pathogens related to the rodent and human CNS. Acta Neuropathol. 2018, 135, 363–385.
  66. Johanson, C.E.; Johanson, N.L. Choroid Plexus Blood-CSF Barrier: Major Player in Brain Disease Modeling and Neuromedicine. J. Neurol. Neuromed. 2018, 3, 39–58.
  67. Bacyinski, A.; Maosheng, X.U.; Wang, W.; Hu, J. The paravascular pathway for brain current understanding, significance and controversy. Front. Neroanat. 2017, 11, 101.
  68. Liddelow, S.A. Development of the choroid plexus and blood-CSF barrier. Front. Neurosci. 2015, 9, 32.
  69. Mazucanti, C.H.; Liu, Q.R.; Lang, D.; Huang, N.; O’Connell, J.F.; Camandola, S.; Egan, J.M. Release of insulin produced by the choroid plexis is regulated by serotonergic signaling. JCI Insight 2019, 4, e131682.
  70. Horstmann, E. Die Faserglia des Selachiergehirns. Z. Zellforsch. Mikrosk. Anat. 1954, 39, 588–617.
  71. Rodríguez, E.M.; Blázquez, J.L.; Pastor, F.E.; Peláez, B.; Peña, P.; Peruzzo, B.; Amat, P. Hypothalamic tanycytes: A key component of brain-endocrine interaction. Int. Rev. Cytol. 2005, 247, 89–164.
  72. Gao, Y.; Tschöp, M.H.; Luquet, S. Hypothalamic tanycytes: Gatekeepers to metabolic control. Cell Metab. 2014, 19, 173–175.
  73. Balland, E.; Dam, J.; Langlet, F.; Caron, E.; Steculorum, S.; Messina, A.; Rasika, S.; Falluel-Morel, A.; Anouar, Y.; Dehouck, B.; et al. Hypothalamic tanycytes are an ERK-gated conduit for leptin into the brain. Cell Metab. 2014, 19, 293–301.
  74. Erickson, M.A.; Banks, W.A. Neuroimmune Axes of the Blood-Brain Barriers and Blood-Brain Interfaces: Bases for Physiological Regulation, Disease States, and Pharmacological Interventions. Pharmacol. Rev. 2018, 70, 278–314.
  75. Harrison, L.; Schriever, S.C.; Feuchtinger, A.; Kyriakou, E.; Baumann, P.; Pfuhlmann, K.; Messias, A.C.; Walch, A.; Tschöp, M.H.; Pfluger, P.T. Fluorescent blood-brain barrier tracing shows intact leptin transport in obese mice. Int. J. Obes. 2019, 43, 1305–1318.
  76. Elizondo-Vega, R.; Cortes-Campos, C.; Barahona, M.J.; Oyarce, K.A.; Carril, C.A.; García-Robles, M.A. The role of tanycytes in hypothalamic glucosensing. J. Cell. Mol. Med. 2015, 19, 1471–1482.
  77. Raikwar, S.P.; Bhagavan, S.M.; Ramaswamy, S.B.; Thangavel, R.; Dubova, I.; Selvakumar, G.P.; Ahmed, M.E.; Kempuraj, D.; Zaheer, S.; Iyer, S.; et al. Are Tanycytes the Missing Link Between Type 2 Diabetes and Alzheimer’s Disease? Mol. Neurobiol. 2019, 56, 833–843.
  78. Zlokovic, B.V.; Jovanovic, S.; Miao, W.; Samara, S.; Verma, S.; Farrell, C.L. Differential regulation of leptin transport by the choroid plexus and blood-brain barrier and high affinity transport systems for entry into hypothalamus and across the blood-cerebrospinal fluid barrier. Endocrinology 2000, 141, 1434–1441.
More
Information
Contributor MDPI registered users' name will be linked to their SciProfiles pages. To register with us, please refer to https://encyclopedia.pub/register :
View Times: 624
Revisions: 2 times (View History)
Update Date: 01 Jun 2021
1000/1000